云澈趋势论

vip
Market Analyst
Futures Trading Strategist
On-chain Analyst
No content yet
Early morning Ethereum showed strong upward movement, reaching a high of $3,266 before facing resistance and pulling back. The current price has retraced to around $3,220. Our long positions established in the early morning successfully took profit of over 80 points, once again confirming our precise grasp of the upward trend. Although the bullish momentum is still being released and the key support at $3,200 has not been broken, there is a clear short-term need for a correction.
After a nearly 250-point surge in a short period, the price encountered significant resistance near $3,266 and bega
ETH2,11%
View Original
post-image
  • Reward
  • Comment
  • Repost
  • Share
Bitcoin surged to $94,700 early this morning before facing resistance and pulling back, currently hovering around $94,000. Our previous long positions based on trend analysis have successfully taken profit of over 800 points, confirming that the bullish momentum still exists. Key support levels to watch are around 93,500.
Although the overall trend remains unchanged, there is a significant short-term correction demand: after a nearly 5,000-point rally from the lows, the price shows clear resistance near 94,700, and short-term technical indicators have entered overbought territory, with a large
BTC1,39%
View Original
post-image
post-image
  • Reward
  • Comment
  • Repost
  • Share
Evening market: Bitcoin retreated from the morning high of 93,300 and is currently consolidating within the key range of 92,000-92,500. This correction can be seen as a technical confirmation after the early breakthrough of the 92,000 threshold. The price stopped falling after precisely retesting the previous breakout point, indicating that the support below remains effective. Overall, the bullish trend has not been broken, and the current adjustment is a normal accumulation phase within the upward process.
From the perspective of the bulls and bears, 92,500 is the key dividing line for streng
BTC1,39%
View Original
post-image
post-image
  • Reward
  • Comment
  • Repost
  • Share
Based on the early morning trend, Ethereum successfully rebounded from the 3115 level. It has now regained the key position of 3130 and reached a high of around 3155. This indicates that the 3115–3130 zone has formed an effective support area, easing short-term bearish pressure.
From a technical perspective, the price has returned above 3130, confirming the support strength at this level, and the short-term trend is gradually shifting to bullish dominance. If the price can continue to stay above 3130, there is potential for further upward testing of the resistance zone at 3180–3200 in the morn
ETH2,11%
View Original
post-image
  • Reward
  • Comment
  • Repost
  • Share
Bitcoin rebounded strongly after touching $89,800, and has now stabilized above the key psychological level of $90,000. Currently, it is trading around $90,500. The rebound was accompanied by continuous volume increase from the bulls, indicating strong buying momentum, which provides solid support for the price to challenge the resistance near $91,000 again.
From a technical perspective, $90,000 has shifted from resistance to initial support. If the daily close remains above this level, the short-term trend will stay bullish. The next key target is at $91,000. A successful breakthrough of this
BTC1,39%
View Original
post-image
post-image
  • Reward
  • Comment
  • Repost
  • Share
From the market perspective, Bitcoin surged to 90,500 in the morning before pulling back to around 89,600, which is a healthy consolidation in an upward trend. The price found support at the key moving averages on the hourly chart and did not break below the strong support zone of 89,000-89,300 with increased volume, indicating that the bullish pattern remains intact. The current pullback is more likely to be a preparation for the next upward move.
Technical indicators also support a bullish outlook: the hourly RSI has recovered from overbought territory to neutral, and the MACD momentum remai
BTC1,39%
View Original
post-image
post-image
  • Reward
  • Comment
  • Repost
  • Share
Last night, the market experienced intense volatility within the 88400-90900 range. Although there were obvious two-way pinning during the session, the price ultimately stabilized around 90100, indicating that the bulls still maintain resilience at the key support area. After a quick dip to 88400, a rapid rebound occurred, showing strong buying interest at that level, and the bears failed to effectively break through the defense line.
From a structural perspective, the pattern of gradually rising lows and continuous testing of highs in a oscillating upward trend has not been broken. Currently,
BTC1,39%
View Original
post-image
  • Reward
  • 2
  • Repost
  • Share
鑫鑫鑫赚vip:
Experienced driver, guide me 📈
View More
Bitcoin sharply broke through and stabilized above the key resistance level of $88,000 in the early morning, successfully turning this important threshold into a support platform for subsequent upward movement. The price then further rose above $88,500, showing a healthy breakout pattern with rising volume and price, indicating strong bullish momentum and a significant shift in market sentiment towards optimism.
From a technical perspective, this effective breakout marks the establishment of a new upward trend, with the market focus overall shifting higher. In the short term, the market is exp
BTC1,39%
View Original
post-image
post-image
  • Reward
  • Comment
  • Repost
  • Share
Currently, Ethereum is oscillating around 2970, with a technical structure showing signs of weak rebound. Although the price has rebounded from the support level of 2960, the hourly chart is approaching a key resistance zone, and multiple indicators are signaling weakening momentum.
From a technical indicator perspective, the price is clearly under pressure near 2975, close to the middle band of the hourly Bollinger Bands and the lower edge of the previous small-cycle consolidation platform, forming a short-term critical resistance. During the rebound, trading volume has continued to decline,
ETH2,11%
View Original
post-image
post-image
  • Reward
  • Comment
  • Repost
  • Share
Bitcoin's current rebound to around 87,700 faces significant resistance at this level, which is within the dense pressure zone of 87,800-88,000. During the rebound, trading volume continues to decline, showing signs of volume-price divergence. The hourly moving average system is gradually narrowing and shows a potential death cross. The MACD and RSI indicators are weakening simultaneously, indicating that bullish momentum is diminishing.
If the price cannot effectively break through the 88,000 barrier, it may test the key support at 87,200 again in the short term. If this support level is brok
BTC1,39%
View Original
post-image
post-image
  • Reward
  • Comment
  • Repost
  • Share
Yesterday, Bitcoin briefly surged to 89,200 due to data stimuli but quickly retreated amid the mood of a high open and low close in the US stock market, forming a typical "bullish momentum exhausted" pattern. Currently, the price is lacking momentum in its rebound, facing resistance at the 88,000 level. Technical indicators show a weak rebound with limited volume and are constrained by the key resistance zone at 89,200-89,500. The subsequent waterfall decline indicates strong bearish momentum.
The overall structure has shifted to a bearish bias. The 4-hour indicators are weakening, and the pri
BTC1,39%
View Original
post-image
post-image
  • Reward
  • 1
  • Repost
  • Share
MyFavoriteFoodIsHotPot.vip:
2026 Go Go Go 👊
From a technical structure perspective, the 88000 level serves as a low point for the early morning pullback, resonating with recent small-cycle platform support. The market shows clear resilience at this level, with no signs of volume breakout or breakdown, indicating that this support zone is effective and the short-term downside space is limited. The price has currently rebounded modestly above 88300, attempting to regain stability on the short-term moving averages, laying a foundation for subsequent rebound and recovery.
On momentum indicators, the hourly RSI and KDJ have both turned upwar
BTC1,39%
View Original
post-image
post-image
  • Reward
  • Comment
  • Repost
  • Share
Bitcoin price continues to fluctuate within the 87000-87300 range, with the daily moving average system still showing a bullish alignment. The 8700 level has formed a temporary support platform. The current market exhibits clear signs of a high-level correction, but multiple tests without breaking below indicate solid buying support below, and selling pressure is gradually easing.
From the momentum indicators, the hourly MACD shows a golden cross above the zero line, with green momentum bars beginning to slightly expand. The RSI has also gently risen from the neutral 50 area to around 55, indi
BTC1,39%
View Original
  • Reward
  • Comment
  • Repost
  • Share
Bitcoin Technical Analysis: Bullish Retracement Confirming Support, Preparing for a Second Surge
Although there was a rapid correction in the afternoon, the price stabilized precisely within the 86900-87000 range and quickly rebounded, which exactly completed the retest of the key breakout level at 88100 and the extension support zone below it. This dip was not accompanied by sustained heavy selling pressure, indicating that the main chip structure remains stable, representing a healthy technical shakeout rather than a trend reversal.
From a technical perspective, the 87000 level has formed a
BTC1,39%
View Original
  • Reward
  • 1
  • Repost
  • Share
GoToMarsvip:
It's all fallen apart like this, are there still bullish traders?
Although Bitcoin showed a strong breakout above resistance and reached a high of 90375 in the morning, the current technical outlook clearly indicates a risk of correction. The price is under significant pressure at the key psychological level of 90000-91000, with signs of volume-price divergence on the hourly chart, and the 4-hour RSI has entered the extreme overbought zone above 85. Historical data suggests that this level is usually accompanied by a 5%-8% technical correction.
From a key level perspective, 90000-90375 has become the primary intraday resistance zone. If the price cannot stab
BTC1,39%
View Original
post-image
post-image
  • Reward
  • Comment
  • Repost
  • Share
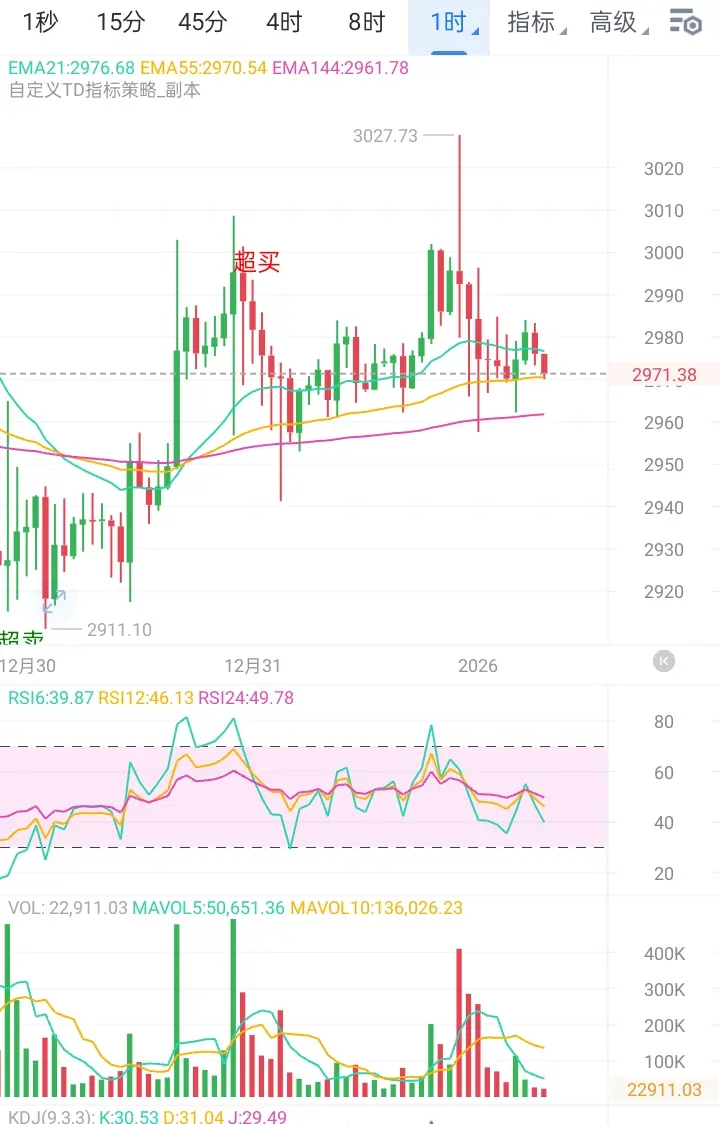
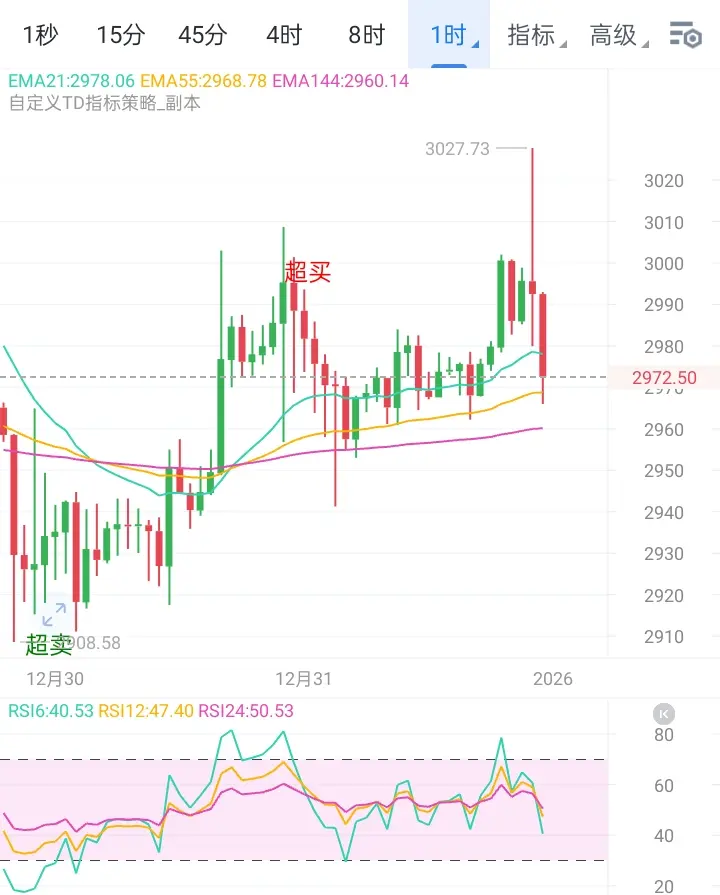
Currently, Ethereum's price remains under pressure after touching the $2960 resistance level, and is now oscillating within the $2900-$2960 range. Although the price is hovering around $2950, technical indicators show that the short-term upside potential is limited, and bearish pressure is building.
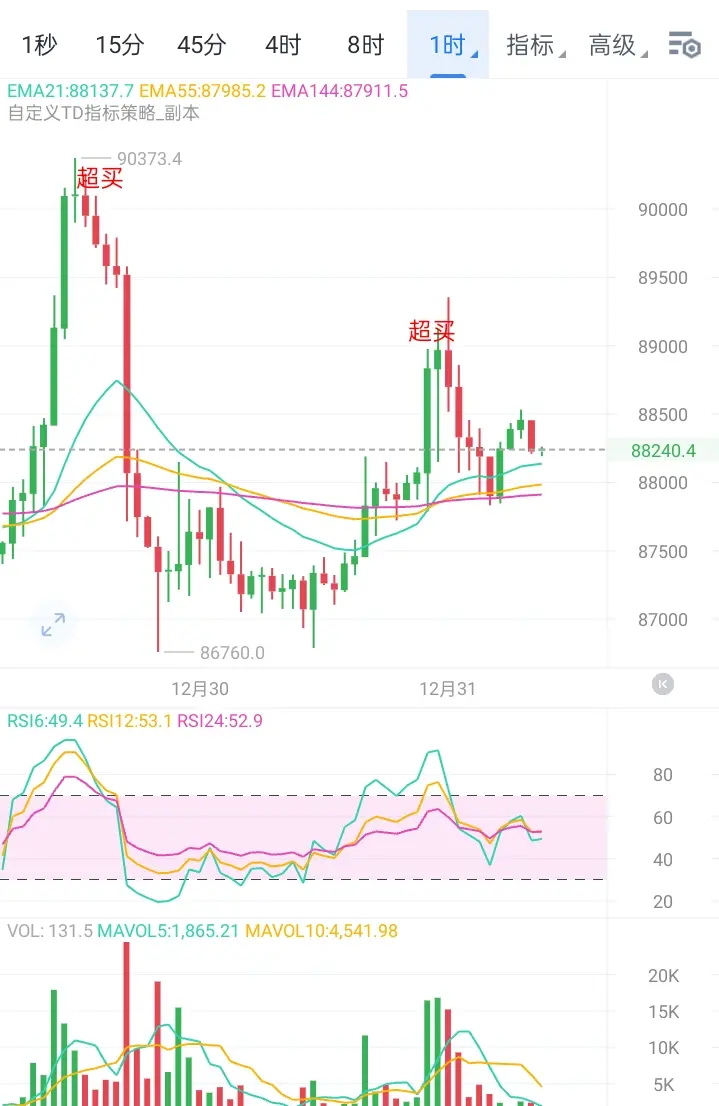
From the market perspective, multiple tests of the $2960 resistance have failed to produce a valid breakout, indicating significant supply pressure in that area. The market continues to consolidate at high levels but has not made new highs, forming a "double top, sideways consolidation" bearish pat
ETH2,11%
View Original
  • Reward
  • 1
  • Repost
  • Share
MingDragonXvip:
Merry Christmas ⛄
Currently, Bitcoin continues to face pressure after reaching the key resistance level of $88,100. The price is fluctuating within a narrow range of $87,000-$88,000. Multiple failed attempts to break through indicate significant selling pressure in this area, and the market lacks effective buying momentum to push the price higher. The sideways consolidation at high levels suggests that short-term bullish momentum is waning.
Structurally, the price has been unable to stabilize above $88,000, and the center of oscillation has not shifted upward, forming a potential stage top pattern. If the subse
BTC1,39%
View Original
post-image
  • Reward
  • Comment
  • Repost
  • Share
From a technical analysis perspective, the current price movement is highly similar to the fractal structure at the top of the 2021 bull market, indicating that the risk of a deep correction is continuously accumulating. Although the market may be gearing up for a super cycle in 2026, increased institutional dominance and waning social interest together suppress market volatility, forming a liquidity trap. The four-hour chart shows that the triangle convergence zone is continuously tightening, and the rebound momentum has already weakened. If the price cannot effectively break through the key
BTC1,39%
View Original
post-image
  • Reward
  • Comment
  • Repost
  • Share
  • Pin

Trade Crypto Anywhere Anytime
qrCode
Scan to download Gate App
Community
  • 简体中文
  • English
  • Tiếng Việt
  • 繁體中文
  • Español
  • Русский
  • Français (Afrique)
  • Português (Portugal)
  • Bahasa Indonesia
  • 日本語
  • بالعربية
  • Українська
  • Português (Brasil)