11.12 Midday Bitcoin / Ethereum
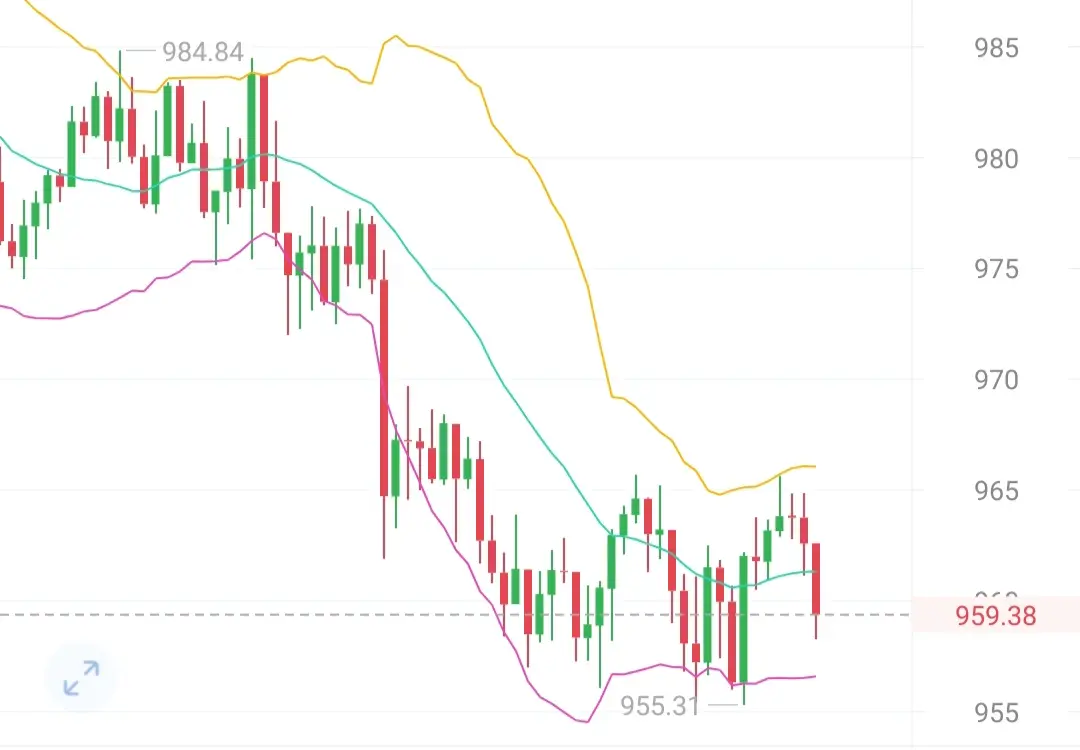
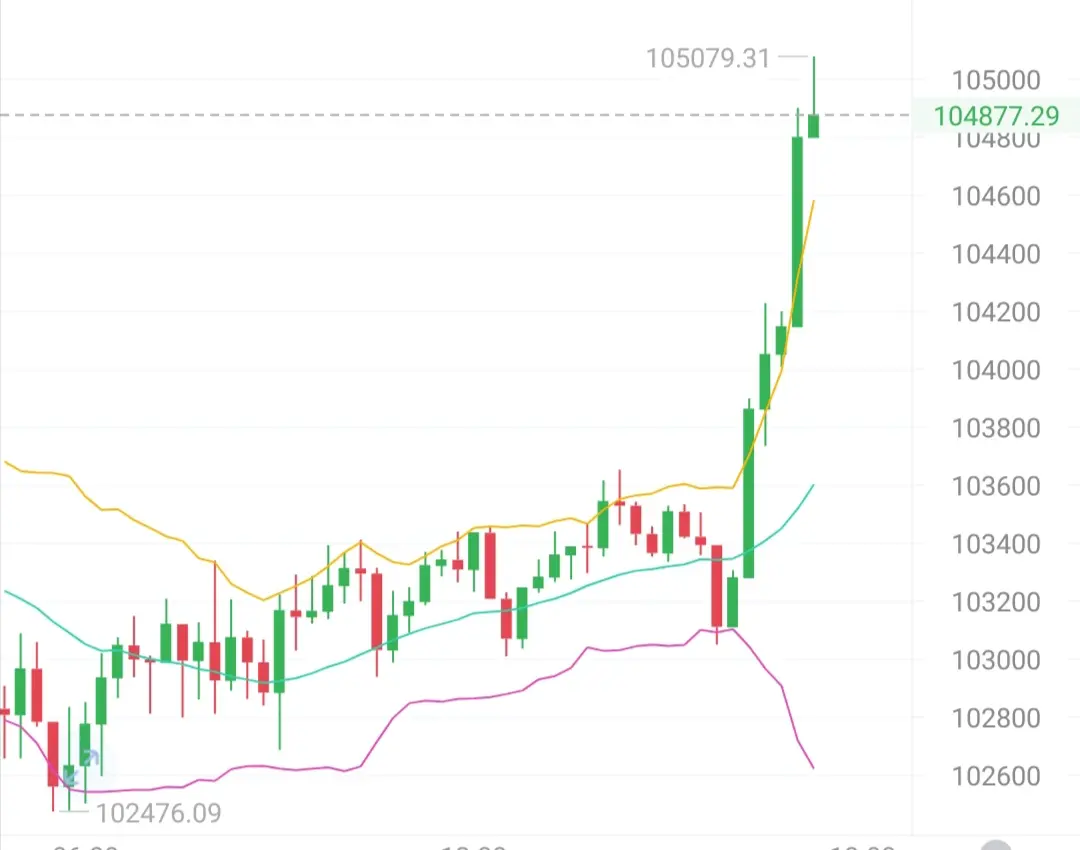
The hourly chart continues to trade narrowly between 103,000 and 103,500. The support level below has been tested multiple times without effective breakdown, showing some resilience to declines. However, the upward momentum also lacks the strength to break through, currently resulting in a sideways pattern of balance between bulls and bears.
In the MACD indicator, DIF and DEA remain below the zero line, indicating a bearish trend; however, the green bars are continuously shrinking, reflecting that the bearish momentum is gradually weakening. In the short term, d
View OriginalThe hourly chart continues to trade narrowly between 103,000 and 103,500. The support level below has been tested multiple times without effective breakdown, showing some resilience to declines. However, the upward momentum also lacks the strength to break through, currently resulting in a sideways pattern of balance between bulls and bears.
In the MACD indicator, DIF and DEA remain below the zero line, indicating a bearish trend; however, the green bars are continuously shrinking, reflecting that the bearish momentum is gradually weakening. In the short term, d