2025 ATR Price Prediction: Expert Analysis and Market Outlook for the Coming Year

Introduction: ATR's Market Position and Investment Value
Artrade (ATR) stands as the first marketplace for art RWA (real world assets), powered by the ATR token. Since its launch in April 2024, the project has established itself within the emerging real-world asset tokenization sector. As of December 2025, ATR has achieved a market capitalization of approximately $3.53 million, with a circulating supply of approximately 1.26 billion tokens, currently trading at $0.002798 per token. This innovative asset, recognized as a "pioneering art RWA platform," is playing an increasingly pivotal role in bridging the gap between physical art assets and blockchain technology.
This article will provide a comprehensive analysis of Artrade's price trajectory and market dynamics, examining historical patterns, market supply and demand dynamics, ecosystem development, and macroeconomic factors. Our analysis will offer investors professional price forecasts and practical investment strategies to navigate the ATR market landscape effectively.
I. ATR Price History Review and Current Market Status
ATR Historical Price Trajectory
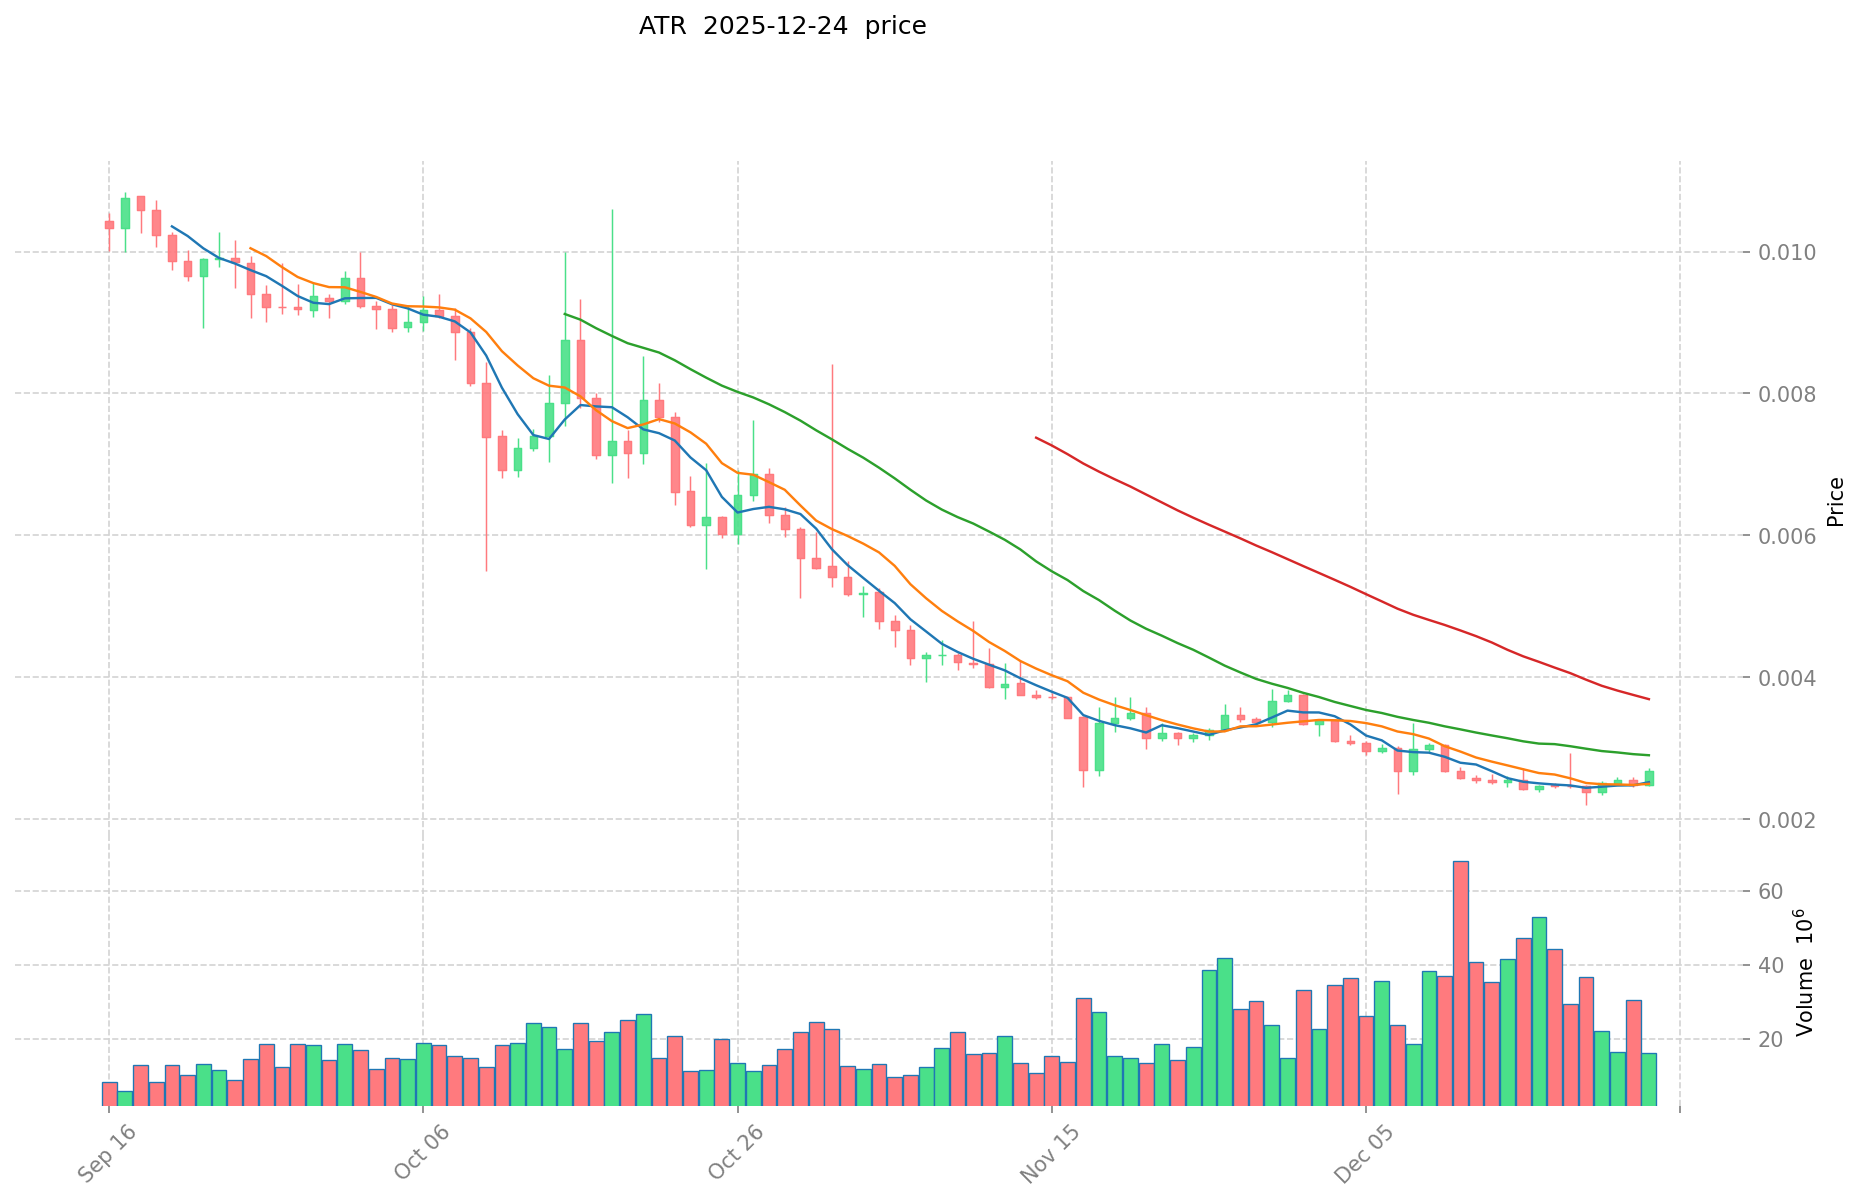
- April 2024: ATR reached its all-time high of $0.104, marking the peak of its market cycle.
- December 2025: ATR declined to its all-time low of $0.002194 on December 19, 2025, representing a significant correction of approximately 97.89% from the historical peak.
ATR Current Market Situation
As of December 24, 2025, ATR is trading at $0.002798, with a market capitalization of $3,525,771.15 and a fully diluted valuation of $5,020,262.85. The token shows a 24-hour trading volume of $32,042.90, with 12,833 active holders distributed across the Solana blockchain network.
Over the past 24 hours, ATR has gained 12.68% in value, while the 7-day performance shows a 14.16% increase. However, the month-to-date performance reflects a decline of 12.049%, and the year-to-date performance shows a substantial loss of 93.61% from its publish price of $0.0401.
The circulating supply stands at 1,260,104,055.33 ATR tokens out of a total supply of 1,794,232,613.33 tokens, with a maximum supply capped at 1,800,000,000 tokens. The circulating supply ratio is 70.01%, indicating that the majority of tokens are already in circulation.
Currently, the token ranks 1,751 by market capitalization among all cryptocurrencies. ATR is primarily traded on 4 exchanges and maintains a market dominance of 0.00015%.
Click to view current ATR market price
ATR 市场情绪指标
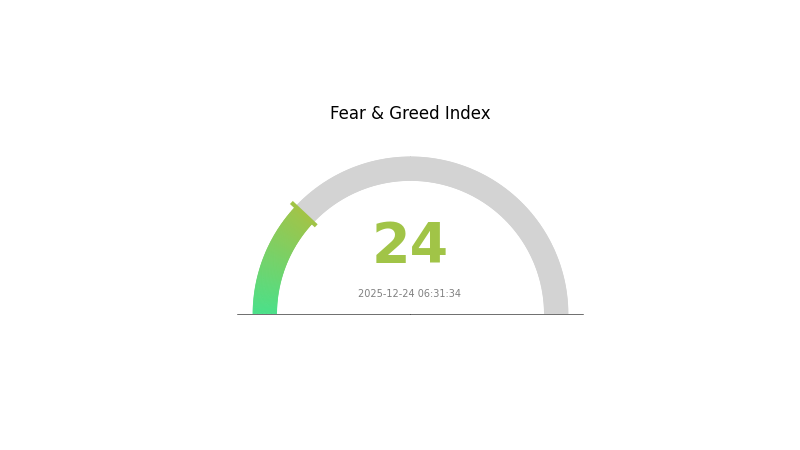
2025-12-24 恐惧与贪婪指数:24(Extreme Fear)
Click to view current Fear & Greed Index
The crypto market is currently experiencing extreme fear, with the Fear and Greed Index at 24. This indicates significant market anxiety and pessimistic sentiment among investors. During periods of extreme fear, markets often present contrarian opportunities for long-term investors. However, caution is warranted as further downside risk may exist. Monitor key support levels closely and consider dollar-cost averaging strategies rather than aggressive accumulation. Such fearful conditions typically precede market recoveries, making this a critical time for portfolio rebalancing and risk management on Gate.com.
ATR Holdings Distribution
The address holdings distribution chart illustrates the concentration of ATR token ownership across the blockchain network, revealing the percentage of total token supply held by individual addresses. This metric serves as a critical indicator for assessing market decentralization levels, identifying potential whale concentrations, and evaluating vulnerability to coordinated selling or market manipulation.
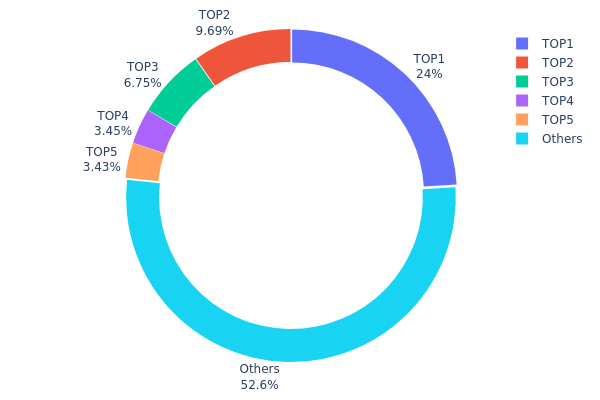
Current analysis of ATR's holdings distribution reveals a moderate concentration pattern with notable whale presence. The top five addresses collectively control approximately 47.33% of the total token supply, with the largest holder maintaining 24.04% of all ATR tokens. The second-largest address holds 9.68%, while the third through fifth positions range from 6.74% to 3.43% respectively. This distribution suggests that while significant capital is concentrated among a limited number of addresses, over half of all tokens (52.67%) remain distributed among other holders, providing a degree of resilience against single-entity manipulation.
The current holdings structure presents a balanced risk profile. Although the top holder's 24.04% stake represents substantial influence over network governance and potential market movements, the absence of a dominant single address exceeding 30% threshold, combined with the relatively distributed nature of remaining tokens, indicates that ATR maintains reasonable decentralization characteristics. However, coordinated action among the top five addresses could theoretically influence market dynamics, warranting continued monitoring of these major positions for strategic movements or redistribution patterns.
Click to view current ATR Holdings Distribution
| Top | Address | Holding Qty | Holding (%) |
|---|---|---|---|
| 1 | 5ktznV...xFtnr6 | 302864.42K | 24.04% |
| 2 | ASTyfS...g7iaJZ | 122022.10K | 9.68% |
| 3 | 7XQtbQ...JjASe6 | 85000.00K | 6.74% |
| 4 | 5Q544f...pge4j1 | 43402.42K | 3.44% |
| 5 | u6PJ8D...ynXq2w | 43220.75K | 3.43% |
| - | Others | 662864.01K | 52.67% |
Analysis of Core Factors Influencing ATR's Future Price Movement
II. Core Factors Affecting ATR's Future Price
Market Volatility Dynamics
-
Volatility Measurement Function: ATR does not predict trend direction or price appreciation/depreciation. Instead, it functions as a market "energy meter"—the higher the ATR value, the more severe the price fluctuations; the lower the ATR value, the more stable the market becomes. This characteristic makes it an essential tool for risk management and trend trading.
-
Historical Patterns: When ATR values rise, it indicates market volatility is increasing, potentially signaling a trend shift. Conversely, when ATR values decline, it indicates weakening market volatility, potentially suggesting trend continuation.
-
Current Impact: Traders must closely monitor market movements, economic data releases, and policy changes that influence ATR values, adjusting trading strategies and stop-loss points accordingly in real-time.
Risk Management and Trading Applications
-
Stop-Loss Optimization: ATR serves as a core instrument for setting ideal stop-loss points. The formula typically employed is: Stop-Loss Price = Entry Price - (ATR Value × Multiplier). This dynamic approach allows traders to adapt their risk parameters to current market conditions rather than relying on static percentage-based stops.
-
Breakout System Integration: ATR functions as a volatility indicator within breakout trading systems. Traders utilize ATR channels to identify price breakout points, combining it with traditional tools such as trend lines and support/resistance levels. When price breaks above the upper ATR channel boundary, it signals potential upward momentum; conversely, breaks below the lower boundary suggest downward pressure.
-
Position Sizing Strategy: ATR values directly inform position sizing decisions. Higher ATR readings warrant smaller position sizes to maintain consistent risk exposure, while lower ATR readings may allow for larger positions given the reduced price volatility.
Note: ATR is a volatility-measuring technical indicator that reflects market energy levels rather than predicting future price direction. Its primary value lies in enhancing risk management frameworks and optimizing trade execution parameters within quantitative trading systems.
Three、2025-2030 ATR Price Forecast
2025 Outlook
- Conservative Forecast: $0.00263-$0.00280
- Neutral Forecast: $0.00280-$0.00341
- Optimistic Forecast: $0.00341 (requiring sustained market sentiment and positive ecosystem developments)
2026-2028 Medium-term Outlook
- Market Stage Expectation: Gradual recovery phase with incremental growth, characterized by consolidation and accumulation patterns as market participants reassess token fundamentals.
- Price Range Forecast:
- 2026: $0.00242-$0.00345 (11% upside potential)
- 2027: $0.00272-$0.00397 (17% upside potential)
- 2028: $0.00228-$0.00417 (29% upside potential)
- Key Catalysts: Protocol upgrades and feature enhancements, increased institutional adoption through platforms like Gate.com, expansion of use cases within the ecosystem, and strengthening market cycle dynamics.
2029-2030 Long-term Outlook
- Base Case: $0.00300-$0.00549 (39% upside potential by 2029; requiring stable regulatory environment and sustained adoption)
- Optimistic Scenario: $0.00389-$0.00690 (67% upside potential by 2030; assuming accelerated ecosystem growth and broader market recovery)
- Transformational Scenario: $0.00690+ (assuming breakthrough developments in network utility, major partnership announcements, and favorable macroeconomic conditions)
- 2030-12-31: ATR targets $0.00690 (consolidation phase with potential for range-bound trading as market participants lock in gains)
| 年份 | 预测最高价 | 预测平均价格 | 预测最低价 | 涨跌幅 |
|---|---|---|---|---|
| 2025 | 0.00341 | 0.0028 | 0.00263 | 0 |
| 2026 | 0.00345 | 0.00311 | 0.00242 | 11 |
| 2027 | 0.00397 | 0.00328 | 0.00272 | 17 |
| 2028 | 0.00417 | 0.00362 | 0.00228 | 29 |
| 2029 | 0.00549 | 0.00389 | 0.003 | 39 |
| 2030 | 0.0069 | 0.00469 | 0.00277 | 67 |
Artrade (ATR) Professional Investment Strategy and Risk Management Report
I. Executive Summary
Artrade (ATR) is the first marketplace for art Real World Assets (RWA), powered by the ATR token built on the Solana blockchain. As of December 24, 2025, ATR is trading at $0.002798 with a market capitalization of approximately $3.53 million and a 24-hour trading volume of $32,042.90. The token has experienced significant volatility, with a 12.68% gain in the past 24 hours but a concerning 93.61% decline over the past year.
II. ATR Market Overview and Current Status
Token Fundamentals
| Metric | Value |
|---|---|
| Current Price | $0.002798 |
| Market Cap | $3,525,771.15 |
| Fully Diluted Valuation | $5,020,262.85 |
| Circulating Supply | 1,260,104,055.33 ATR |
| Total Supply | 1,794,232,613.33 ATR |
| Max Supply | 1,800,000,000 ATR |
| 24H Trading Volume | $32,042.90 |
| Market Ranking | #1,751 |
| Token Holders | 12,833 |
Price Performance Analysis
Short-term Performance:
- 1-hour change: +2.98%
- 24-hour change: +12.68%
- 7-day change: +14.16%
Medium to Long-term Performance:
- 30-day change: -12.049%
- 1-year change: -93.61%
Historical Price Levels:
- All-Time High: $0.104 (April 3, 2024)
- All-Time Low: $0.002194 (December 19, 2025)
- 24-hour High: $0.002799
- 24-hour Low: $0.002473
- Initial Launch Price: $0.0401
Market Characteristics
- Circulating Supply Ratio: 70.01%
- Market Dominance: 0.00015%
- Trading on 4 exchanges
- Active blockchain: Solana (SOL)
III. Artrade Platform and Project Analysis
Project Overview
Artrade represents an innovative approach to tokenizing and trading real-world art assets on blockchain technology. As the first dedicated marketplace for art RWA, the platform leverages the Solana blockchain for fast, cost-efficient transactions, making art investment more accessible to a broader audience.
Key Features
- Blockchain Foundation: Built on Solana for high-speed, low-cost transactions
- Asset Class: Focus on tokenized art and real-world art assets
- Token Utility: ATR serves as the native governance and transaction token
- Market Position: Pioneer in the art RWA segment
Community and Development
- Official Website: https://www.artrade.app/
- Twitter: https://twitter.com/artradeapp
- GitHub Repository: https://github.com/artradeapp/Artrade-base-smart-contract
- Active Developer Community: Smart contract code publicly available
IV. ATR Professional Investment Strategy and Risk Management
ATR Investment Methodology
(1) Long-term Holding Strategy
Target Investors: Investors with high risk tolerance interested in emerging RWA markets, blockchain technology believers, and those seeking early-stage exposure to the art tokenization sector.
Operational Recommendations:
- Dollar-cost averaging (DCA): Invest fixed amounts at regular intervals to mitigate volatility impact
- Position accumulation during significant market downturns when project fundamentals remain intact
- Storage through secure self-custody solutions with proper backup protocols
(2) Active Trading Strategy
Technical Analysis Tools:
- Support and Resistance Levels: Monitor the $0.002194 support (recent ATL) and $0.002799 resistance (24h high)
- Volume Analysis: Track trading volume patterns to confirm price breakouts or reversals
- Moving Average Crossovers: Use 50-day and 200-day MAs to identify trend reversals
Wave Trading Key Points:
- Entry signals: Look for consolidation patterns near $0.0025 support level
- Exit strategy: Target 20-30% gains or implement trailing stop-losses at 15% below entry
- Risk-reward ratio: Maintain minimum 1:2 ratio for each trade
ATR Risk Management Framework
(1) Asset Allocation Principles
Given ATR's high volatility and early-stage market position:
- Conservative Investors: 0.5% - 2% of total portfolio
- Moderate Investors: 2% - 5% of total portfolio
- Aggressive Investors: 5% - 10% of total portfolio
(2) Risk Hedging Solutions
- Position Sizing: Never allocate more than 5% of trading capital to a single position in volatile tokens
- Diversification: Balance ATR holdings with established cryptocurrencies and stablecoins to reduce volatility exposure
(3) Secure Storage Solutions
Self-Custody Recommendation:
- For significant holdings, utilize hardware wallets or air-gapped signing solutions
- For active trading amounts, consider Gate.com Web3 wallet for convenient access with security features
- Enable all available security features including 2FA and withdrawal whitelisting
Security Considerations:
- Never share private keys or seed phrases with anyone
- Use hardware wallets for long-term storage of large positions
- Enable IP address and device whitelisting on trading accounts
- Maintain regular backups of wallet recovery information in secure locations
V. ATR Potential Risks and Challenges
Market Risks
- Extreme Volatility: ATR has experienced a 93.61% decline over the past year, demonstrating severe price instability that could result in substantial losses
- Low Trading Liquidity: Daily volume of $32,042.90 is relatively low, which may cause significant slippage on larger orders
- Limited Market Adoption: With only 12,833 holders and a 70% circulating supply ratio, the token faces questions about sustained demand and market penetration
Regulatory Risks
- RWA Regulatory Uncertainty: The art tokenization and RWA sector operates in an evolving regulatory environment with unclear legal frameworks across jurisdictions
- Asset Custody Concerns: Regulatory treatment of tokenized art assets and underlying physical asset custody remains unresolved in most jurisdictions
- Compliance Changes: Future regulations may significantly impact the viability of art-based RWA marketplaces
Technology Risks
- Smart Contract Vulnerabilities: While code is public on GitHub, undiscovered security vulnerabilities could impact token value and user funds
- Solana Network Dependencies: Any technical issues on the Solana blockchain could disrupt platform functionality
- Limited Development Activity: The project's development pace and resource allocation remain uncertain factors for long-term viability
VI. Conclusion and Action Recommendations
ATR Investment Value Assessment
Artrade (ATR) represents an early-stage venture into the emerging art RWA market with significant technological potential but equally substantial risks. The project's pioneering position in art tokenization offers interesting long-term prospects for believers in real-world asset tokenization. However, the 93.61% annual decline, low liquidity, and small holder base indicate this is an extremely high-risk, speculative investment rather than a stable store of value. The project's success depends on widespread adoption of art tokenization, regulatory clarity, and sustained development efforts—none of which are guaranteed.
ATR Investment Recommendations
✅ Beginners: Allocate only 0.5-1% of portfolio as a learning opportunity; focus on understanding the art RWA sector before significant investment; use only capital you can afford to lose completely.
✅ Experienced Investors: Consider 2-5% allocation as a speculative position; use DCA strategy to build positions gradually; implement strict stop-losses at 20-25% below entry prices.
✅ Institutional Investors: Conduct deep due diligence on project economics and competitive positioning; evaluate the team's execution capability in the RWA space; consider this an early-stage venture capital rather than institutional-grade investment.
ATR Trading Participation Methods
- Gate.com Trading: Access ATR/USDT trading pairs directly on Gate.com exchange for spot trading with competitive fees
- Limit Orders: Use limit order strategies to accumulate ATR at predetermined price levels rather than market orders
- Staking and Governance: If available, participate in platform governance with ATR holdings to understand long-term tokenomics
Cryptocurrency investments carry extreme risk and can result in total loss of capital. This report does not constitute investment advice. All investors should conduct independent research, assess their personal risk tolerance, and consult with qualified financial advisors before making investment decisions. Never invest more than you can afford to lose completely.
FAQ
What is the price of ATR?
The current price of ATR is $121.39, having decreased by 1% in the past 24 hours as of December 24, 2025. Real-time price movements reflect market dynamics and trading volume fluctuations.
Is Altura a good coin?
Altura shows mixed potential with varying analyst predictions. While some forecasts suggest modest growth opportunities toward 2027-2028, others remain cautious about long-term viability. Its performance depends on market conditions and project development progress.
What factors affect ATR price prediction?
ATR price prediction is affected by market volatility, trading volume, price trends, and historical price movements. Higher ATR indicates greater price fluctuations, while lower ATR suggests more stable price action.
What is the historical price performance of ATR?
ATR has declined 22.48% over the past year, trading within a 52-week range of $103.23 to $133.45. Current price remains below yearly highs, reflecting recent market adjustments.
How does ATR compare to other gaming tokens?
ATR stands out in the gaming sector with unique tokenomics and utility features. Compared to other gaming tokens, ATR offers competitive rewards, lower entry barriers, and stronger community governance. Its dedicated gaming ecosystem and innovative incentive mechanisms give it distinct advantages for players and investors seeking exposure to the gaming vertical.
Share
Content
Introduction: ATR's Market Position and Investment Value
I. ATR Price History Review and Current Market Status
II. Core Factors Affecting ATR's Future Price
Three、2025-2030 ATR Price Forecast
I. Executive Summary
II. ATR Market Overview and Current Status
III. Artrade Platform and Project Analysis
IV. ATR Professional Investment Strategy and Risk Management
V. ATR Potential Risks and Challenges
VI. Conclusion and Action Recommendations
FAQ
How to Buy Cryptocurrency


Trending Cryptocurrencies


What is WIF: Understanding the Wallet Import Format in Bitcoin Transactions

2025 WHITEPrice Prediction: Analysis of Market Trends and Future Value Potential

NEON vs THETA: A Comparative Analysis of Next-Generation Neural Network Architectures for AI Applications

SIX vs QNT: Analyzing Performance Metrics of Two Leading Blockchain Technology Platforms

EL vs HBAR: Comparing the Performance and Applications of Different Quantum Computing Architectures
2025 BST Price Prediction: Analyzing Market Trends and Potential Growth Factors

Futures Là Gì? Hướng Dẫn Giao Dịch Futures Cho Người Mới

Is Web3 Dead?

Is cryptocurrency mining legal in Algeria?

Cách Đào Bitcoin Trên Điện Thoại Hiệu Quả Và Mẹo Tối Ưu Tốc Độ Đào
What is the CROSS Token? An In-Depth Guide to Crypto Gaming