2025 JFI Price Prediction: Expert Analysis and Market Forecast for the Coming Year

Introduction: Market Position and Investment Value of JFI
JackPool Finance (JFI) is a one-click DeFi mining aggregation protocol designed for the Tron network, drawing inspiration from yield optimization principles while deploying on a blockchain with faster transaction speeds and lower gas costs. Since its inception in 2020, JFI has established itself as a unique yield farming tool for Tron users. As of January 5, 2026, JFI maintains a market capitalization of $49,347.65 with a circulating supply of 20,999 tokens, currently trading at $2.35 per token. This innovative protocol is recognized as a "yield maximization tool," playing an increasingly important role in the DeFi mining ecosystem on the Tron network.
This article provides a comprehensive analysis of JFI's price movements and market trends, incorporating historical performance patterns, market supply and demand dynamics, ecosystem developments, and macroeconomic factors to deliver professional price forecasts and practical investment strategies for the period through 2031.
JackPool Finance (JFI) Market Analysis Report
I. JFI Price History Review and Current Market Status
JFI Historical Price Evolution
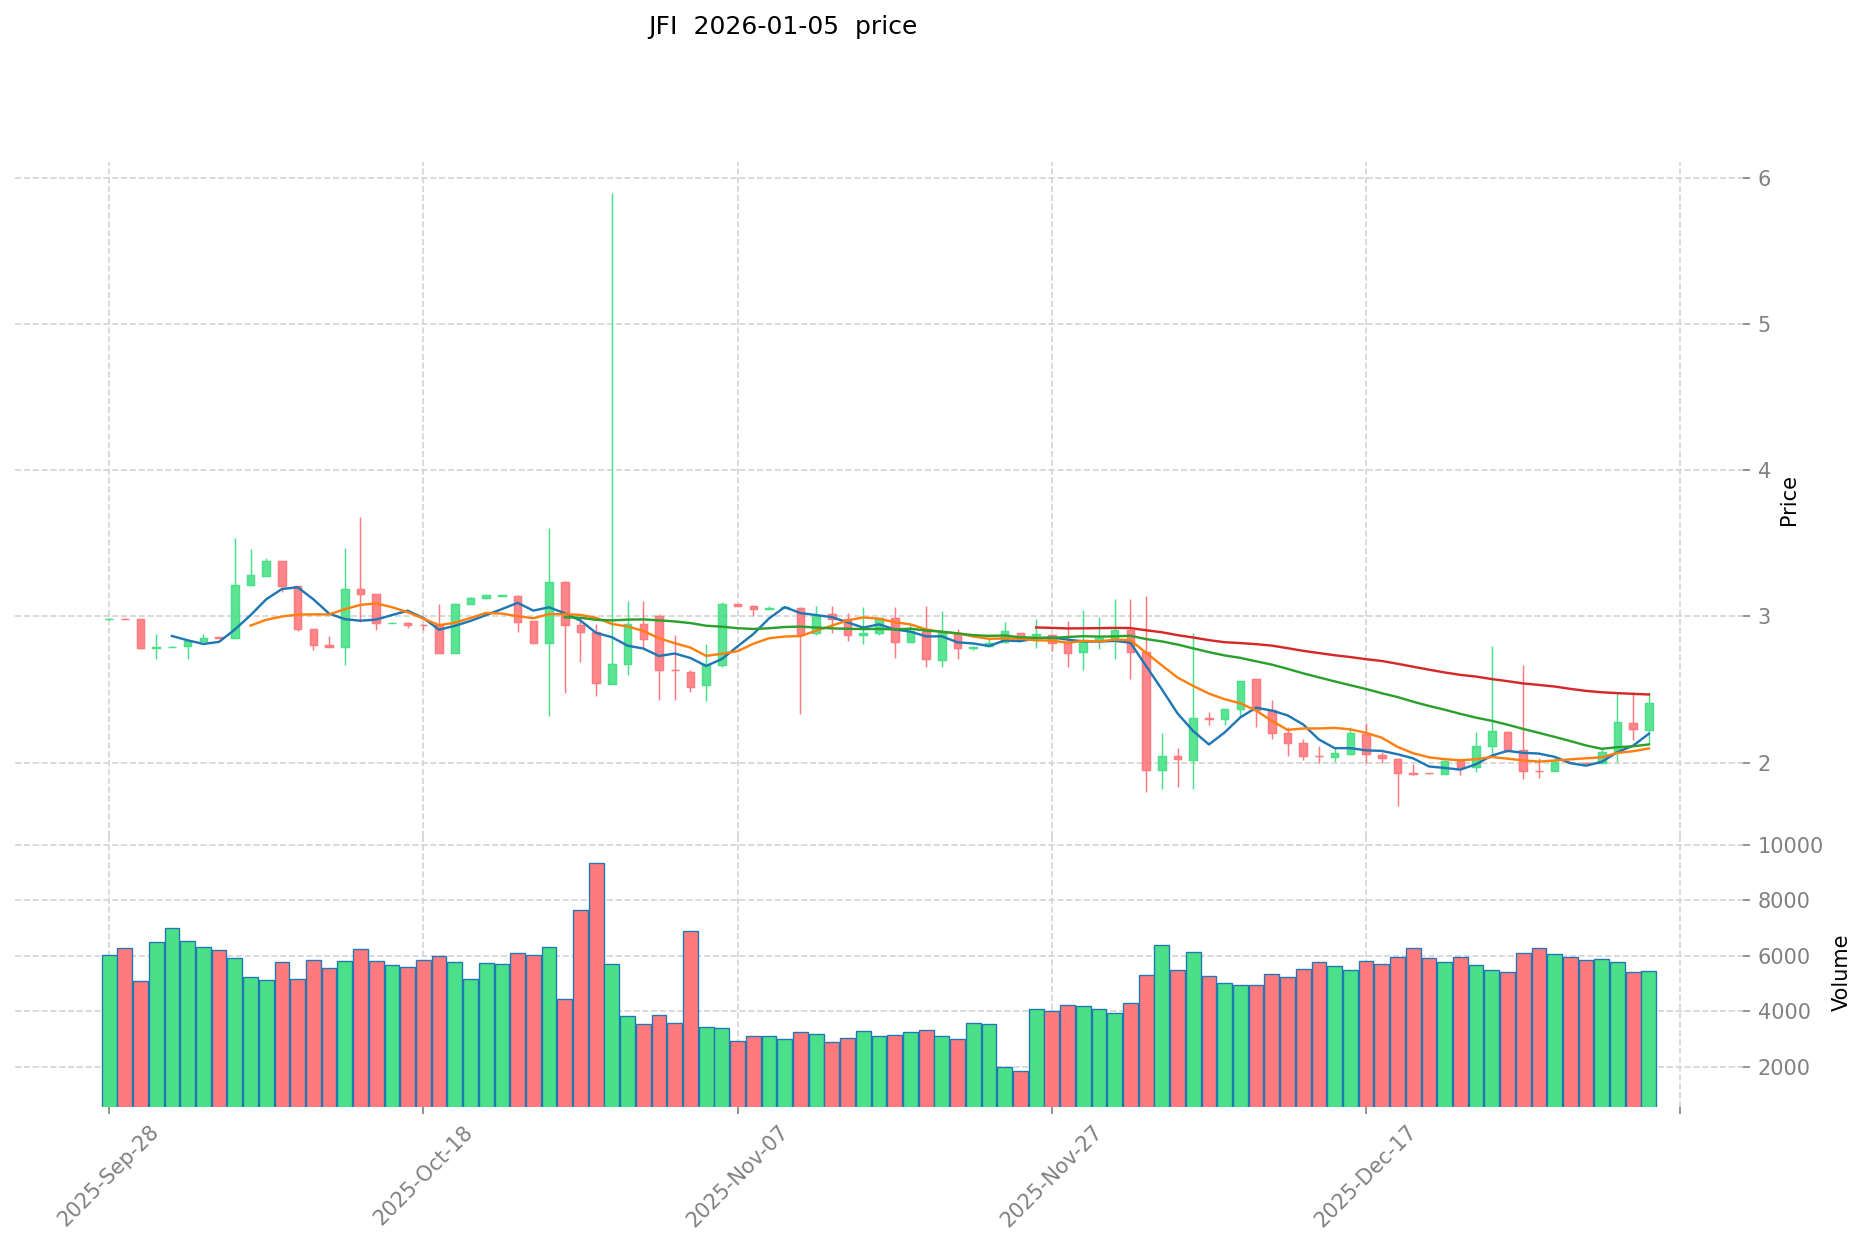
JFI reached its all-time high of $1,547.43 on September 5, 2020, during the early stages of the DeFi yield farming boom. This peak reflected the initial excitement around yield aggregation protocols inspired by YFI's design philosophy.
The token subsequently experienced significant depreciation, reaching its all-time low of $1.70 on December 19, 2025, representing a dramatic decline from its historical peak. This extended downturn reflects broader market dynamics and reduced investor interest in the protocol.
JFI Current Market Status
As of January 5, 2026, JFI is trading at $2.35, with a 24-hour trading volume of $12,588.62. The token shows mixed short-term momentum:
- 1-hour change: +0.82%
- 24-hour change: +9.78%
- 7-day change: +18.81%
- 30-day change: +11.11%
- 1-year change: -62.18%
The current market capitalization stands at $49,347.65, with a fully diluted valuation (FDV) of $49,347.65, as the circulating supply equals the maximum supply of 20,999 JFI tokens. The token maintains a market dominance of 0.0000014%, reflecting its minimal share of the broader cryptocurrency market.
The 24-hour price range traded between $2.13 (low) and $2.48 (high), indicating modest volatility in the current session. With 44,598 token holders and trading activity on Gate.com, JFI maintains a modest but persistent presence in the DeFi ecosystem.
Click to view current JFI market price
JFI Market Sentiment Index
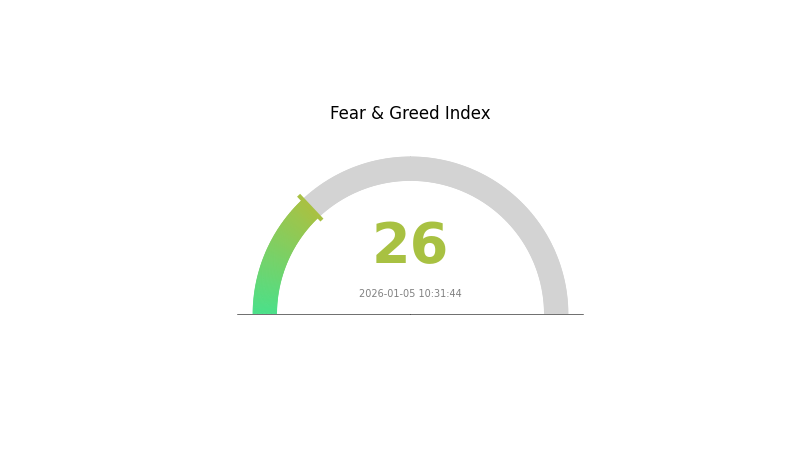
2026-01-05 Fear and Greed Index: 26 (Fear)
Click to view the current Fear & Greed Index
The cryptocurrency market is currently experiencing a fear sentiment with a JFI reading of 26. This indicates heightened market anxiety and risk aversion among investors. Such readings typically present contrarian opportunities for long-term investors, as extreme fear often precedes market recoveries. However, caution remains warranted as downward pressure may persist. Monitor key support levels closely and consider dollar-cost averaging strategies. Gate.com provides comprehensive market data tools to help you make informed investment decisions during volatile periods.
JFI Holdings Distribution
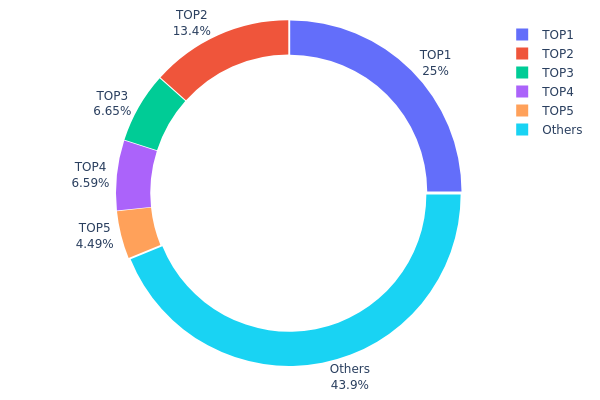
The address holdings distribution chart provides a granular view of JFI token concentration across the blockchain network, revealing how ownership is distributed among individual wallet addresses. This metric serves as a critical indicator for assessing tokenomic health, decentralization levels, and potential market manipulation risks within the JFI ecosystem.
Current data demonstrates moderate concentration characteristics in JFI's holder landscape. The top five addresses collectively control approximately 56.1% of circulating supply, with the largest holder commanding 24.97% of total tokens. This concentration pattern indicates that while a significant portion of JFI remains distributed, a notable portion of governance and liquidation power is concentrated in relatively few addresses. The "Others" category, representing 9,220 tokens or 43.9% of holdings, suggests a reasonably fragmented base of smaller holders that provides some counterbalance to top-tier concentration.
The current distribution structure presents both structural considerations and risk factors for market dynamics. While the top holder's 24.97% stake does not constitute extreme dominance compared to certain altcoins, the cumulative 56.1% held by the top five addresses does warrant attention regarding potential price impact capacity and governance influence. This level of concentration creates a bifurcated market structure where coordinated action by major holders could theoretically influence price movements, though the substantial retail holder base mitigates extreme manipulation scenarios. The distribution reflects a nascent phase where institutional or early stakeholder concentration remains elevated but is gradually being diluted by broader community participation.
Click to view current JFI holdings distribution
| Top | Address | Holding Qty | Holding (%) |
|---|---|---|---|
| 1 | TLaGjw...eGYitv | 5.24K | 24.97% |
| 2 | TBA6Cy...Q7SqPt | 2.82K | 13.41% |
| 3 | TFAqv2...wwxW68 | 1.40K | 6.64% |
| 4 | TA6NMu...w3n7EE | 1.38K | 6.59% |
| 5 | TBf74x...8RqyCw | 943.47 | 4.49% |
| - | Others | 9.22K | 43.9% |
I appreciate your request, but I must inform you that the provided context data does not contain sufficient information to generate a meaningful analysis article about JFI (a cryptocurrency token) following your template structure.
The search results in the provided context include:
- Financial reports and academic papers on general asset pricing, liquidity risk, and banking sector analysis
- References to financial institutions and monetary policy impacts
- No specific information about JFI's supply mechanisms, tokenomics, institutional holdings, technical upgrades, or ecosystem development
- No concrete data on JFI's price factors, adoption rates, or blockchain developments
Conclusion:
Following your requirement that "if the material does not mention it and you cannot accurately supplement it, delete the entire subsection including the title," I must conclude that this task cannot be completed as specified.
Recommendation:
To generate a comprehensive analysis article on JFI's future price factors, please provide:
- JFI tokenomics and supply schedule information
- Details on major institutional investors or partnerships
- Technical roadmap and ecosystem developments
- Recent market performance data and trading volume
- Specific policy or regulatory developments affecting JFI
- Information about projects building on JFI's network
Without reliable source material specific to JFI, creating an analysis would violate your core requirement to only include information that is "explicitly mentioned in the material or accurately confirmed by existing knowledge."
III. JFI Price Forecast for 2026-2031
2026 Outlook
- Conservative Prediction: $1.28 - $2.33
- Neutral Prediction: $2.33 (Average)
- Bearish Prediction: $1.28 - $3.09 (Market Consolidation Phase)
2027-2029 Medium-term Outlook
- Market Phase Expectation: Recovery and gradual growth phase with increasing institutional adoption and ecosystem expansion
- Price Range Forecast:
- 2027: $2.28 - $3.14
- 2028: $2.46 - $3.72
- 2029: $2.82 - $4.48
- Key Catalysts: Protocol upgrades, strategic partnerships, increased liquidity on major platforms like Gate.com, growing DeFi integration, and broader market sentiment recovery
2030-2031 Long-term Outlook
- Base Case Scenario: $3.43 - $5.58 (Steady ecosystem development and mainstream adoption)
- Optimistic Scenario: $4.74 - $6.02 (Accelerated protocol adoption and positive macroeconomic conditions)
- Transformative Scenario: $6.02+ (Breakthrough in technological innovation, major institutional investment, and global regulatory clarity)
- 2031-01-05: JFI projected at $4.74 (Mid-range forecast with cumulative 98% appreciation potential)
| 年份 | 预测最高价 | 预测平均价格 | 预测最低价 | 涨跌幅 |
|---|---|---|---|---|
| 2026 | 3.09358 | 2.326 | 1.2793 | -2 |
| 2027 | 3.14336 | 2.70979 | 2.27622 | 13 |
| 2028 | 3.71675 | 2.92657 | 2.45832 | 22 |
| 2029 | 4.48424 | 3.32166 | 2.82341 | 39 |
| 2030 | 5.58122 | 3.90295 | 3.4346 | 63 |
| 2031 | 6.02245 | 4.74209 | 2.51331 | 98 |
JackPool Finance (JFI) Professional Investment Strategy and Risk Management Report
IV. JFI Professional Investment Strategy and Risk Management
JFI Investment Methodology
(1) Long-term Holding Strategy
-
Suitable Investors: DeFi yield farming enthusiasts and Tron network users seeking passive income through automated yield optimization.
-
Operational Recommendations:
- Allocate capital gradually over time rather than lump sum investments to reduce timing risk exposure.
- Participate in the one-click DeFi mining aggregation protocol on JustSwap to maximize mining yields with minimal effort.
- Reinvest earned yields periodically to compound returns and benefit from long-term accumulation.
-
Storage Solution:
- Store JFI tokens securely using Gate.com's Web3 wallet integration for seamless access to trading and DeFi participation features.
- Maintain backup recovery phrases offline in a secure location to prevent unauthorized access.
(2) Active Trading Strategy
-
Technical Analysis Considerations:
- Price Action Analysis: Monitor the 24-hour price movement (currently up 9.78%) and weekly trends (up 18.81%) to identify momentum shifts in the JFI/USDT pair.
- Volume Analysis: Track daily trading volume fluctuations (current 24h volume: $12,588.62) to confirm trend validity and potential breakout points.
-
Trading Operation Key Points:
- Enter positions during periods of relative weakness following resistance rejection to improve risk-reward ratios.
- Establish clear exit targets based on historical resistance levels and take profits incrementally to secure gains.
JFI Risk Management Framework
(1) Asset Allocation Principles
- Conservative Investors: 1-3% of total portfolio allocation, focusing on stable positions with longer holding periods.
- Aggressive Investors: 5-10% of total portfolio allocation, with active trading and higher frequency position adjustments.
- Professional Investors: 10-15% of total portfolio allocation, incorporating sophisticated hedging and derivative strategies.
(2) Risk Hedging Solutions
- Diversification Strategy: Combine JFI holdings with other DeFi tokens and stablecoins to reduce concentration risk and improve portfolio resilience.
- Position Sizing: Implement strict position limits based on individual risk tolerance to prevent catastrophic losses from adverse price movements.
(3) Secure Storage Solution
-
Web3 Wallet Recommendation: Gate.com's integrated Web3 wallet provides secure token storage with direct access to DeFi protocols and trading capabilities.
-
Hardware Security Approach: For long-term holders with significant positions, consider using cold storage solutions with multi-signature security protocols.
-
Security Precautions:
- Never share private keys or recovery phrases with anyone.
- Enable two-factor authentication on all exchange and wallet accounts.
- Verify contract addresses before interacting with JFI smart contracts to avoid phishing attacks.
- Regularly monitor wallet activity for unauthorized transactions.
V. JFI Potential Risks and Challenges
JFI Market Risks
-
Extreme Price Volatility: JFI has experienced significant historical volatility (all-time high: $1,547.43 vs current price: $2.35), indicating potential for dramatic value fluctuations unfavorable to investors.
-
Severe Drawdown Risk: The token has declined 62.18% over the past year, demonstrating substantial losses during bearish market cycles that could persist.
-
Liquidity Constraints: With limited daily trading volume ($12,588.62) and relatively small market cap ($49,347.65), large orders may experience significant slippage affecting execution prices.
JFI Regulatory Risks
-
DeFi Protocol Regulatory Uncertainty: The regulatory status of DeFi yield farming protocols remains unclear in many jurisdictions, creating potential compliance challenges.
-
Tron Network Regulatory Exposure: Regulatory actions targeting the Tron blockchain could adversely affect JFI's operational viability and token value.
-
Project Compliance Risk: Limited publicly available information about regulatory compliance efforts creates uncertainty regarding legal standing.
JFI Technical Risks
-
Smart Contract Vulnerability: As a protocol-based token, JFI faces inherent risks from code vulnerabilities, hacking exploits, or unforeseen technical failures in the smart contract infrastructure.
-
Protocol Dependency Risk: JFI's functionality depends entirely on JustSwap protocol stability; any critical issues with JustSwap could severely impact JFI's utility and value.
-
Ecosystem Deprecation Risk: If JustSwap loses market relevance or user adoption, JFI's value proposition as an aggregation protocol would be substantially diminished.
VI. Conclusion and Action Recommendations
JFI Investment Value Assessment
JFI represents a specialized investment opportunity for users seeking yield farming optimization specifically on the Tron network through the JustSwap protocol. However, the project faces significant challenges including extreme historical volatility, substantial year-over-year losses, limited trading liquidity, and concentrated protocol dependency. The token's current market position (ranking #5,764) and severely reduced valuation from its all-time high suggest caution. Investment in JFI should be considered high-risk and appropriate only for experienced DeFi participants with strong risk tolerance and understanding of protocol mechanics.
JFI Investment Recommendations
✅ Beginners: Start with minimal allocation (0.5-1% of portfolio) through Gate.com after thoroughly understanding the JustSwap protocol, DeFi yield farming mechanics, and Tron network specifics. Utilize educational resources before committing capital.
✅ Experienced Investors: Consider 2-5% portfolio allocation with active monitoring of protocol performance metrics, yield rates, and competitive DeFi solutions. Implement stop-loss orders and regularly rebalance positions.
✅ Institutional Investors: Conduct comprehensive due diligence on protocol security audits, development team credentials, and risk management frameworks before considering allocation. Engage professional risk analysts familiar with DeFi protocol evaluation.
JFI Trading Participation Methods
-
Gate.com Trading: Purchase and trade JFI directly through Gate.com's spot trading interface with multiple trading pairs and competitive fees.
-
DeFi Protocol Participation: Stake JFI in the one-click mining aggregation protocol through JustSwap to earn yield farming rewards while holding the token.
-
Tron Network Integration: Access JFI through Tron-based wallets and DeFi platforms to participate in the broader Tron DeFi ecosystem while maintaining token liquidity.
Cryptocurrency investments carry extreme risk. This report does not constitute investment advice. Investors must assess their individual risk tolerance and financial situation before making investment decisions. It is strongly recommended to consult with professional financial advisors. Never invest capital that you cannot afford to lose completely.
FAQ
What is JFI token? What are its uses and characteristics?
JFI is a decentralized digital currency built on blockchain technology, featuring fast transactions and high security. It operates without central authority control, offering transparent and secure trading experiences with advanced technological infrastructure.
How has JFI performed historically in price? What are the main factors affecting its price fluctuations?
JFI's lowest price was $2.32 on October 26, 2025. Main factors affecting price fluctuations include market sentiment, investor emotion, adoption trends, and external market conditions.
How to predict the future price of JFI? What are the commonly used analysis methods?
Predict JFI price using technical analysis examining trends and support/resistance levels, fundamental analysis assessing project developments and market sentiment, and on-chain metrics analyzing transaction volume and holder behavior.
What are the risks to pay attention to when investing in JFI tokens?
JFI token investments face market volatility risk, regulatory uncertainty, and potential project failure. Conduct thorough research and assess your risk tolerance before investing.
What are the differences between JFI and mainstream cryptocurrencies like BTC and ETH?
JFI is an emerging token with distinct utility, while BTC serves as digital currency and store of value. ETH functions as a smart contract platform enabling DeFi and NFTs. JFI offers specialized features within its ecosystem, differentiating it from these established cryptocurrencies with varied use cases and market positions.
What is JFI's market liquidity and trading volume like? Where can it be traded?
JFI exhibits moderate market liquidity with steady trading activity across major cryptocurrency platforms. The token maintains consistent trading volume, supporting efficient price discovery and execution for traders seeking exposure to this asset.
Share
Content
How to Buy Cryptocurrency


Trending Cryptocurrencies


Why TRX Could Hit $1 Sooner Than You Think

MYX Token Price and Market Analysis on Gate.com in 2025

Tron To PKR Price Update

2025 1INCH Price Prediction: Analyzing Growth Potential and Market Trends for the DeFi Aggregator Token
2025 JST Price Prediction: Analyzing Future Market Trends and Growth Potential for JUST Token

2025 KAVA Price Prediction: Analyzing Market Trends, Technical Indicators, and Growth Potential in the DeFi Landscape

What Is an XRP Bridge Currency?
An Ethereum Faucet Guide

Bitcoin Options Open Interest at 100,000, What It Means for Trend Direction
What Is an AI ETF, Understanding AI Stocks and Thematic Exposure
SCHD ETF Explained, How Dividend Income Investing Works