2025 OL Price Prediction: Expert Analysis and Market Forecast for the Coming Year
Introduction: Market Position and Investment Value of OL
Open Loot (OL) is a Web3 gaming distribution platform and marketplace designed to support game developers and publishers with go-to-market strategies, distribution, user experience, and payment solutions. Since its launch in November 2024, the project has established itself as a specialized infrastructure provider within the gaming sector. As of December 24, 2025, OL has achieved a market capitalization of approximately $77.8 million USD with a circulating supply of 201,373,461 tokens, currently trading at $0.01556 per token. This innovative asset is playing an increasingly significant role in reshaping Web3 gaming ecosystems and developer support infrastructure.
This article will comprehensively analyze OL's price trends from 2025 through 2030, integrating historical price patterns, market supply-demand dynamics, ecosystem development, and macroeconomic factors to provide investors with professional price forecasts and actionable investment strategies.
Open Loot (OL) Market Analysis Report
I. OL Price History Review and Current Market Status
OL Historical Price Evolution Trajectory
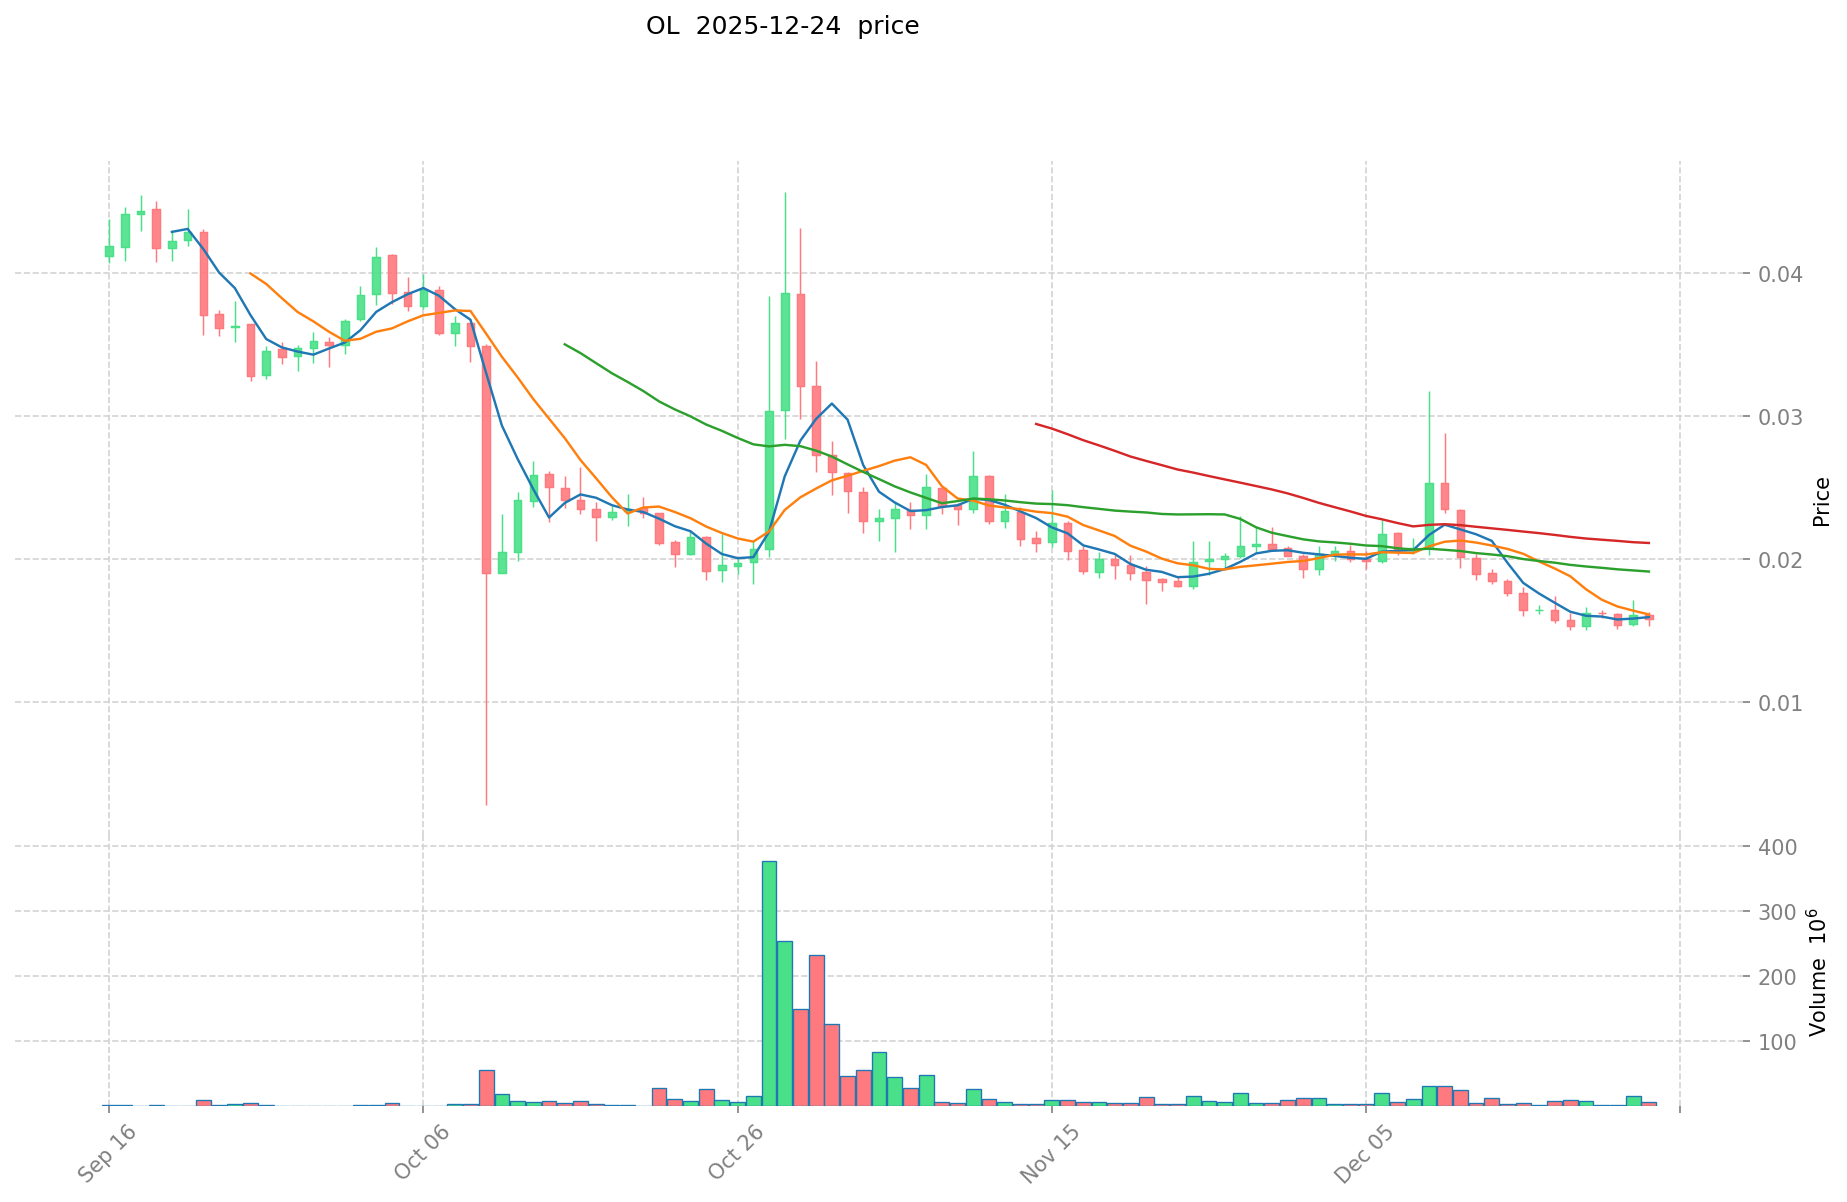
Open Loot (OL) was launched on November 18, 2024, with an initial publish price of $0.01. The token experienced significant price appreciation in its early trading period, reaching its all-time high (ATH) of $0.69 on December 5, 2024, representing a remarkable 6,800% gain from its launch price within approximately three weeks. However, the token subsequently experienced a sharp correction, declining to its all-time low (ATL) of $0.00274 on October 10, 2025, marking a devastating 99.6% decline from its peak valuation.
OL Current Market Status
As of December 24, 2025, OL is trading at $0.01556, reflecting a 24-hour price change of -0.38%. The token maintains a market capitalization of $3,133,371 USD with a fully diluted valuation of $77,800,000 USD. The circulating supply stands at 201,373,461 tokens out of a maximum total supply of 5,000,000,000 tokens, representing a circulation ratio of approximately 4.03%.
Over the past seven days, OL has declined by 5.81%, and the 30-day performance shows a descent of 14.41%. The year-to-date decline is particularly severe at 93.33%, indicating sustained downward pressure since the token's peak in December 2024. The current 24-hour trading volume is $65,646.38 USD, demonstrating relatively modest trading activity.
OL maintains a market rank of 1,836 among all cryptocurrencies, with a market dominance of 0.0024%. The token is listed on 15 exchanges and has accumulated 2,361 token holders. The current market sentiment reflects extreme fear, with a market emotion index reading of 1 on the fear and greed scale.
Click to view the current OL market price
OL Market Sentiment Index
2025-12-24 Fear and Greed Index: 24 (Extreme Fear)
Click to view the current Fear & Greed Index
The crypto market is currently experiencing extreme fear with an index reading of 24. This indicates severe market pessimism and risk aversion among investors. During periods of extreme fear, asset prices often reach attractive levels for long-term investors. However, heightened volatility and downside risks remain. Market participants should exercise caution while considering their investment strategies. Monitor key support levels and maintain proper risk management. Such sentiment extremes have historically presented both significant challenges and opportunities for informed traders.

OL Holdings Distribution
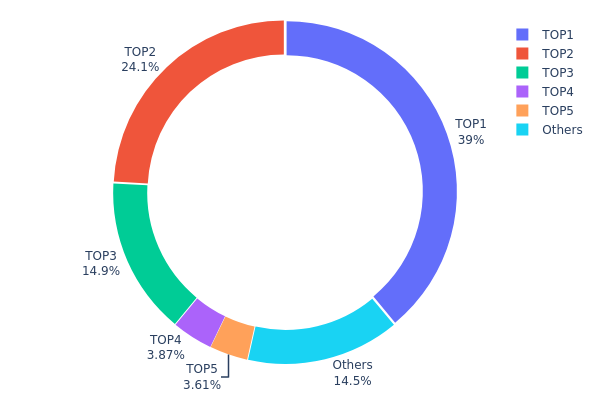
The address holdings distribution chart illustrates the concentration of OL tokens across different wallet addresses on-chain, providing critical insights into token ownership structure and potential market risks. By analyzing the top holders and their respective percentages of total supply, we can assess the degree of centralization and the vulnerability of the token to potential market manipulation or large-scale liquidations.
Current data reveals a moderate concentration pattern with certain centralization concerns. The top three addresses collectively control approximately 77.99% of the total token supply, with the largest holder (0xf3a5...5a2860) commanding 39.00% of all OL tokens. This substantial concentration among a limited number of addresses suggests that the token's price stability and market dynamics remain susceptible to decisions made by these major stakeholders. The fourth and fifth largest holders contribute an additional 7.47%, while the remaining addresses account for only 14.54% of the circulating supply.
This distribution pattern indicates a relatively centralized token structure that warrants careful monitoring. The dominance of the top three addresses creates potential systemic risks, as coordinated movements or large-scale transfers from these wallets could trigger significant price volatility. However, the absence of a single address exceeding 40% and the existence of a diversified base of smaller holders (14.54% collectively) provide some degree of resilience. The current on-chain structure suggests that while OL demonstrates improved decentralization compared to more extreme concentration scenarios, achieving greater token distribution among community participants would strengthen market stability and long-term sustainability.
Visit OL Holdings Distribution on Gate.com for real-time data
| Top | Address | Holding Qty | Holding (%) |
|---|---|---|---|
| 1 | 0xf3a5...5a2860 | 1950000.00K | 39.00% |
| 2 | 0xdfee...533e69 | 1207142.86K | 24.14% |
| 3 | 0x6cff...456e3d | 742857.14K | 14.85% |
| 4 | 0x4695...fd7d37 | 193474.03K | 3.86% |
| 5 | 0x3f16...9844c1 | 180593.43K | 3.61% |
| - | Others | 725932.54K | 14.54% |
II. Core Factors Affecting OL's Future Price
Supply Mechanism
- Halving Mechanism: The OL network undergoes periodic halving events every four years, during which block rewards are reduced by 50%.
- Historical Performance: Historical halving events have typically driven price increases due to reduced inflation following each halving.
- Current Impact: As the supply growth rate decreases through the halving mechanism, scarcity increases, which may support upward price pressure in the current market cycle.
Macroeconomic Environment
- Monetary Policy Impact: Central bank interest rate adjustments and quantitative easing measures significantly influence OL's investment attractiveness. Changes in monetary policy directly affect alternative asset valuations and investor risk appetite.
- Inflation Hedge Properties: During periods of economic uncertainty, OL demonstrates potential as an inflation hedge tool, offering portfolio diversification benefits as traditional assets face inflationary pressures.
- Geopolitical Factors: Rising global political and economic risks may drive increased adoption of alternative assets like OL as investors seek to mitigate exposure to traditional financial system risks.
III. OL Price Forecast for 2025-2030
2025 Outlook
- Conservative Forecast: $0.01072 - $0.01553
- Base Case Forecast: $0.01553
- Optimistic Forecast: $0.02283 (requiring sustained market momentum and positive ecosystem developments)
2026-2028 Mid-term Outlook
- Market Stage Expectation: Gradual accumulation phase with emerging growth catalysts, characterized by increasing adoption and improving market sentiment
- Price Range Predictions:
- 2026: $0.01362 - $0.02397 (23% potential upside)
- 2027: $0.01942 - $0.02697 (38% potential upside)
- 2028: $0.01287 - $0.02840 (56% potential upside)
- Key Catalysts: Expansion of use case applications, ecosystem partnership announcements, improved market liquidity on platforms like Gate.com, and growing institutional interest in the asset class
2029-2030 Long-term Outlook
- Base Case Scenario: $0.02160 - $0.03450 (2029) and $0.02494 - $0.04350 (2030), assuming steady adoption rates and favorable regulatory environment
- Optimistic Scenario: $0.03450 - $0.04350 (2030), based on accelerated mainstream adoption and increased integration within the broader cryptocurrency ecosystem
- Transformative Scenario: $0.04350+ (2030), contingent upon breakthrough developments in technology implementation, major institutional adoption, and significant market expansion beyond current user base
Key Observation: The forecast trajectory indicates a compounding growth pattern, with cumulative gains reaching approximately 95% by 2030, reflecting confidence in long-term asset appreciation potential.
| 年份 | 预测最高价 | 预测平均价格 | 预测最低价 | 涨跌幅 |
|---|---|---|---|---|
| 2025 | 0.02283 | 0.01553 | 0.01072 | 0 |
| 2026 | 0.02397 | 0.01918 | 0.01362 | 23 |
| 2027 | 0.02697 | 0.02158 | 0.01942 | 38 |
| 2028 | 0.0284 | 0.02427 | 0.01287 | 56 |
| 2029 | 0.0345 | 0.02634 | 0.0216 | 69 |
| 2030 | 0.0435 | 0.03042 | 0.02494 | 95 |
Open Loot (OL) Investment Analysis Report
IV. OL Professional Investment Strategy and Risk Management
OL Investment Methodology
(1) Long-term Holding Strategy
- Target Investors: Believers in Web3 gaming ecosystem development, early-stage platform supporters
- Operational Recommendations:
- Accumulate during market downturns when OL experiences significant price corrections
- Establish dollar-cost averaging positions to reduce timing risk across market cycles
- Secure holdings in Gate Web3 Wallet for long-term asset management with enhanced security features
(2) Active Trading Strategy
- Technical Analysis Tools:
- Support and Resistance Levels: Identify key price zones at 0.01520 (24H low) and 0.01589 (24H high) for entry and exit signals
- Volume Analysis: Monitor the 24-hour trading volume of 65,646.38 units to confirm price breakouts and reversals
- Wave Trading Key Points:
- Execute short-term trades around the 1-hour positive momentum (0.13% gain) against longer-term downtrends
- Consider taking profits during temporary upswings given the 1-year decline of -93.33%
OL Risk Management Framework
(1) Asset Allocation Principles
- Conservative Investors: 1-3% of portfolio allocation
- Active Investors: 3-7% of portfolio allocation
- Professional Investors: 7-15% of portfolio allocation (with hedging instruments)
(2) Risk Hedging Approaches
- Position Sizing Strategy: Maintain strict position limits aligned with individual risk tolerance, especially given market volatility
- Profit-Taking Protocol: Establish predetermined exit points at 15-25% gains to lock in returns
(3) Secure Storage Solution
- Custody Recommendation: Use Gate Web3 Wallet for secure token storage with professional-grade security infrastructure
- Private Wallet Approach: Store private keys in isolated, encrypted environments with multi-signature backup procedures
- Security Considerations: Protect against smart contract vulnerabilities, monitor token contract address (0x1f57da732a77636d913c9a75d685b26cc85dcc3a on Ethereum), and verify all transactions on Etherscan before execution
V. OL Potential Risks and Challenges
OL Market Risk
- Severe Price Depreciation: OL has declined 93.33% over one year, indicating significant market skepticism about project viability
- Limited Liquidity: Trading volume of 65,646.38 units represents relatively modest liquidity, increasing slippage risk on larger positions
- Market Cap Concentration: With only 2,361 token holders and circulating supply representing only 4.03% of fully diluted valuation, the token faces substantial dilution risk upon future supply release
OL Regulatory Risk
- Web3 Gaming Classification Uncertainty: Evolving regulatory frameworks for gaming tokens and play-to-earn mechanisms remain ambiguous globally
- Jurisdictional Compliance: Different nations impose varying restrictions on gaming-related cryptocurrency projects, creating operational uncertainties
- Securities Classification: Regulators may reclassify OL as a security rather than utility token, imposing stricter compliance requirements
OL Technical Risk
- Smart Contract Vulnerability: ERC-20 token implementation may contain unforeseen security flaws or exploitation vectors
- Platform Dependency: Project relies on Ethereum network stability; network congestion or upgrades could impact token functionality
- Blockchain Integration: Potential technical challenges in integrating gaming applications with the broader Web3 ecosystem
VI. Conclusion and Action Recommendations
OL Investment Value Assessment
Open Loot operates as a Web3 gaming distribution platform addressing a growing sector. However, the token has experienced extreme price depreciation (-93.33% year-to-date), trading at 0.01556 with an all-time high of 0.69 achieved in December 2024. The project's fundamentals require careful evaluation against market sentiment indicators suggesting limited investor confidence. The fully diluted valuation of 77.8 million against minimal circulating supply presents significant future dilution risks. Investment consideration should depend heavily on belief in the Web3 gaming platform's long-term adoption potential and competitive positioning.
OL Investment Recommendations
✅ Beginners: Allocate only speculative capital (1-3% of portfolio) you can afford to lose entirely; conduct thorough due diligence on the Open Loot platform's competitive advantages before purchasing ✅ Experienced Investors: Consider strategic accumulation during extreme drawdowns; implement strict stop-loss orders at 25-30% below entry price; utilize Gate.com for direct OL trading with professional charting tools ✅ Institutional Investors: Conduct comprehensive legal and technical audits of the project; evaluate token economics and supply schedule; establish risk-adjusted position sizing with derivatives hedging strategies
OL Trading Participation Methods
- Direct Spot Trading: Purchase OL tokens directly on Gate.com using established pairs with major stablecoins
- Gate.com Platform Access: Leverage Gate.com's professional trading interface with real-time price monitoring and technical analysis tools
- Secure Asset Management: Utilize Gate Web3 Wallet integration for seamless deposit and withdrawal operations combined with enhanced custody security
Cryptocurrency investment carries extreme risk. This report does not constitute investment advice. Investors must make decisions based on personal risk tolerance and financial circumstances. Consult qualified financial advisors before committing capital. Never invest funds you cannot afford to lose completely.
FAQ
What is the oil price forecast for 5 years?
Oil prices over the next five years are projected to fluctuate between $60-$100 per barrel, driven by global demand recovery, supply dynamics, and geopolitical factors. Long-term trends remain uncertain due to renewable energy adoption and economic volatility.
What is the prediction for oil prices?
Oil prices are expected to rise gradually in 2025. Analysts predict a range of outcomes, with some anticipating prices around $48.04 initially, while long-term forecasts suggest steady upward movement. Market sentiment remains mixed with varied predictions.
What is the price prediction for OpenLoop?
Based on current market trends with a 5% annual growth rate, OpenLoop (OPL) is projected to reach approximately $0.000005 within 30 days. This forecast reflects anticipated market developments and historical performance patterns in the current trading environment.
Share
Content
Introduction: Market Position and Investment Value of OL
I. OL Price History Review and Current Market Status
II. Core Factors Affecting OL's Future Price
2025 Outlook
2026-2028 Mid-term Outlook
2029-2030 Long-term Outlook
IV. OL Professional Investment Strategy and Risk Management
V. OL Potential Risks and Challenges
VI. Conclusion and Action Recommendations
FAQ
How to Buy Cryptocurrency


Trending Cryptocurrencies


2025 ISLAND Price Prediction: Expert Analysis and Market Forecast for the Coming Year
2025 A2Z Price Prediction: Expert Forecast and Market Analysis for the Upcoming Year

2025 GOG Price Prediction: Expert Analysis and Market Forecast for the Upcoming Year

2025 MAVIA Price Prediction: Expert Analysis and Future Market Outlook for the Decentralized Gaming Token

2025 NVIR Price Prediction: Expert Analysis and Market Forecast for the Coming Year
2025 W3GG Price Prediction: Expert Analysis and Market Forecast for the Gaming Token's Future Growth Potential
What is OpenSea? Complete Guide to the Leading NFT Marketplace

Comprehensive Guide to Cryptocurrency Exchange Platforms for Beginners

GM: A Social Greeting in the Crypto Community

ADA Coin (Cardano) Là Gì? Đầu Tư Có Đáng Không? Cách Mua
What is PSY: A Comprehensive Guide to the Global Phenomenon and Cultural Impact of the South Korean Artist