2025 VAI Price Prediction: Expert Analysis and Market Forecast for the Year Ahead


Introduction: VAI's Market Position and Investment Value
Vaiot (VAI) is a digital currency combining artificial intelligence and blockchain technology to power intelligent virtual assistants (IVA) for consumers and enterprises. Since its inception in 2021, VAI has established itself as a utility token within the Vaiot ecosystem. As of December 2025, VAI maintains a market capitalization of approximately $3.19 million with a circulating supply of 394.6 million tokens, currently trading at $0.00798. This innovative asset, recognized as a bridge between AI and blockchain infrastructure, continues to play an increasingly important role in powering the Payback program and supporting the fundamental VAIBC technology operations.
This article will provide a comprehensive analysis of VAI's price dynamics from 2025 through 2030, integrating historical price patterns, market supply and demand factors, ecosystem development, and macroeconomic conditions to deliver professional price forecasts and actionable investment strategies for investors seeking exposure to AI-blockchain convergence projects.
Vaiot (VAI) Market Analysis Report
I. VAI Price History Review and Current Market Status
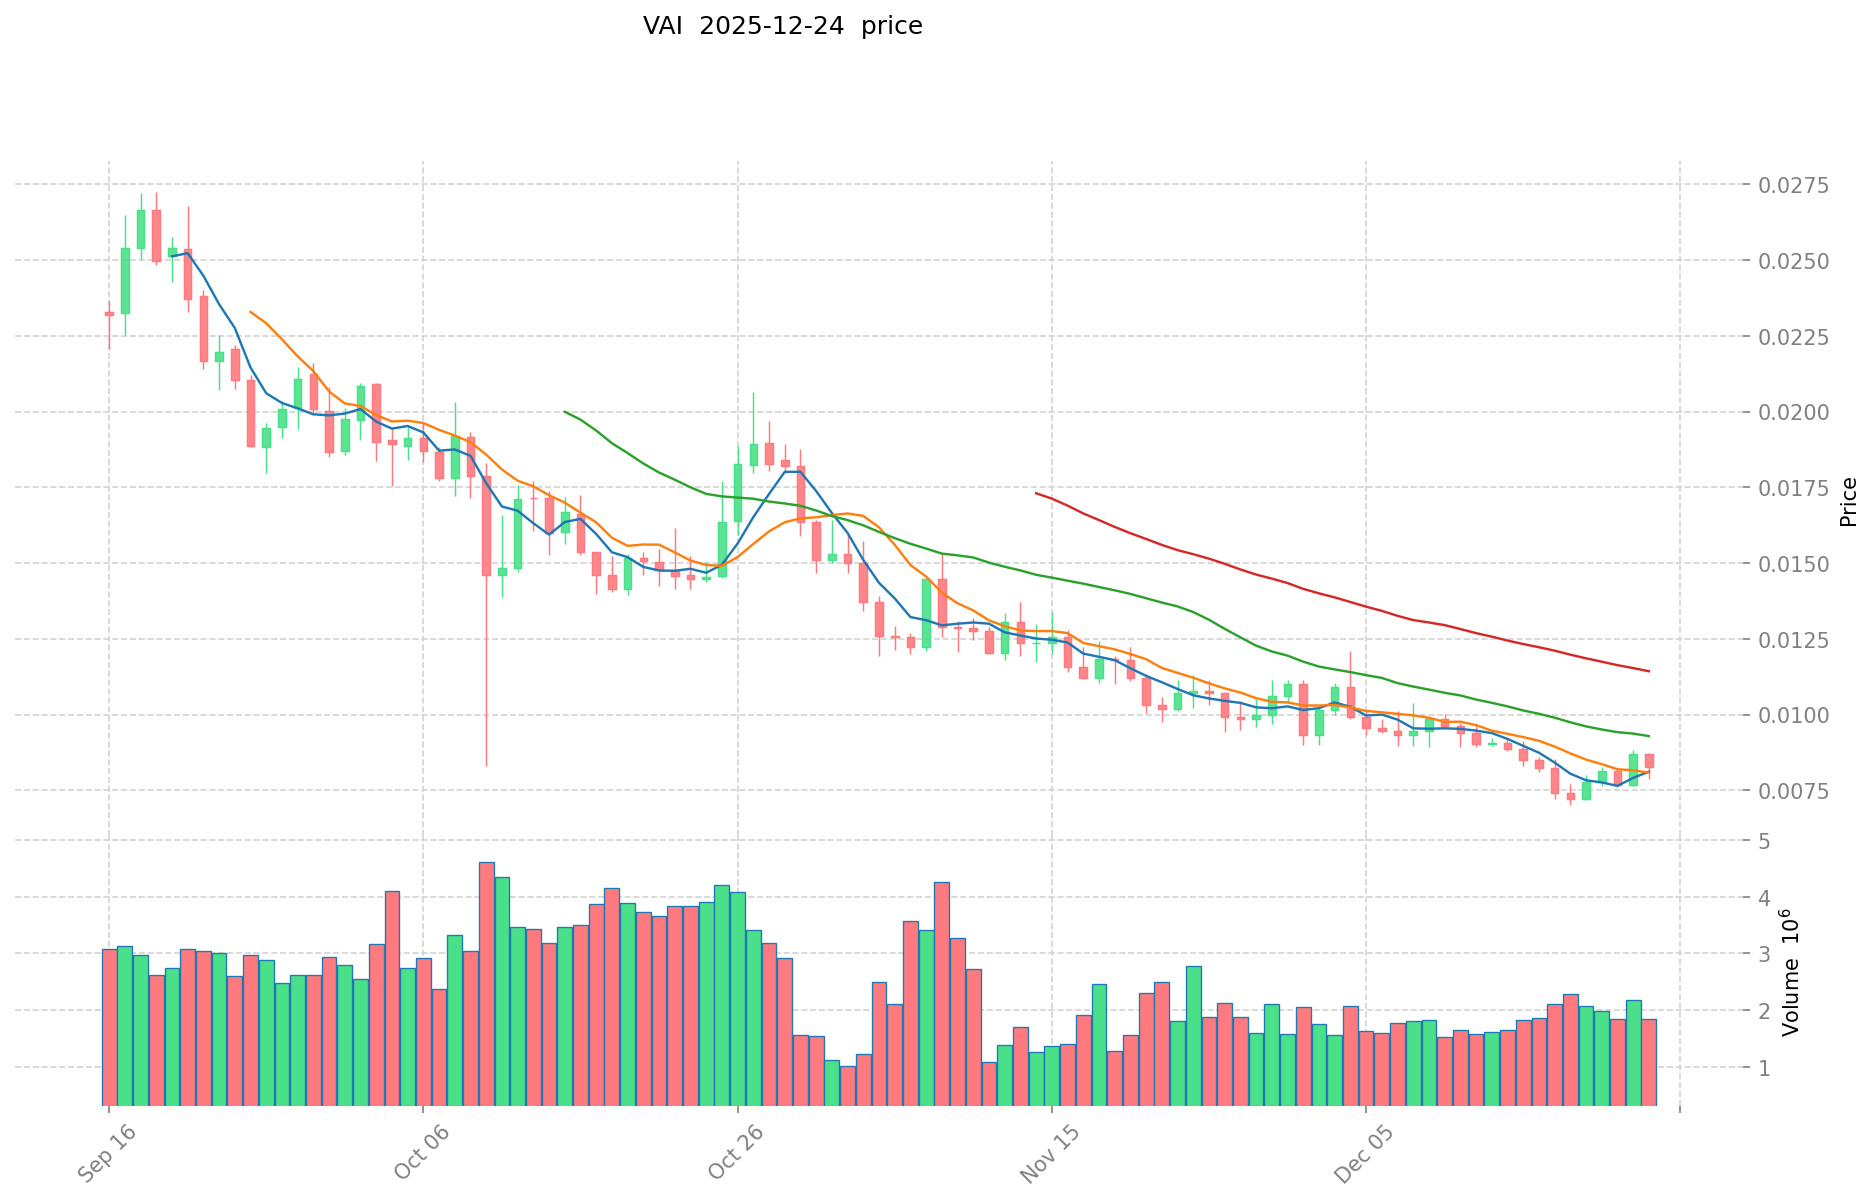
VAI Historical Price Evolution
-
April 2, 2021: VAI reached its all-time high of $3.60, marking the peak of its early market cycle following its launch on April 2, 2021 at an initial price of $3.495.
-
March 9, 2022: VAI declined to its all-time low of $0.00016773, representing a significant correction from its peak price during the subsequent market downturn.
-
December 24, 2025: VAI has experienced substantial long-term depreciation, declining approximately 90.02% over the past year.
VAI Current Market Status
As of December 24, 2025, VAI is trading at $0.00798 with a 24-hour trading volume of $15,521.39. The token has experienced a -5.11% decline over the past 24 hours, though it shows modest gains of 0.039% in the past hour and 1.92% over the past 7 days.
The current market capitalization stands at approximately $3,148,907.99, with a fully diluted valuation of $3,192,000. VAI maintains a circulating supply of 394,600,000 tokens out of a maximum supply of 400,000,000 tokens, representing a 98.65% circulation ratio with 15,439 token holders.
The short-term price range for the day is between $0.007884 and $0.00841. Over the 30-day period, VAI has declined -25.95%, reflecting sustained downward pressure on the token's valuation.
Click to view current VAI market price
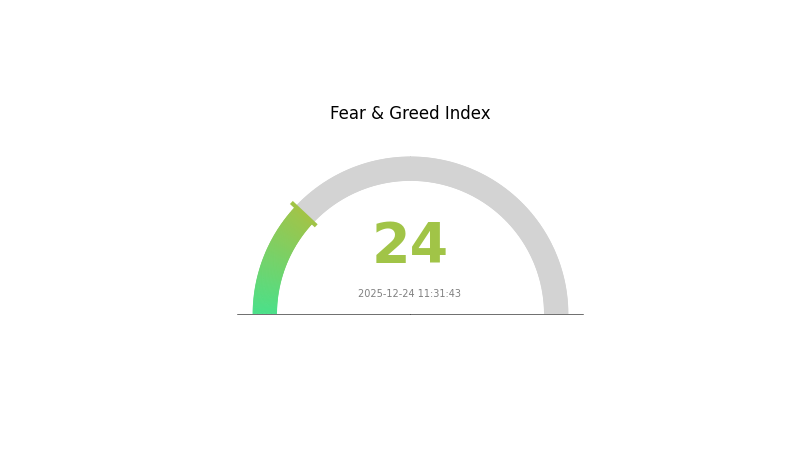
VAI Market Sentiment Indicator
2025-12-24 Fear and Greed Index: 24 (Extreme Fear)
Click to view current Fear & Greed Index
The cryptocurrency market is currently experiencing extreme fear, with the Fear and Greed Index dropping to 24. This indicates severe market pessimism and heightened risk aversion among investors. During such periods of extreme fear, market volatility typically intensifies, creating both significant risks and potential opportunities for contrarian traders. Long-term investors may view this as an accumulation opportunity, while short-term traders should exercise caution and implement proper risk management strategies. Market participants should closely monitor key support levels and macroeconomic indicators for signs of stabilization.
VAI Holdings Distribution
The address holdings distribution chart illustrates the concentration of VAI tokens across blockchain addresses, revealing the ownership structure and decentralization level of the asset. By analyzing the top token holders and their respective positions, this metric provides critical insights into potential market risks, including whale concentration and price manipulation susceptibility.
Current analysis of VAI's holdings reveals a moderate concentration pattern. The top five addresses collectively control approximately 45.4% of total token supply, with the largest holder commanding 22.45% alone. This level of concentration warrants attention, as it indicates meaningful accumulation among principal stakeholders. However, the remaining 54.6% distributed across other addresses demonstrates that no single entity has achieved absolute dominance. The second and third-largest holders maintain positions of 8.30% and 7.21% respectively, showing a relatively gradual decline in holdings size rather than extreme concentration disparities.
From a market structure perspective, this distribution pattern suggests moderate centralization risks. While the top holder's 22.45% position could theoretically exert significant influence over price movements through large liquidations or coordinated trades, the subsequent decline in holder sizes and the substantial portion held by smaller addresses provide some countervailing pressure against unilateral market manipulation. The current holders distribution reflects a typical profile for established blockchain assets, balancing between institutional/early stakeholder accumulation and broader community participation, thereby contributing to a moderately stable on-chain ecosystem structure.
Click to view current VAI Holdings Distribution

| Top | Address | Holding Qty | Holding (%) |
|---|---|---|---|
| 1 | 0x8dac...91ae18 | 89837.64K | 22.45% |
| 2 | 0x9642...2f5d4e | 33233.59K | 8.30% |
| 3 | 0x40ec...5bbbdf | 28865.61K | 7.21% |
| 4 | 0x446b...d027ba | 16065.75K | 4.01% |
| 5 | 0x58ed...a36a51 | 13731.53K | 3.43% |
| - | Others | 218265.88K | 54.6% |
II. Core Factors Affecting VAI's Future Price
Supply Mechanism
-
Dynamic Fee Structure: VAI operates through a mechanism combining a base fee that users consistently pay and a variable fee dependent on VAI's current price. This structure encourages users to mint or burn VAI during price fluctuations, promoting price stability.
-
Borrowing Demand Dynamics: The total supply of VAI is influenced by user borrowing demand on the Venus Protocol. As cryptocurrency values fluctuate in the market, users may choose to borrow and mint additional VAI to obtain more capital. This directly impacts the issuance volume of VAI tokens, creating a demand-driven supply mechanism.
-
Current Impact: Fluctuations in user borrowing activity on the Venus Protocol directly determine VAI's supply dynamics, making market sentiment and capital demand critical price drivers.
III. 2025-2030 VAI Price Forecast
2025 Outlook
- Conservative Prediction: $0.00689-$0.00792
- Neutral Prediction: $0.00792 (average price range)
- Bullish Prediction: $0.00974 (with sustained market momentum)
2026-2028 Medium-term Outlook
- Market Phase Expectation: Gradual recovery and consolidation phase with progressive appreciation
- Price Range Predictions:
- 2026: $0.00724-$0.01122 (10% upside potential)
- 2027: $0.00561-$0.01353 (25% appreciation expected)
- 2028: $0.00707-$0.01637 (47% growth trajectory)
- Key Catalysts: Ecosystem expansion, increased institutional adoption, improved market liquidity, and enhanced utility within the VAI protocol ecosystem
2029-2030 Long-term Outlook
- Base Case Scenario: $0.01295-$0.01618 (76% cumulative growth by 2029)
- Bullish Scenario: $0.01407-$0.01637 (sustained network development and market maturation)
- Transformational Scenario: $0.01513-$0.01604 (89% growth by 2030 with breakthrough ecosystem developments and mainstream adoption)
Note: These forecasts represent technical analysis based on historical patterns and market trends. Investors should conduct thorough due diligence and may consider monitoring VAI price movements on Gate.com for real-time market data and trading opportunities.
| 年份 | 预测最高价 | 预测平均价格 | 预测最低价 | 涨跌幅 |
|---|---|---|---|---|
| 2025 | 0.00974 | 0.00792 | 0.00689 | 0 |
| 2026 | 0.01122 | 0.00883 | 0.00724 | 10 |
| 2027 | 0.01353 | 0.01002 | 0.00561 | 25 |
| 2028 | 0.01637 | 0.01178 | 0.00707 | 47 |
| 2029 | 0.01618 | 0.01407 | 0.01295 | 76 |
| 2030 | 0.01604 | 0.01513 | 0.00983 | 89 |
VAI Token Investment Strategy and Risk Management Report
IV. VAI Professional Investment Strategy and Risk Management
VAI Investment Methodology
(1) Long-term Holding Strategy
-
Target Investors: Believers in AI-blockchain integration, long-term technology investors, and those seeking exposure to intelligent virtual assistant ecosystem development.
-
Operational Recommendations:
- Dollar-cost averaging (DCA) approach: Invest fixed amounts at regular intervals to reduce timing risk, given VAI's significant historical volatility (down 90.02% year-over-year).
- Focus on accumulation during market weakness: With VAI trading at $0.00798, significantly below its all-time high of $3.6 (April 2021), long-term believers may identify accumulation opportunities.
- Regular rebalancing: Periodically review portfolio allocation to maintain desired risk exposure.
-
Storage Solution:
- Secure self-custody through Gate Web3 wallet for direct token control and security.
- Implement multi-signature or hardware-backed security protocols for larger holdings.
- Maintain secure backups of private keys in geographically dispersed locations.
(2) Active Trading Strategy
-
Technical Analysis Tools:
- Price Action Analysis: Monitor the 24-hour trading range ($0.007884 - $0.00841) and identify breakout patterns.
- Volume Analysis: Track the 24-hour volume of 15,521.39 VAI tokens to identify liquidity conditions and potential reversal signals.
- Moving Averages: Use 7-day and 30-day moving average crossovers to identify trend direction.
-
Swing Trading Key Points:
- Entry Signals: Consider positions during periods of positive technical alignment, particularly when 1-hour momentum (currently +0.039%) sustains.
- Exit Strategy: Set profit targets based on resistance levels and cut losses if 7-day trends reverse below recent support.
- Risk-Reward Ratio: Maintain at least 1:2 ratio between stop-loss and profit target to ensure favorable expected value.
VAI Risk Management Framework
(1) Asset Allocation Principles
- Conservative Investors: 0.5% - 2% of portfolio maximum allocation to VAI, given its extreme volatility and speculative nature.
- Active Investors: 2% - 5% allocation, with clear stop-loss mechanisms and regular rebalancing protocols.
- Professional Investors: 5% - 10% allocation, with hedging strategies and sophisticated portfolio correlation analysis.
(2) Risk Hedging Solutions
- Position Sizing Hedge: Limit individual VAI position to predetermined percentage of total portfolio to contain downside exposure.
- Correlation Diversification: Balance VAI holdings with non-correlated assets to reduce systematic portfolio volatility and drawdown severity.
(3) Safe Storage Solutions
- Hot Wallet Approach: Gate Web3 wallet for active trading positions requiring frequent access, with withdrawal-only addresses for security.
- Cold Storage Method: Transfer long-term holdings to secure self-custody solutions with air-gapped key management.
- Security Considerations: Critical risks include private key compromise, exchange platform vulnerabilities, and smart contract bugs in token contracts (verified on ETH and MATIC chains).
V. Potential Risks and Challenges for VAI
VAI Market Risks
- Severe Price Volatility: VAI has experienced a 90.02% decline over the past year and a 25.95% decline over 30 days, indicating extreme market sensitivity and liquidity constraints with only $15,521.39 in daily volume.
- Extreme Market Cap Concentration: With a fully diluted market cap of only $3,192,000 and circulating supply of 394.6 million tokens, VAI exhibits characteristics of illiquid, thinly-traded assets vulnerable to price manipulation and sudden market shocks.
- Historical Drawdown from ATH: Current price of $0.00798 represents 99.78% decline from the April 2021 all-time high of $3.6, suggesting extended bear market conditions and potential loss of market confidence.
VAI Regulatory Risks
- Regulatory Uncertainty: AI and virtual assistant platforms may face evolving regulatory scrutiny regarding data privacy, consumer protection, and AI governance frameworks across multiple jurisdictions.
- Compliance Requirements: Changes in cryptocurrency regulations could impact VAI token utility, trading availability, and ecosystem operations.
- Jurisdictional Constraints: Different countries may impose varying restrictions on token trading, staking, or smart contract interactions affecting global user base.
VAI Technical Risks
- Smart Contract Vulnerabilities: VAI operates across ETH and MATIC chains; potential bugs or exploits in underlying contracts could result in token loss or platform disruption.
- Blockchain Integration Complexity: Combining AI with blockchain presents technical challenges in scalability, latency, and real-world performance of intelligent virtual assistants.
- Network Dependency: Platform functionality depends on continuous blockchain network operation; network congestion or upgrades could impact VAI ecosystem services.
VI. Conclusion and Action Recommendations
VAI Investment Value Assessment
VAI represents a highly speculative investment in the intersection of artificial intelligence and blockchain technology. The project aims to develop intelligent virtual assistants through the VAIBC platform, with VAI tokens serving as utility assets for the ecosystem. However, the token has experienced severe market contraction, declining 90.02% annually and trading near historical lows relative to launch price. The project faces significant challenges including limited trading liquidity ($15,521.39 daily volume), minimal market capitalization ($3.19 million), and extended downtrend pressures. Investors should approach VAI as a venture-stage, high-risk technology bet rather than a stable store of value or income-generating asset. Long-term value realization depends on successful execution of AI-blockchain integration roadmap and achievement of mainstream adoption of VAIOT's intelligent virtual assistant platform.
VAI Investment Recommendations
✅ For Beginners: Start with micro-allocations (0.1% - 0.5% of portfolio) through gate.com's trading platform only after comprehensive due diligence. Focus on understanding the AI-blockchain value proposition before increasing exposure. Avoid leverage or margin trading given extreme volatility.
✅ For Experienced Investors: Implement position-sizing strategies limiting exposure to 2% - 5% maximum. Utilize technical analysis to identify high-probability entry points during support formations. Establish strict stop-loss levels at 20% - 30% below entry to manage downside risk. Consider VAI as a satellite position rather than core holding.
✅ For Institutional Investors: Conduct in-depth fundamental analysis of VAIOT's technology roadmap, team credentials, and competitive positioning within AI-assisted services market. Implement advanced hedging strategies and correlation analysis. Negotiate OTC trading terms on gate.com for optimal execution and transparency.
VAI Trading Participation Methods
- Direct Spot Trading: Purchase VAI directly on gate.com using USD or stablecoin pairs; execute market orders during peak liquidity hours.
- Limit Order Strategy: Place limit orders at identified support levels to accumulate positions at predetermined prices, minimizing slippage on thin liquidity.
- Gate Web3 Wallet Integration: Transfer acquired VAI tokens to self-custody through Gate Web3 wallet for enhanced security and full asset control.
Cryptocurrency investments carry extreme risk of total loss. This report does not constitute investment advice. Investors must conduct independent research and consult qualified financial advisors before making investment decisions. Never invest capital exceeding your loss tolerance capacity. The volatility, limited liquidity, and speculative nature of VAI token presents elevated risk unsuitable for risk-averse investors.
FAQ
Could VeChain hit $1?
Yes, VeChain could potentially reach $1 by 2030 if enterprise adoption accelerates and the global carbon credits market migrates to its blockchain. This would require VET to increase approximately 35x from current levels, driven by institutional partnerships and ecosystem growth.
What will VeChain be worth in 2025?
VeChain (VET) is anticipated to trade between $0.01030 and $0.01056 in 2025, with an average annualized price of $0.01048.
Will VeChain hit $5?
VeChain hitting $5 is possible but requires sustained growth and market expansion. With strong enterprise partnerships and expanding use cases, this milestone could materialize in the long term through continued adoption and blockchain innovation.
Share
Content
Introduction: VAI's Market Position and Investment Value
I. VAI Price History Review and Current Market Status
II. Core Factors Affecting VAI's Future Price
III. 2025-2030 VAI Price Forecast
IV. VAI Professional Investment Strategy and Risk Management
V. Potential Risks and Challenges for VAI
VI. Conclusion and Action Recommendations
FAQ
How to Buy Cryptocurrency


Trending Cryptocurrencies


2025 HOLO Price Prediction: Analyzing Market Trends and Growth Potential in the Post-Halving Crypto Landscape

2025 COOKIE Price Prediction: Market Analysis and Future Outlook for Digital Cookie Economy

2025 SIREN Price Prediction: Future Outlook, Market Analysis, and Key Factors Driving This Emerging Crypto Asset
2025 AVAAIPrice Prediction: Analyzing Market Trends and Growth Potential for AVAAI in the Expanding AI Sector

2025 XNY Price Prediction: Analyzing Market Trends, Technical Indicators and Future Outlook for Cryptocurrency Investors
2025 ACTPrice Prediction: Analyzing Market Trends and Future Valuation of ACT Tokens in the Evolving Crypto Ecosystem

Is Web3 Dead?

Cách Đào Bitcoin Trên Điện Thoại Hiệu Quả Và Mẹo Tối Ưu Tốc Độ Đào
What is OpenSea? Complete Guide to the Leading NFT Marketplace

Comprehensive Guide to Cryptocurrency Exchange Platforms for Beginners

GM: A Social Greeting in the Crypto Community