XL1 vs GRT: A Comprehensive Comparison of Two Leading Blockchain Oracle Solutions

Introduction: XL1 vs GRT Investment Comparison
In the cryptocurrency market, the comparison between XL1 and GRT has become an unavoidable topic for investors. The two assets not only exhibit significant differences in market capitalization ranking, application scenarios, and price performance, but also represent distinct positioning within the crypto asset landscape.
XL1 (XL1): As the utility token of XYO Layer One, XL1 powers the first scalable data blockchain that brings verifiable information on-chain. It facilitates gas payments, transaction fees, smart contracts, decentralized applications, and validator rewards while enabling cross-chain bridging and staking mechanisms.
GRT (GRT): Since its launch in December 2020, The Graph has established itself as a decentralized protocol for indexing and querying blockchain data on Ethereum. It has become a critical infrastructure layer enabling efficient data access across the blockchain ecosystem.
This article will conduct a comprehensive analysis of XL1 vs GRT investment value comparison across historical price trends, supply mechanisms, ecosystem development, and market positioning, while attempting to address the question investors care about most:
"Which is the better buy right now?"
Comparative Analysis Report: XL1 vs The Graph (GRT)
I. Price History Comparison and Current Market Status
XL1 and The Graph (GRT) Historical Price Trends
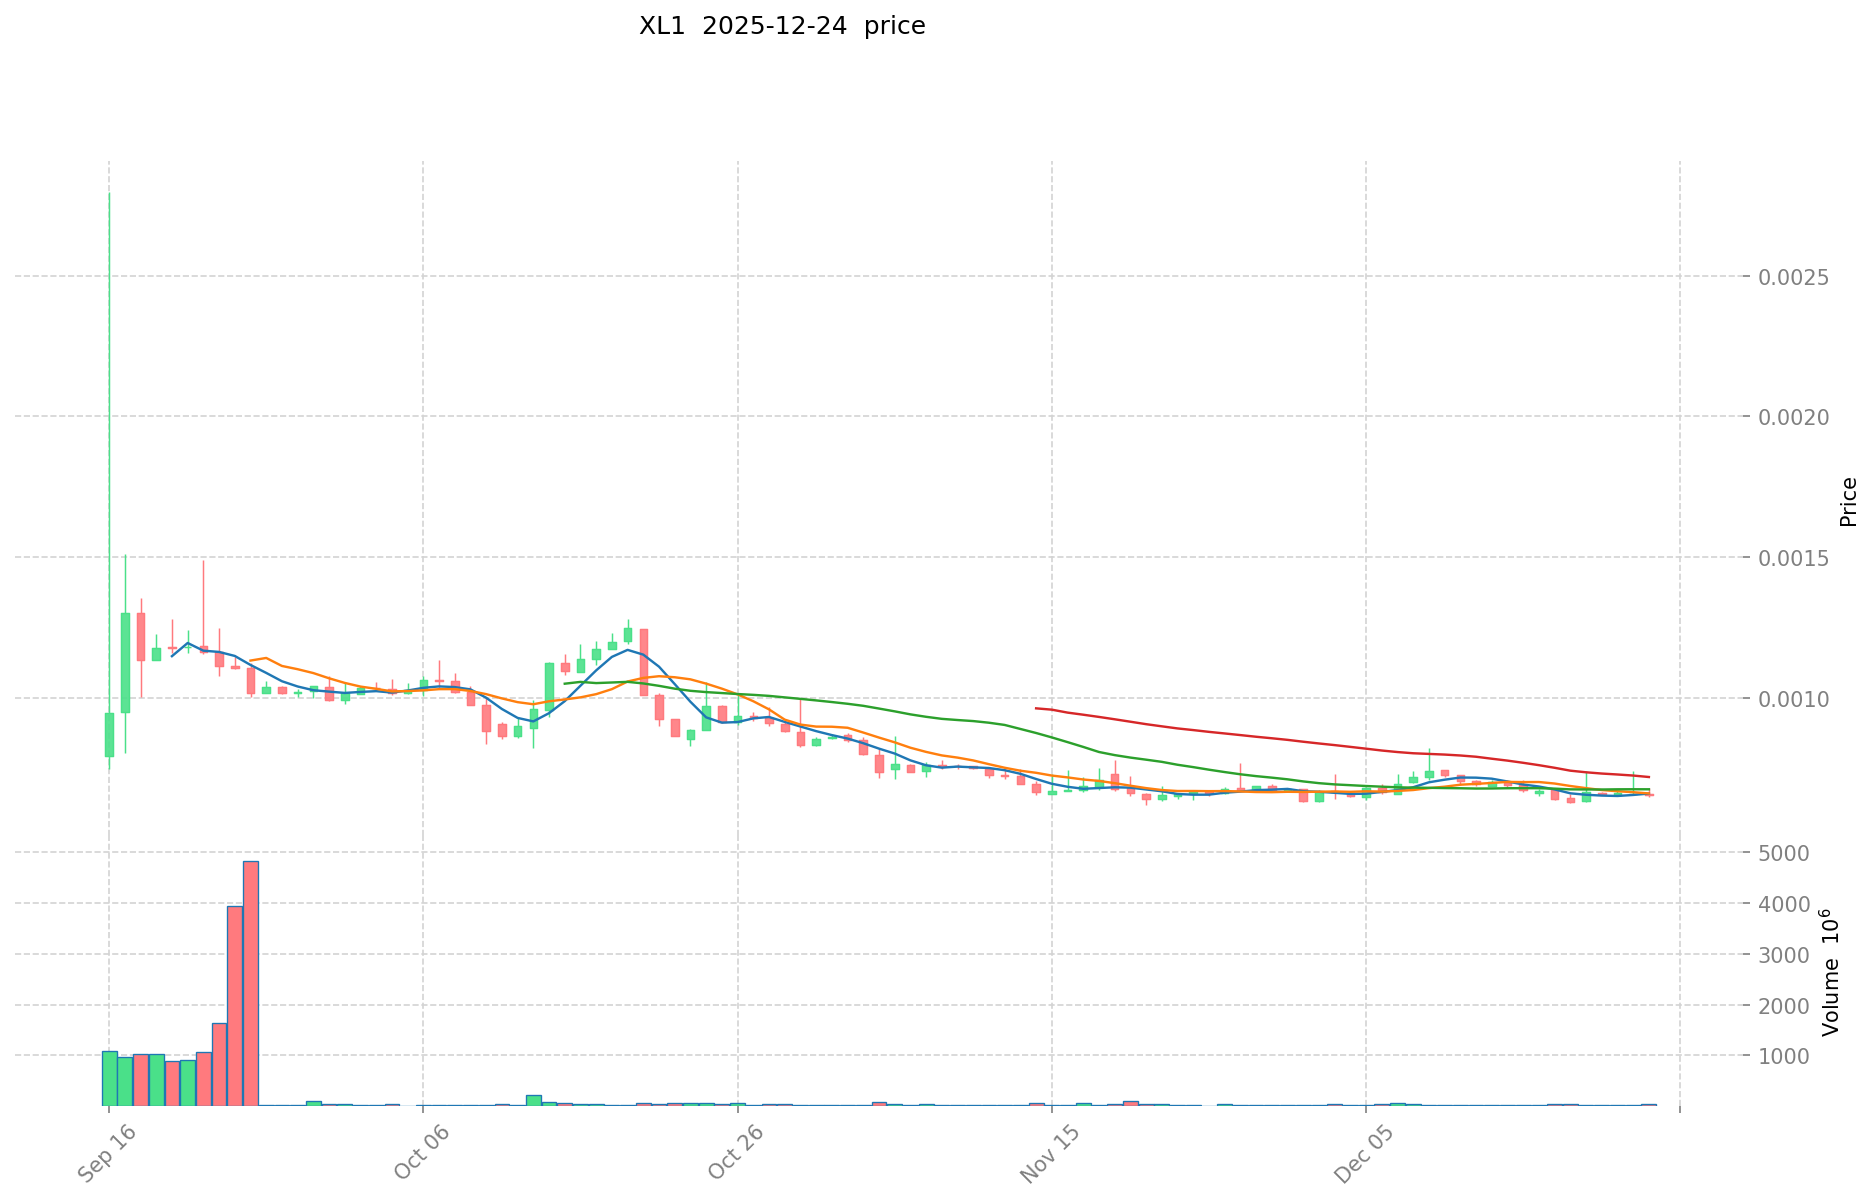
XL1 Performance:
- All-Time High (ATH): $0.0027985 (September 16, 2025)
- All-Time Low (ATL): $0.0006172 (November 21, 2025)
- Year-over-Year Change: -45.16%
- The token experienced a significant decline from its peak in mid-September to its recent lows in late November, representing a 77.95% drawdown from ATH.
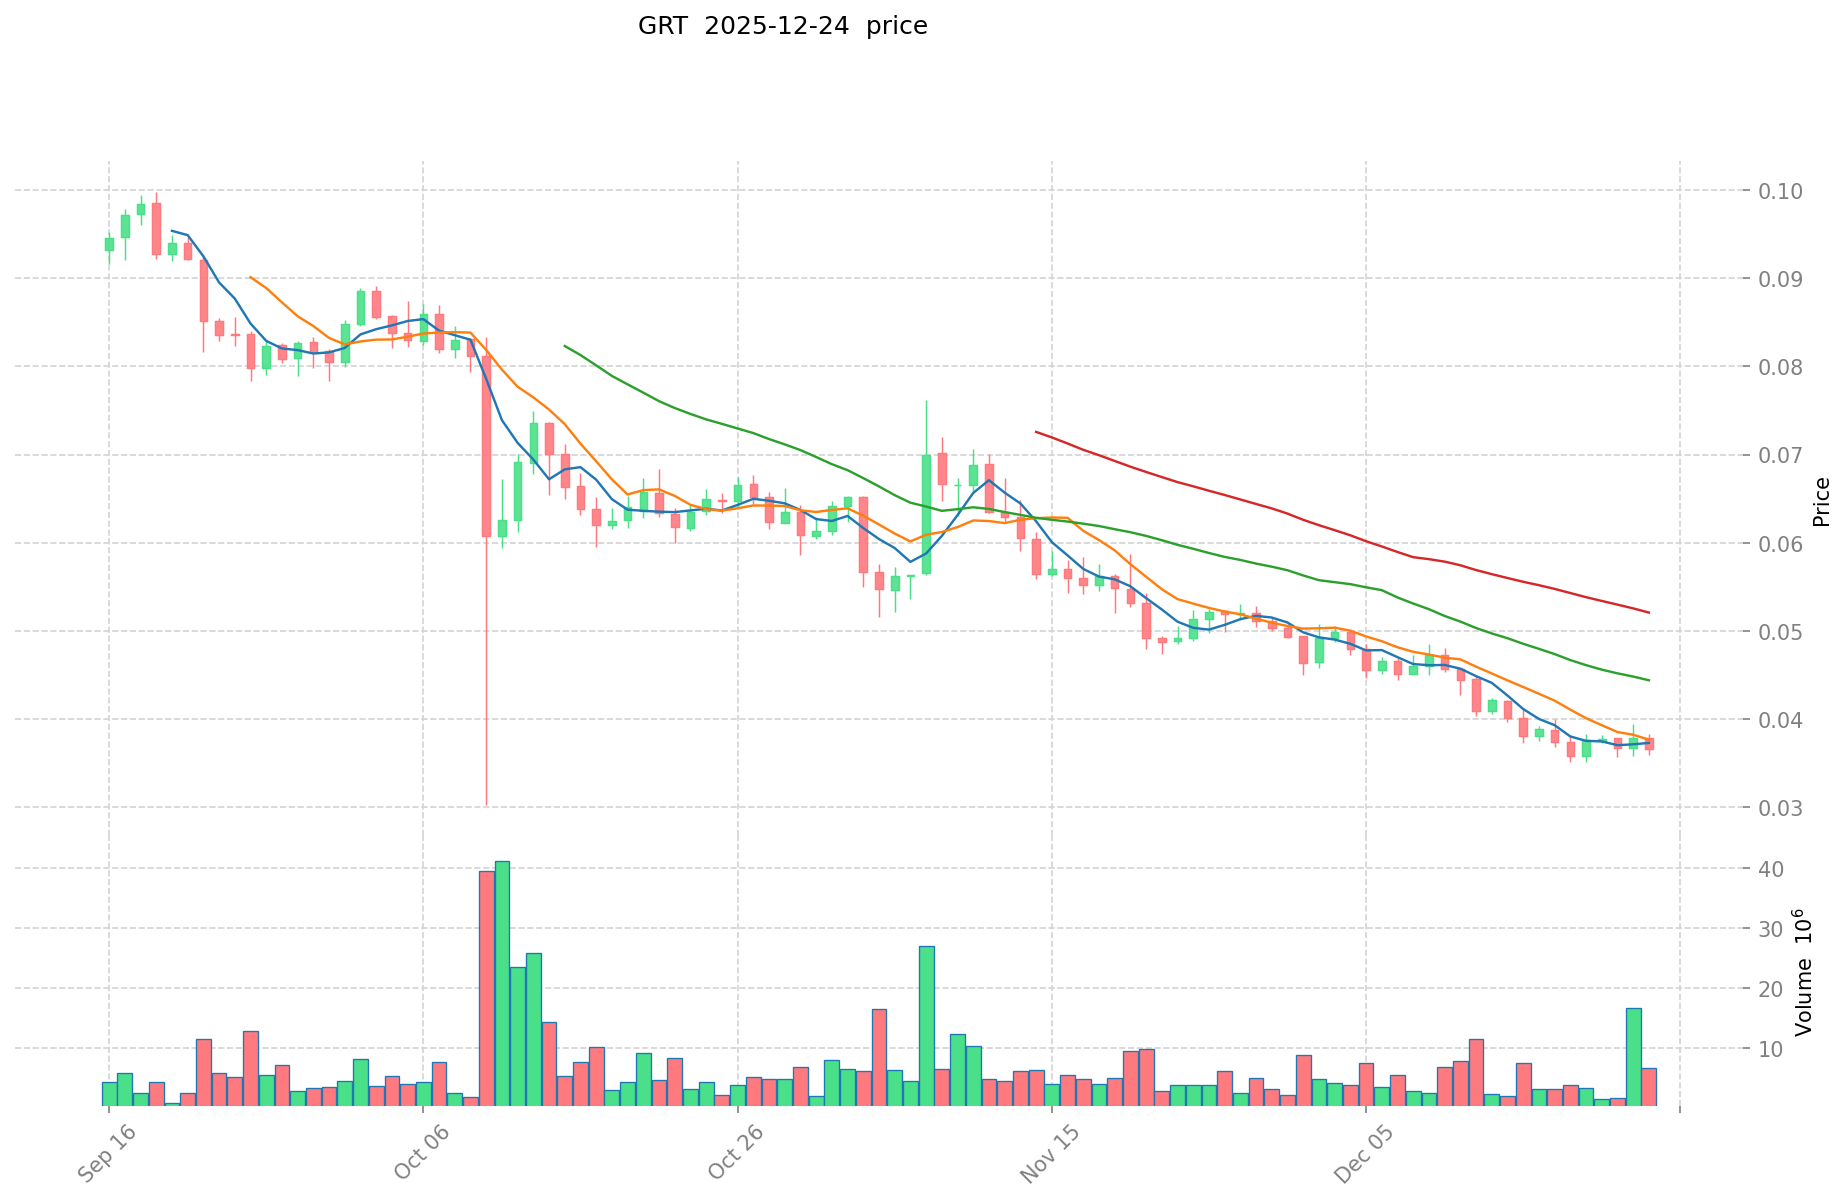
The Graph (GRT) Performance:
- All-Time High (ATH): $2.84 (February 12, 2021)
- All-Time Low (ATL): $0.03519341 (December 19, 2025)
- Year-over-Year Change: -83.89%
- GRT has experienced a prolonged bear market phase, declining substantially from its 2021 peak. The token reached its recent ATL just five days ago, indicating continued downward pressure.
Comparative Analysis: XL1 and GRT both demonstrate significant downward pressure over their respective tracked periods. XL1's year-to-date decline of 45.16% is considerably less severe than GRT's annual decline of 83.89%. However, XL1's recent volatility (with a 77.95% pullback from ATH within a three-month window) suggests more pronounced short-term price instability. GRT's extended bear market reflects a longer-term struggle to recover from its 2021 bull market peak, with the token trading at approximately 1.24% of its historical high.
Current Market Status (December 24, 2025)
XL1 Market Data:
- Current Price: $0.0006549
- 24-Hour Change: -0.71%
- 7-Day Change: -3.38%
- 30-Day Change: +0.35%
- Market Capitalization: $3,732,930
- 24-Hour Trading Volume: $28,427.23
- Fully Diluted Valuation (FDV): $24,886,200
- Circulating Supply: 5,700,000,000 XL1 (15% of total supply)
- Total Supply: 38,000,000,000 XL1
- Market Ranking: #1,718
The Graph (GRT) Market Data:
- Current Price: $0.03599
- 24-Hour Change: -3.51%
- 7-Day Change: -7.21%
- 30-Day Change: -28.22%
- Market Capitalization: $383,545,246
- 24-Hour Trading Volume: $228,811.71
- Fully Diluted Valuation (FDV): $388,701,459
- Circulating Supply: 10,656,994,882 GRT (98.67% of total supply)
- Total Supply: 10,800,262,816 GRT
- Market Ranking: #143
24-Hour Trading Volume Comparison:
- XL1: $28,427.23 (significantly lower liquidity)
- GRT: $228,811.71 (approximately 8 times higher volume)
GRT maintains substantially higher trading volume and market capitalization, reflecting greater market adoption and liquidity. However, GRT has experienced more severe short-term price deterioration, with a 28.22% decline over the past 30 days compared to XL1's modest 0.35% gain.
Market Emotion Indicator (Fear & Greed Index):
- Index Value: 24
- Status: Extreme Fear
- Interpretation: The crypto market is experiencing extreme fear conditions as of December 24, 2025, which typically correlates with heightened market volatility, reduced risk appetite, and potential capitulation selling across digital assets.
Check Real-Time Prices:
- View XL1 Current Price: Market Data
- View The Graph (GRT) Current Price: Market Data
Crypto Asset Investment Analysis: XL1 and GRT Value Factors Report
I. Executive Summary
Based on the available reference materials, this report examines the core investment value factors for XL1 and GRT cryptocurrencies. The analysis reveals that both digital assets are subject to significant volatility influenced by market conditions, investor sentiment, regulatory developments, and technological advancements. However, the provided source materials contain limited specific technical and operational details about GRT, focusing primarily on general cryptocurrency valuation principles and XL1-specific information.
II. Core Factors Influencing XL1 and GRT Investment Value
A. Market Conditions and Volatility Framework
The investment value of both XL1 and GRT depends fundamentally on several interconnected factors:
Market conditions, investor sentiment, regulatory developments, and technological advancements represent the primary drivers of cryptocurrency valuation. These factors collectively determine price movement patterns and longer-term value trajectories.
Key volatility considerations:
- Digital asset prices demonstrate high volatility, potentially influenced by various market factors
- Participation in cryptocurrency projects carries substantial risk, including potential total loss of invested capital
- Price fluctuations can occur due to underlying technology factors or security concerns
B. XL1-Specific Value Drivers
Tokenomics and Supply Mechanism:
- XL1 functions as a transaction fuel token with no supply cap limitation
- The token architecture includes cross-chain bridging capabilities
- Token scarcity enhancement mechanisms are built into the design
Project Positioning:
- XYO Network, associated with XL1, positions itself as a pioneer in Decentralized Physical Infrastructure Networks (DePIN)
- The project has established global presence since 2018
- The platform emphasizes oracle infrastructure within the decentralized oracle space
C. Decision-Making Framework for Investors
Investors and traders must carefully monitor cryptocurrency valuations to make informed decisions regarding:
- Token purchase timing and entry points
- Position holding strategies
- Exit strategy implementation
III. Risk Factors and Market Considerations
High Volatility Profile
Blockchain project-related digital assets demonstrate high price volatility and are susceptible to various influencing factors. Investment participation may result in significant or even total investment losses.
Specific risk categories:
- Underlying technology vulnerabilities or security breaches
- Regulatory changes and policy uncertainties
- Market sentiment shifts and speculative dynamics
Information Asymmetry
Investors should exercise due diligence by:
- Carefully reviewing project documentation and prospectuses
- Monitoring regulatory developments in relevant jurisdictions
- Assessing technological advancement and competitive positioning
IV. Limitations of Current Analysis
Data Constraints:
The provided reference materials contain insufficient specific information regarding:
- GRT (The Graph) technical specifications and ecosystem details
- Comparative institutional adoption metrics
- Detailed macroeconomic correlation analysis
- Geographic regulatory framework differentiation
- Technology upgrade timelines and implementation details
Recommendation for Further Research:
A comprehensive investment analysis would require additional source materials covering:
- Project whitepapers and technical documentation
- Institutional ownership data and fund allocation trends
- Regulatory status across major jurisdictions
- Ecosystem development metrics and adoption statistics
- Comparative DeFi and enterprise use case analysis
V. Conclusion
Both XL1 and GRT operate within the cryptocurrency market framework characterized by high volatility and multi-factor valuation dynamics. Investment decisions should be grounded in understanding how market conditions, technological developments, regulatory environment, and project-specific factors interact to influence token value trajectories. The complexity of these relationships necessitates ongoing monitoring and analysis before investment commitment.
III. 2025-2030 Price Forecast: XL1 vs GRT
Short-term Forecast (2025)
- XL1: Conservative $0.000537-$0.0006549 | Optimistic $0.000910
- GRT: Conservative $0.0248-$0.03595 | Optimistic $0.0399
Medium-term Forecast (2027-2028)
- XL1 may enter accumulation phase, with expected price range of $0.000654-$0.001151
- GRT may enter growth phase, with expected price range of $0.0270-$0.0548
- Key drivers: institutional capital inflows, ETF adoption, ecosystem development
Long-term Forecast (2030)
- XL1: Base case $0.000853-$0.00108 | Optimistic case $0.001275
- GRT: Base case $0.0427-$0.057 | Optimistic case $0.0735
Disclaimer:
This analysis is based on historical data modeling and market indicators. Cryptocurrency markets are highly volatile and predictions carry substantial risk. Past performance does not guarantee future results. This content is for informational purposes only and should not be considered investment advice. Investors should conduct independent research and consult with financial professionals before making investment decisions.
XL1:
| 年份 | 预测最高价 | 预测平均价格 | 预测最低价 | 涨跌幅 |
|---|---|---|---|---|
| 2025 | 0.000910311 | 0.0006549 | 0.000537018 | 0 |
| 2026 | 0.000853039995 | 0.0007826055 | 0.000696518895 | 19 |
| 2027 | 0.001054991344275 | 0.0008178227475 | 0.000654258198 | 24 |
| 2028 | 0.001151780666441 | 0.000936407045887 | 0.000711669354874 | 42 |
| 2029 | 0.001117180426096 | 0.001044093856164 | 0.000626456313698 | 59 |
| 2030 | 0.001275151826533 | 0.00108063714113 | 0.000853703341493 | 65 |
GRT:
| 年份 | 预测最高价 | 预测平均价格 | 预测最低价 | 涨跌幅 |
|---|---|---|---|---|
| 2025 | 0.0399045 | 0.03595 | 0.0248055 | 0 |
| 2026 | 0.052339605 | 0.03792725 | 0.0276868925 | 5 |
| 2027 | 0.056416784375 | 0.0451334275 | 0.0270800565 | 25 |
| 2028 | 0.0548371144125 | 0.0507751059375 | 0.037065827334375 | 40 |
| 2029 | 0.061255087803 | 0.052806110175 | 0.04066070483475 | 46 |
| 2030 | 0.07356947269581 | 0.057030598989 | 0.04277294924175 | 58 |
Comparative Analysis Report: XL1 vs The Graph (GRT)
I. Price History Comparison and Current Market Status
XL1 and The Graph (GRT) Historical Price Trends
XL1 Performance:
- All-Time High (ATH): $0.0027985 (September 16, 2025)
- All-Time Low (ATL): $0.0006172 (November 21, 2025)
- Year-over-Year Change: -45.16%
- Drawdown from ATH: 77.95% (within three-month window)
The Graph (GRT) Performance:
- All-Time High (ATH): $2.84 (February 12, 2021)
- All-Time Low (ATL): $0.03519341 (December 19, 2025)
- Year-over-Year Change: -83.89%
- Trading at approximately 1.24% of historical high
Comparative Analysis:
XL1 demonstrates a year-to-date decline of 45.16%, which is considerably less severe than GRT's annual decline of 83.89%. However, XL1's recent volatility with a 77.95% pullback from ATH within a three-month window suggests pronounced short-term price instability. GRT's extended bear market reflects a prolonged struggle to recover from its 2021 bull market peak.
Current Market Status (December 24, 2025)
XL1 Market Data:
- Current Price: $0.0006549
- 24-Hour Change: -0.71%
- 7-Day Change: -3.38%
- 30-Day Change: +0.35%
- Market Capitalization: $3,732,930
- 24-Hour Trading Volume: $28,427.23
- Fully Diluted Valuation (FDV): $24,886,200
- Circulating Supply: 5,700,000,000 XL1 (15% of total supply)
- Total Supply: 38,000,000,000 XL1
- Market Ranking: #1,718
The Graph (GRT) Market Data:
- Current Price: $0.03599
- 24-Hour Change: -3.51%
- 7-Day Change: -7.21%
- 30-Day Change: -28.22%
- Market Capitalization: $383,545,246
- 24-Hour Trading Volume: $228,811.71
- Fully Diluted Valuation (FDV): $388,701,459
- Circulating Supply: 10,656,994,882 GRT (98.67% of total supply)
- Total Supply: 10,800,262,816 GRT
- Market Ranking: #143
Liquidity Comparison:
GRT maintains substantially higher trading volume ($228,811.71 vs $28,427.23) and market capitalization, reflecting greater market adoption and liquidity. However, GRT has experienced more severe short-term price deterioration with a 28.22% decline over the past 30 days compared to XL1's modest 0.35% gain.
Market Sentiment Indicator:
Current Fear & Greed Index: 24 (Extreme Fear) - indicating heightened market volatility, reduced risk appetite, and potential capitulation selling across digital assets.
II. Core Factors Influencing XL1 and GRT Investment Value
A. Market Conditions and Volatility Framework
Market conditions, investor sentiment, regulatory developments, and technological advancements represent the primary drivers of cryptocurrency valuation. These factors collectively determine price movement patterns and longer-term value trajectories.
Key volatility considerations:
- Digital asset prices demonstrate high volatility influenced by various market factors
- Participation in cryptocurrency projects carries substantial risk, including potential total loss of invested capital
- Price fluctuations can occur due to underlying technology factors or security concerns
B. XL1-Specific Value Drivers
Tokenomics and Project Positioning:
- XL1 serves as the utility token of XYO Layer One, a scalable data blockchain designed to bring verifiable information on-chain
- Token functions include gas payments, transaction fees, smart contracts, decentralized applications, and validator rewards
- Enables cross-chain bridging and staking mechanisms
- XYO Network positions itself as a pioneer in Decentralized Physical Infrastructure Networks (DePIN) with global presence since 2018
- Emphasis on oracle infrastructure within the decentralized oracle space
C. GRT-Specific Value Drivers
Project Positioning:
- The Graph established itself as a decentralized protocol for indexing and querying blockchain data on Ethereum since December 2020
- Serves as critical infrastructure layer enabling efficient data access across the blockchain ecosystem
III. 2025-2030 Price Forecast Analysis
Short-term Forecast (2025)
- XL1: Conservative $0.000537-$0.0006549 | Optimistic $0.000910
- GRT: Conservative $0.0248-$0.03595 | Optimistic $0.0399
Medium-term Forecast (2027-2028)
- XL1: Expected accumulation phase with price range of $0.000654-$0.001151
- GRT: Expected growth phase with price range of $0.0270-$0.0548
- Key drivers: institutional capital inflows, ETF adoption, ecosystem development
Long-term Forecast (2030)
- XL1: Base case $0.000853-$0.00108 | Optimistic case $0.001275
- GRT: Base case $0.0427-$0.057 | Optimistic case $0.0735
Forecast Summary Table:
XL1 Price Projections:
| Year | Predicted High | Predicted Average | Predicted Low | Change % |
|---|---|---|---|---|
| 2025 | 0.000910 | 0.0006549 | 0.000537 | 0 |
| 2026 | 0.000853 | 0.0007826 | 0.000697 | 19 |
| 2027 | 0.001055 | 0.0008178 | 0.000654 | 24 |
| 2028 | 0.001152 | 0.0009364 | 0.000712 | 42 |
| 2029 | 0.001117 | 0.001044 | 0.000626 | 59 |
| 2030 | 0.001275 | 0.001081 | 0.000854 | 65 |
GRT Price Projections:
| Year | Predicted High | Predicted Average | Predicted Low | Change % |
|---|---|---|---|---|
| 2025 | 0.039905 | 0.03595 | 0.024806 | 0 |
| 2026 | 0.052340 | 0.037927 | 0.027687 | 5 |
| 2027 | 0.056417 | 0.045133 | 0.027081 | 25 |
| 2028 | 0.054837 | 0.050776 | 0.037066 | 40 |
| 2029 | 0.061255 | 0.052806 | 0.040661 | 46 |
| 2030 | 0.073569 | 0.057031 | 0.042773 | 58 |
IV. Investment Strategy Comparison: XL1 vs GRT
Long-term vs Short-term Investment Strategies
XL1:
- Suitable for investors focused on emerging DePIN infrastructure and oracle technology adoption
- Short-term strategy: Monitor ecosystem development and adoption metrics; consider dollar-cost averaging given current price volatility
- Long-term strategy: Position building with emphasis on technology maturation and cross-chain utility expansion
GRT:
- Suitable for investors seeking established infrastructure exposure with proven market presence
- Short-term strategy: Accumulation during extreme fear periods; monitor institutional adoption trends
- Long-term strategy: Exposure to blockchain data indexing infrastructure, which represents fundamental blockchain ecosystem need
Risk Management and Asset Allocation
Conservative Investors:
- XL1: 10-15% allocation (higher risk profile, smaller market cap)
- GRT: 15-20% allocation (established infrastructure, larger ecosystem)
- Remaining allocation: Stablecoins (40-50%), other diversified crypto assets (25-35%)
Aggressive Investors:
- XL1: 25-35% allocation (opportunity for higher growth potential)
- GRT: 20-30% allocation (balanced infrastructure exposure)
- Remaining allocation: Other growth-stage assets (35-50%), tactical positions (5-10%)
Hedging Tools:
- Stablecoin reserves for opportunistic entry during market extremes (current Fear & Greed Index: 24)
- Cross-asset diversification across different blockchain infrastructure categories
- Position rebalancing at predetermined price targets
V. Comparative Risk Analysis
Market Risk
XL1:
- Significantly lower market capitalization ($3.73M) creates liquidity constraints and potential slippage on larger trades
- Recent 77.95% drawdown from ATH indicates susceptibility to sharp corrections
- Limited institutional adoption compared to larger-cap projects
- High concentration risk with only 15% circulating supply
GRT:
- Larger market capitalization ($383.5M) provides better liquidity and institutional accessibility
- 28.22% decline over past 30 days reflects ongoing bear market pressure and sentiment weakness
- 98.67% of supply already circulating may limit token appreciation potential
- Prolonged recovery period from 2021 ATH suggests sustained investor skepticism
Technology Risk
XL1:
- Emerging DePIN infrastructure model with limited long-term track record
- Cross-chain bridging functionality adds technical complexity and potential security surface area
- Validator network maturity and security audit status require ongoing monitoring
GRT:
- Established protocol with multi-year operational history since December 2020
- Data indexing infrastructure represents core blockchain ecosystem function
- Protocol governance and network validator participation model require continued assessment
Regulatory Risk
Global Regulatory Framework Impacts:
- Both tokens face potential classification as utility assets or securities depending on jurisdiction
- DeFi infrastructure tokens (both XL1 and GRT) may face intensified regulatory scrutiny regarding oracle manipulation and data integrity
- Jurisdictional restrictions on token trading and staking could impact adoption growth
- Current regulatory environment increasingly focused on institutional custody and compliance, potentially favoring more established projects (GRT)
VI. Conclusion: Which Is the Better Buy?
Investment Value Summary
XL1 Advantages:
- Early-stage DePIN infrastructure positioning with emerging market adoption
- Recent price recovery momentum (+0.35% over 30 days during market downturn)
- Smaller market cap provides potential for significant percentage gains if ecosystem adoption accelerates
- Lower current price point enables broader retail accessibility
GRT Advantages:
- Established market presence with 5-year operational history demonstrating protocol stability
- Substantially larger market capitalization ($383.5M) provides superior liquidity and institutional accessibility
- Core blockchain data infrastructure represents fundamental ecosystem requirement with sustained demand
- Higher circulating supply percentage (98.67%) reduces dilution risk from future token releases
- Significantly higher trading volume ($228,811.71) enables position flexibility
Investment Recommendations
New Investors:
- Recommended allocation strategy: Begin with GRT as core infrastructure holding (due to established history and lower technical risk)
- Supplement with small XL1 allocation only after establishing foundational knowledge of DePIN ecosystems
- Utilize current extreme fear conditions (Fear & Greed Index: 24) for dollar-cost averaging rather than lump-sum entry
- Implement strict stop-loss discipline given cryptocurrency volatility
Experienced Investors:
- Consider tactical 70-30 allocation favoring GRT for core holdings while maintaining XL1 exposure for portfolio upside potential
- Employ market timing strategies around Fear & Greed extremes for entry optimization
- Monitor regulatory developments affecting oracle and data infrastructure classifications
- Rebalance quarterly based on ecosystem development metrics and adoption statistics
Institutional Investors:
- GRT represents more suitable initial allocation for institutional custody and compliance frameworks
- XL1 presents allocation consideration only after institutional-grade security audits and custody solutions are established
- Require detailed technical documentation and governance review before significant capital deployment
- Consider impact of tokenomics on long-term value trajectories, particularly GRT's high circulating supply percentage
Disclaimer:
This analysis is based on historical data modeling and market indicators available as of December 24, 2025. Cryptocurrency markets are highly volatile and predictions carry substantial risk. Past performance does not guarantee future results. This content is for informational purposes only and should not be considered investment advice. Investors should conduct independent research and consult with qualified financial professionals before making investment decisions.
⚠️ Risk Warning: Cryptocurrency market volatility is extreme. Both XL1 and GRT carry significant risk of capital loss. No investment recommendation should be construed from this analysis without independent verification and professional consultation. None
FAQ: XL1 vs The Graph (GRT) Investment Comparison
I. What are the key differences between XL1 and GRT in terms of market positioning?
Answer: XL1 and GRT serve distinct roles within the cryptocurrency ecosystem. XL1 is the utility token of XYO Layer One, positioning itself as a pioneer in Decentralized Physical Infrastructure Networks (DePIN) with capabilities for cross-chain bridging and oracle services. GRT, established since December 2020, functions as a decentralized protocol for indexing and querying blockchain data on Ethereum, serving as fundamental infrastructure for data access. GRT operates at a larger market capitalization ($383.5M vs $3.7M for XL1) and has achieved greater institutional adoption due to its longer operational history.
II. How do the current market conditions compare between these two tokens?
Answer: As of December 24, 2025, both tokens face challenging market conditions under extreme fear sentiment (Fear & Greed Index: 24). GRT currently trades at $0.03599 with a 28.22% decline over the past 30 days, while XL1 trades at $0.0006549 with only a 0.35% 30-day gain. GRT demonstrates significantly higher liquidity with $228,811.71 in 24-hour trading volume compared to XL1's $28,427.23. However, XL1's year-to-date decline of -45.16% is less severe than GRT's -83.89% annual decline, suggesting different volatility patterns between the two assets.
III. Which token offers better investment potential for long-term holders?
Answer: The answer depends on investor risk tolerance and investment horizon. GRT presents a more conservative long-term option due to its established infrastructure status, larger market capitalization, and proven 5-year operational history. XL1 offers higher growth potential for risk-tolerant investors betting on DePIN ecosystem adoption, with price forecasts suggesting 65% appreciation potential by 2030 compared to GRT's 58% upside. Long-term forecasts project GRT reaching $0.0427-$0.057 by 2030 in base case scenarios, while XL1 is expected to reach $0.000853-$0.00108, representing different absolute price trajectories reflecting their distinct market capitalizations.
IV. What are the primary risk factors differentiating these two investments?
Answer: XL1 faces liquidity constraints due to its significantly smaller market capitalization ($3.7M), with only 15% of total supply currently circulating, creating concentration risk. Its emerging DePIN model lacks the long-term operational track record of established protocols. GRT's primary risks include its prolonged bear market struggle (trading at 1.24% of 2021 ATH) and 98.67% circulating supply, which may limit future token appreciation potential. Both face regulatory uncertainty regarding classification as utility assets or securities, with intensified scrutiny anticipated for oracle and data infrastructure tokens. Current extreme fear conditions (Fear & Greed Index: 24) affect both tokens, though XL1 demonstrates greater short-term volatility with a 77.95% drawdown from its September 2025 peak.
V. How should portfolio allocation differ between conservative and aggressive investors?
Answer: Conservative investors should prioritize GRT with 15-20% allocation due to its established infrastructure status and lower technical risk, supplementing with only 10-15% XL1 exposure while maintaining 40-50% stablecoin reserves. Aggressive investors can allocate 20-30% to GRT as core infrastructure holdings while increasing XL1 exposure to 25-35% for portfolio upside potential, with remaining allocation to other growth-stage assets (35-50%) and tactical positions (5-10%). Both investor profiles should exploit current extreme fear conditions through dollar-cost averaging strategies rather than lump-sum entries, with implementation of strict stop-loss discipline given cryptocurrency volatility. Quarterly rebalancing based on ecosystem development metrics is recommended for optimizing long-term returns.
VI. What do price forecasts suggest about these tokens' 2025-2030 trajectories?
Answer: XL1 price forecasts indicate conservative 2025 projections of $0.000537-$0.0006549 (current level), with optimistic scenarios reaching $0.000910. Medium-term projections (2027-2028) suggest an accumulation phase with expected ranges of $0.000654-$0.001151. By 2030, base case scenarios project $0.000853-$0.00108, with optimistic cases reaching $0.001275. GRT demonstrates similar conservative 2025 range of $0.0248-$0.03595, with optimistic scenarios at $0.0399. Medium-term growth phases (2027-2028) project $0.0270-$0.0548 ranges, while 2030 base case scenarios predict $0.0427-$0.057 with optimistic cases reaching $0.0735. These forecasts reflect anticipated institutional capital inflows, ETF adoption, and ecosystem development acceleration over the forecast period.
VII. Which token is more suitable for institutional investors?
Answer: GRT represents the superior option for institutional investors due to multiple factors: larger market capitalization enabling institutional custody solutions, 5-year operational history demonstrating protocol stability, and substantially higher trading volume supporting position flexibility. Institutional-grade infrastructure for custody, compliance frameworks, and security auditing is already established for GRT. XL1 should only be considered for institutional allocation after achieving institutional-quality security audits, establishing dedicated custody solutions, and demonstrating sustained ecosystem adoption metrics. Institutional investors should prioritize detailed technical documentation review and governance assessment before capital deployment, with particular attention to tokenomics' long-term value implications—specifically GRT's high 98.67% circulating supply percentage versus XL1's concentrated 15% circulation rate.
VIII. How can investors optimize entry timing given current market conditions?
Answer: Current extreme fear sentiment (Fear & Greed Index: 24) presents strategic accumulation opportunities for both tokens. Rather than attempting lump-sum entries, implement disciplined dollar-cost averaging strategies across 4-8 week periods to mitigate timing risk. For GRT, recent all-time lows ($0.03519341 recorded December 19, 2025) represent potential accumulation zones for long-term investors seeking core infrastructure exposure. For XL1, recent lows near $0.0006172 (November 21, 2025) may signal early reversal signals if ecosystem adoption accelerates. Monitor quarterly ecosystem development metrics, regulatory announcements, and Fear & Greed Index movements to guide rebalancing decisions. Set predetermined buy targets at Fear & Greed readings exceeding 80 (extreme greed) for profit-taking and below 30 (extreme fear) for position building, adjusting allocations based on individual risk tolerance and portfolio composition.
Share
How to Buy Cryptocurrency


Trending Cryptocurrencies


SDM vs SNX: Comparing Two Leading Synthetic Asset Protocols in DeFi

Avalanche (AVAX) 2025 Price Analysis and Market Trends

SEI Staking Analysis: 60-70% Supply Locked and Its Price Impact

Latest Analysis and Investment Outlook for Chainlink Price in June 2025

FTT Explained

next crypto to hit $1 in 2025

2025 CLND Price Prediction: Expert Analysis and Market Forecast for the Next Year
2025 PORT Price Prediction: Expert Analysis and Market Forecast for the Upcoming Year

2025 NYZO Price Prediction: Expert Analysis and Market Forecast for the Year Ahead

How to Find Your EVM Address?

Wyckoff Pattern: A Simplified Guide for Beginners