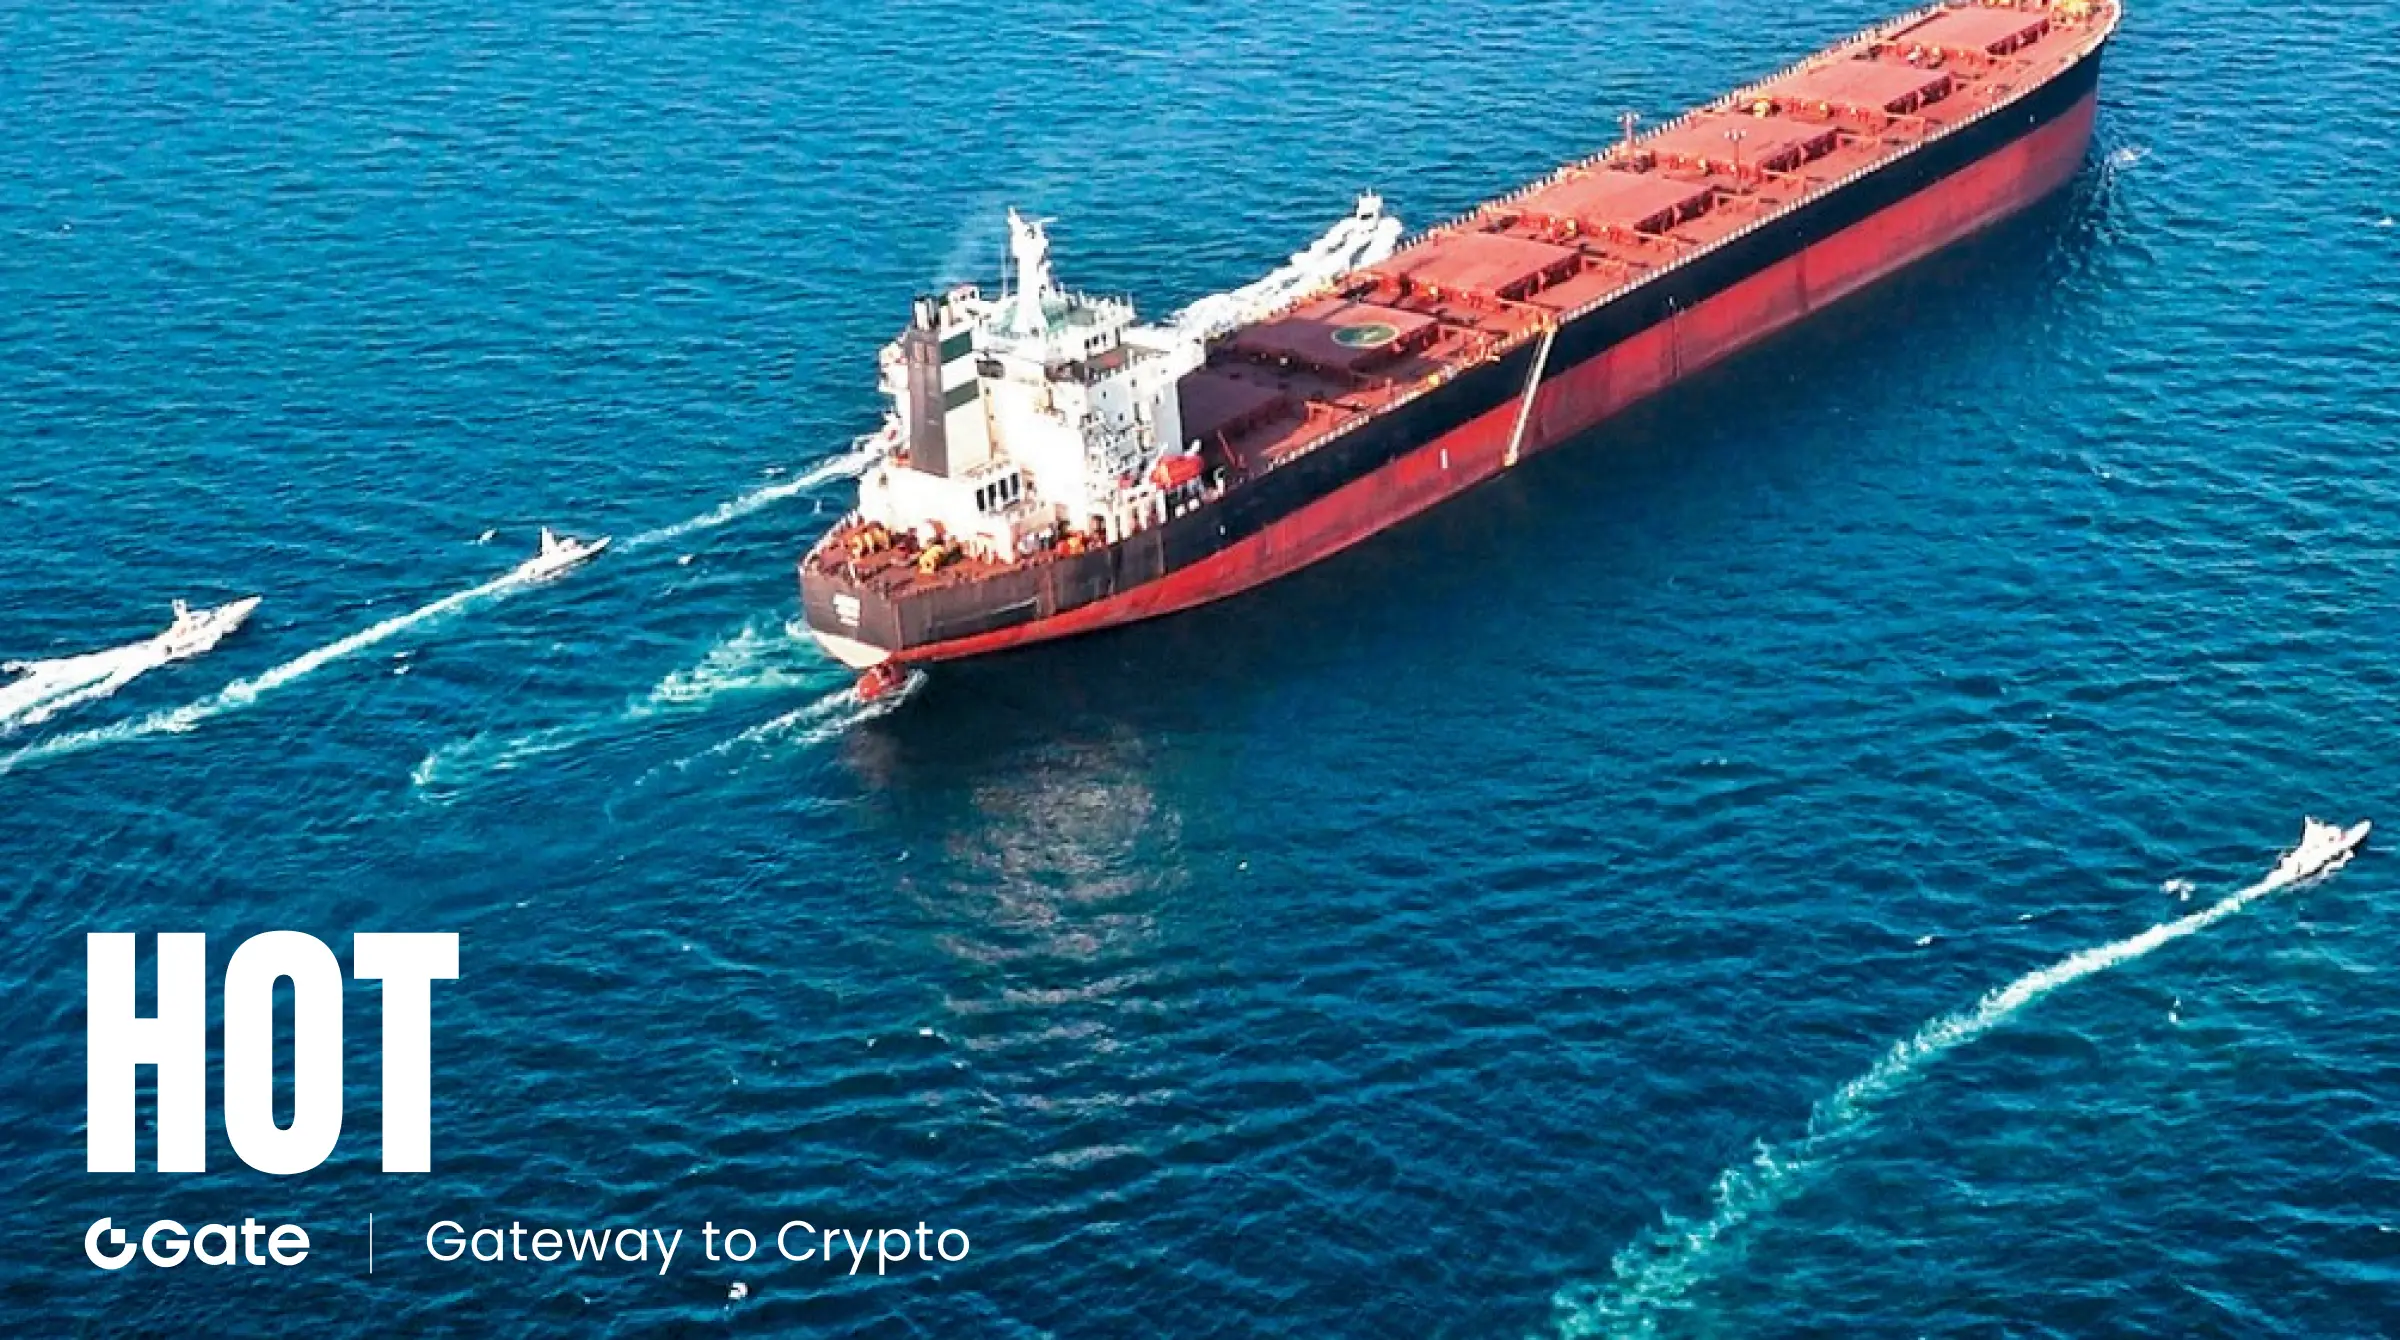
As of July 9, 2026, vessel traffic through the Strait of Hormuz dropped to 25 ships, below the recent daily average of 30 to 50 ships. Following U.S. President Trump’s announcement that the US-Iran ceasefire agreement has ended and both sides are exchanging further strikes, this critical global energy corridor has once again entered a state of full conflict.
Maritime analysts note that the shipping activity, which had been gradually recovering since mid-June, has collapsed. This is not a typical fluctuation in transit but a key point where geopolitical risks are shifting from diplomatic maneuvers to tangible actions. The Strait of Hormuz accounts for about one-fifth of global oil transportation; disruptions here imply chain reactions in energy supply, inflation expectations, monetary policy, and even crypto asset pricing logic.
Why the Ceasefire Agreement Broke Down: From Temporary Truce to Full-Scale Conflict in 48 Hours
On June 18, Iran and the US signed a 60-day memorandum of understanding, allowing Iran to export oil and lifting some sanctions, while Iran pledged to ensure safe navigation through the Strait of Hormuz. The agreement lasted only 22 days.
The trigger for its collapse was Iran’s Tuesday attack on three commercial ships passing through the Strait, including a Saudi oil tanker and a Qatari liquefied natural gas vessel. The US responded with two days of military strikes—on July 8 targeting about 90 Iranian military sites, and on July 9 launching a new round of airstrikes. Simultaneously, the US Treasury revoked general licenses authorizing Iran’s oil sales, effectively reinstating sanctions previously paused under the temporary agreement.
Iran responded with strikes against US military targets in Bahrain and Kuwait. The Iranian Foreign Ministry stated that US attacks and the revocation of oil sales licenses rendered the memorandum of understanding null and void. Trump publicly declared during the NATO Ankara summit that the ceasefire “has ended.”
From signing to full breakdown, the entire process took about three weeks. This timeframe itself indicates that core disagreements—control of the strait and oil exports—are far from resolvable by a temporary document.
Shipping Data Reveals the True Picture: Transit Volume Has Fallen Below Wartime Levels
Data speaks louder than any statement. On July 9, vessel traffic through the Strait of Hormuz dropped to 25 ships. Jorge Leon, head of geopolitical analysis at energy research firm Rystad Energy, said the day’s transit “appeared to be completely halted.”
More detailed data from ship tracking firm Kpler shows that on July 8, only about 14 bulk carriers crossed the strait in both directions, the lowest since the temporary agreement in mid-June. In the three weeks after the agreement, average daily transit was 34 ships, peaking at 59 ships on June 24; during most wartime days, transit was under 20 ships. The 14 ships on July 8 already fell below wartime levels.
Tracking also reveals a key detail: nearly all observable transit is concentrated near the northern waterway, on Iran-approved routes, while the US-supported southern Oman route is very quiet. This “north-south divide” in transit patterns directly reflects the physical manifestation of geopolitical confrontation.
Bloomberg also notes that some ships may have turned off transponders to avoid tracking, and signs of electronic interference have appeared near the Gulf of Oman, possibly affecting tracking data integrity. This suggests the real situation may be more severe than the data indicates.
Why Energy Markets Are More Concerned About Uncertainty Than Supply Disruptions
Oil prices reacted most directly. As of July 9, 2026, WTI crude futures closed at $73.52 per barrel, up $3.08, a 4.37% increase; Brent crude futures closed at $78.02 per barrel, up $3.86, a 5.2% increase. Brent briefly surged to $80.006 per barrel, a new phase high.
However, market concerns extend beyond physical supply disruptions. Rystad Energy reports that “even without sustained physical supply interruptions, uncertainties around vessel security, insurance costs, potential delays, and further retaliations could continue to elevate market volatility in the near term.”
U.S. Energy Information Administration (EIA) data confirms supply-side tightness. For the week ending July 3, U.S. commercial crude inventories were about 6% below the five-year average; gasoline inventories were also roughly 6% below average; distillates like diesel were about 12% below the five-year mean. With the Strait of Hormuz blocked, U.S. domestic energy buffers are quite limited.
Goldman Sachs estimates that oil flows through the Strait have shrunk from the previously recovered 80% to around 70% of normal levels. Coupled with the revocation of Iran’s oil export licenses, Iran’s daily exports of approximately 1.7 to 1.8 million barrels are rapidly being withdrawn from the global market, adding a significant geopolitical premium to oil prices.
Why Gold and Bitcoin Are Moving Divergently
A notable phenomenon in this geopolitical conflict is the divergence between traditional safe-haven assets like gold and crypto assets like Bitcoin.
As of July 9, 2026, data from Gate shows Bitcoin at $62,870, up 1.6% in 24 hours. Meanwhile, spot gold has fallen for four consecutive trading days, dipping near $4,040, then rebounding slightly above $4,100.
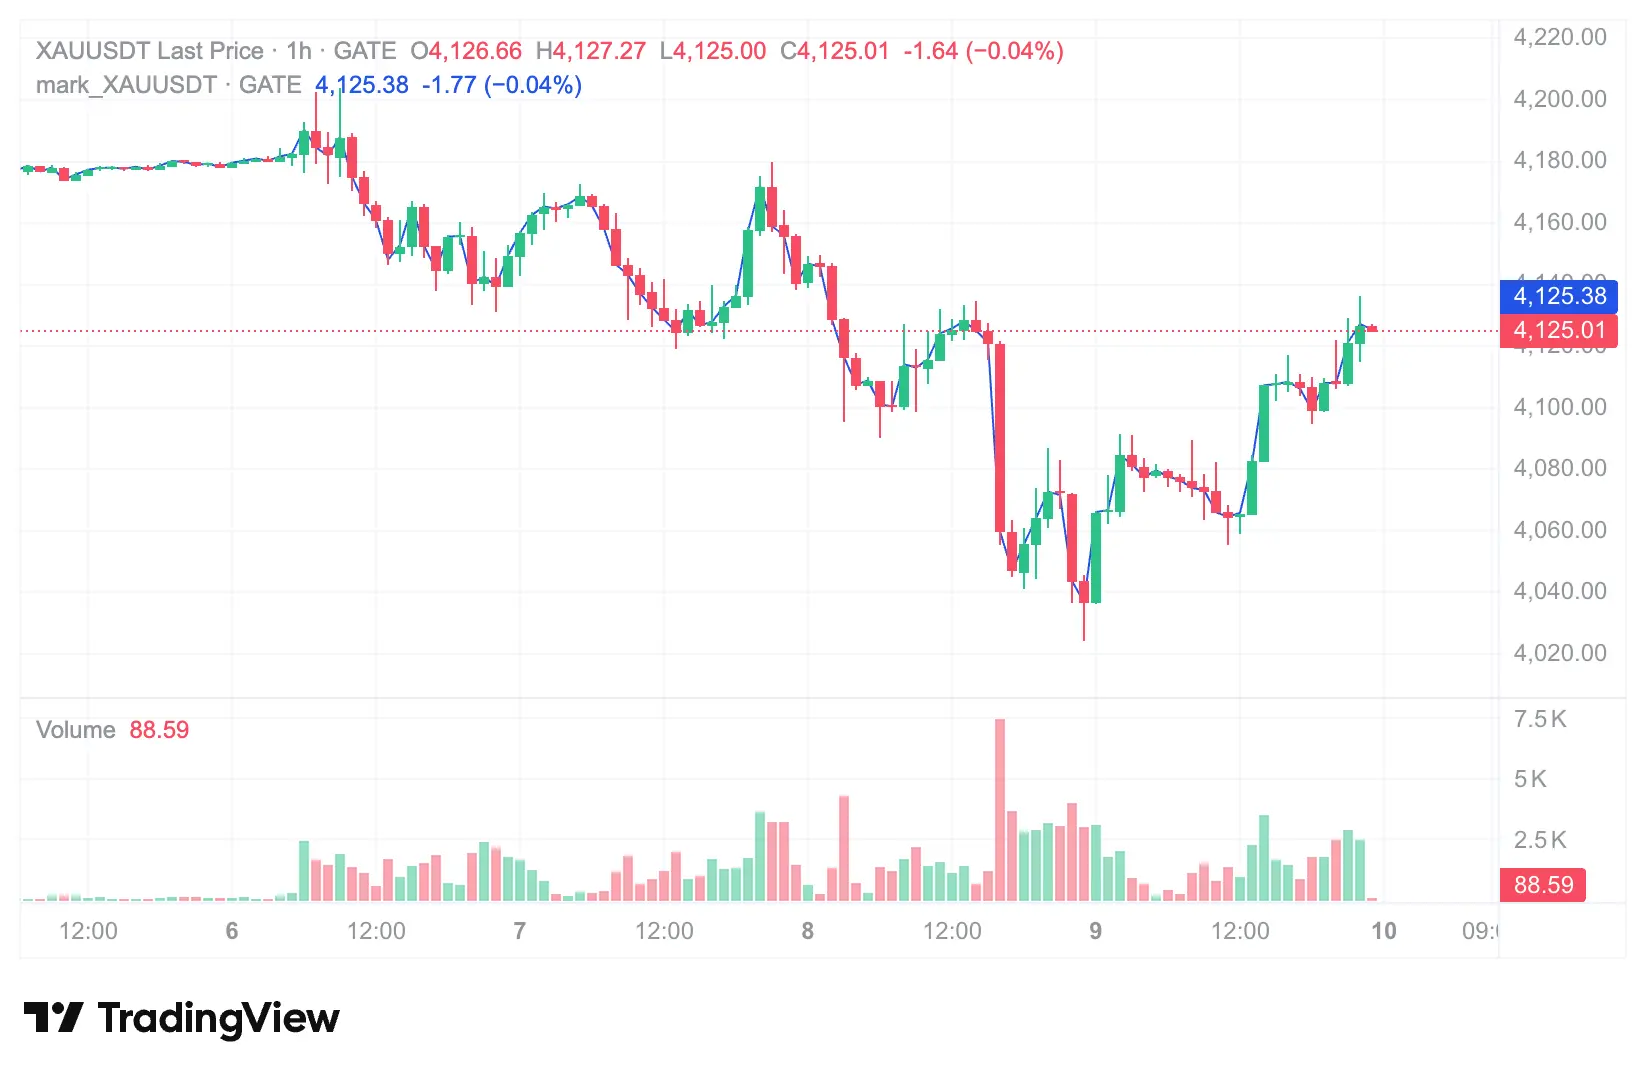
This seemingly counterintuitive trend stems from a fundamental shift in market drivers. The market is not primarily “seeking safe havens,” but rather following a transmission chain: “rising oil prices → inflation rebound → tightening of monetary policy.” The rapid increase in oil prices has directly fueled fears of persistent inflation. According to CME’s “Fed Watch,” the market now prices a 51.9% chance of a rate hike in September.
Expectations of rising interest rates suppress the valuation of non-yield assets like gold—rising U.S. Treasury yields and a strengthening dollar directly weigh on dollar-denominated gold prices. The safe-haven narrative is overshadowed by expectations of monetary tightening. The dollar index remains steady around 100.96 as of July 9.
Bitcoin’s performance is more complex. On one hand, geopolitical instability reinforces its narrative as a decentralized asset independent of traditional finance; on the other hand, a strengthening dollar and declining risk appetite exert downward pressure on dollar-priced cryptocurrencies. These opposing forces cancel each other out, resulting in Bitcoin’s oscillating rather than trending sharply.
How Geopolitical Risks Transmit to Crypto Markets
Understanding the impact of this conflict on crypto markets requires clarifying the full transmission pathway.
First is energy price transmission. Disruption of Hormuz Strait traffic pushes oil prices higher, which raises inflation expectations, further reinforcing expectations of monetary tightening. This chain has a dual effect on crypto assets: liquidity tightening expectations suppress risk asset valuations, but currency devaluation expectations may boost the appeal of inflation-hedging assets.
Second is dollar strengthening transmission. Rising oil prices, via inflation expectations and safe-haven demand, push the dollar higher. A stronger dollar exerts valuation pressure on dollar-denominated assets like Bitcoin.
Third is risk appetite transmission. Escalating geopolitical conflicts typically trigger global risk aversion, leading to sell-offs in risk assets. Historically, crypto markets have experienced rapid liquidations during geopolitical crises, especially as leveraged traders reduce exposure.
Fourth is structural narrative transmission. Long-term geopolitical instability enhances Bitcoin’s reputation among some investors as a decentralized asset independent of governments and traditional banking systems. This narrative provides support for Bitcoin among certain investor groups.
These four transmission layers are not simply additive but interact dynamically. Different market phases and investor structures may see different dominant forces. Understanding these interactions is key to interpreting crypto price movements during geopolitical crises.
FAQ
Q: How important is the Strait of Hormuz to the global energy market?
The Strait handles about 20% of global seaborne crude oil transportation and roughly 32% of seaborne oil exports. This strategic waterway connects the Persian Gulf with the Indian Ocean and is a critical export route for major oil producers like Saudi Arabia, Iran, Iraq, Kuwait, and the UAE.
Q: Why did the US-Iran ceasefire agreement break so quickly?
The 60-day ceasefire signed on June 18 lasted only 22 days. The immediate trigger was Iran’s attack on three ships passing through the Strait, prompting the US to respond with two days of military strikes and the revocation of Iran’s oil export licenses. Fundamental disagreements over core interests mean the temporary agreement lacked a durable foundation.
Q: Why does rising oil prices cause gold to fall?
The market logic chain is: “rising oil prices → increased inflation expectations → stronger expectations of monetary tightening” → rising interest rates suppress the valuation of non-yield assets like gold. The safe-haven effect is overshadowed by the negative impact of monetary tightening, causing gold to decline amid escalating conflict.
Q: Is Bitcoin a safe-haven asset during geopolitical conflicts?
Bitcoin’s behavior during conflicts is complex. On one hand, geopolitical instability reinforces its narrative as a decentralized, independent asset; on the other hand, a stronger dollar and reduced risk appetite exert downward pressure. The recent oscillation indicates that Bitcoin’s “safe-haven” status is not yet firmly established and is influenced by multiple competing factors.
Q: When might shipping through the Strait of Hormuz return to normal?
Market platform Kalshi’s data suggests traders generally believe the flow will likely not normalize before the end of 2026. Rystad Energy analysts note that the real test begins after July 9. The timeline depends on whether the US and Iran are willing to return to diplomatic negotiations and whether military conflict escalates further.


