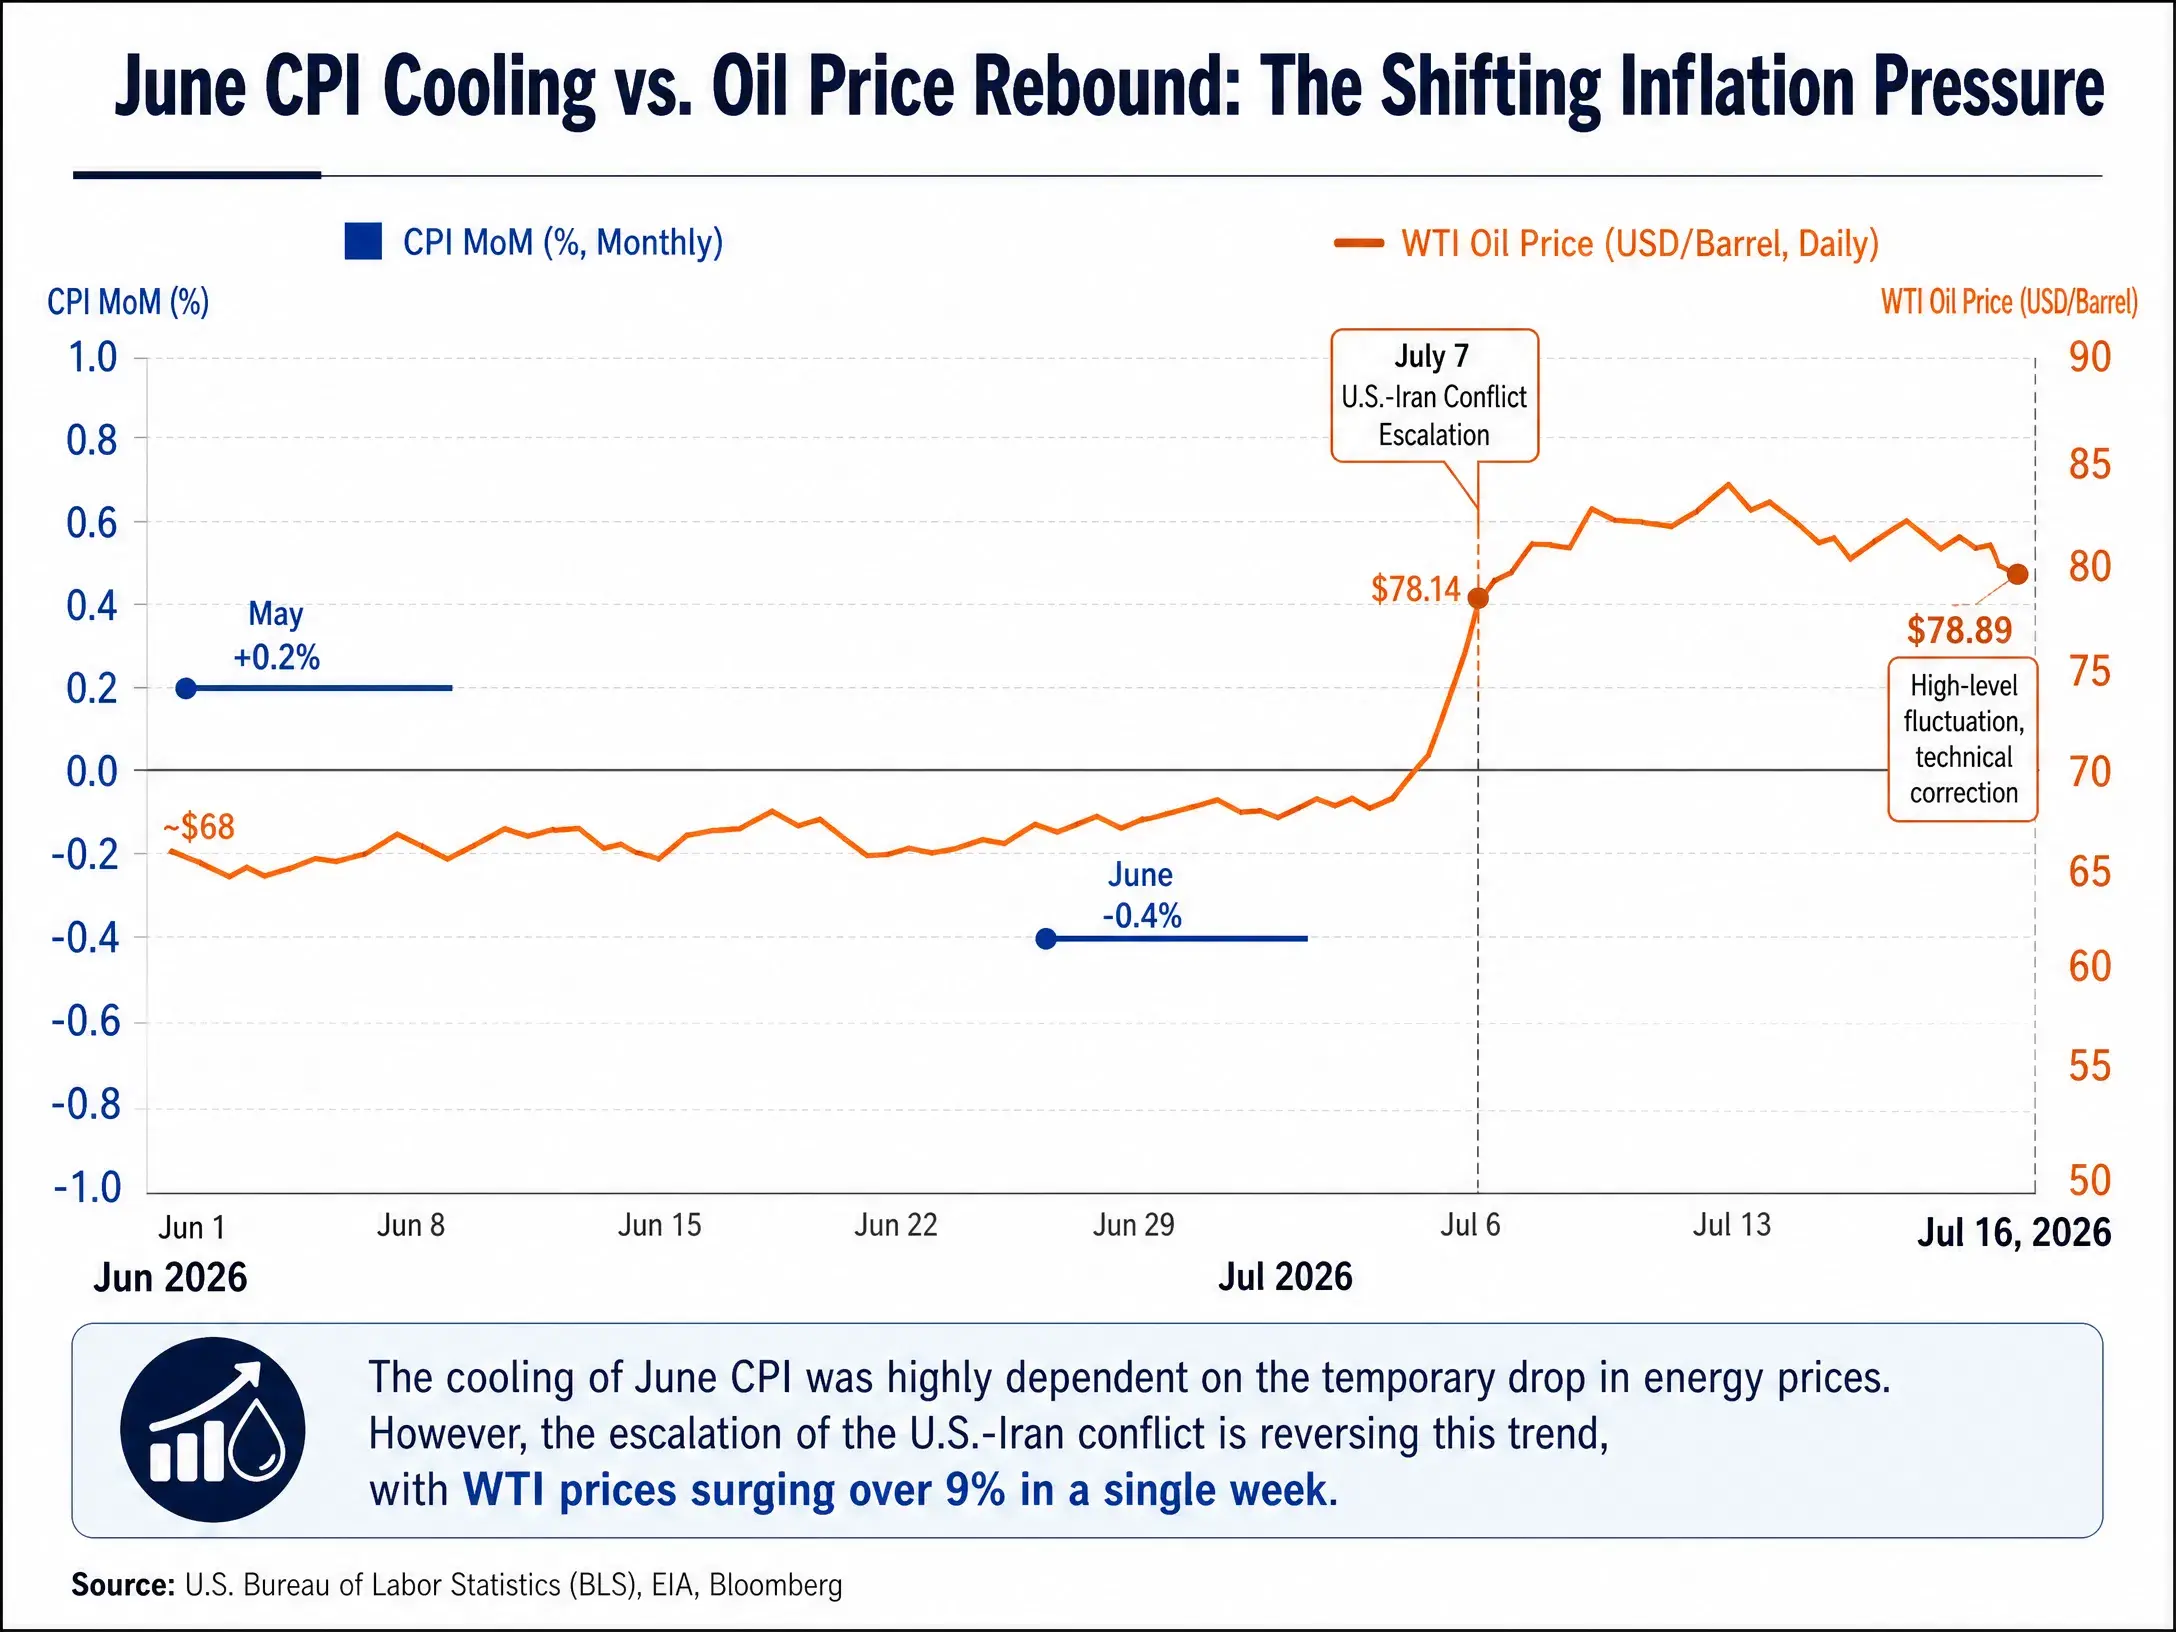
Analysts noted that if export recovery in the Gulf region continues to stall, Brent crude could break $110 in the fourth quarter. Even if the situation does not worsen further, the oil price mid-cycle level is unlikely to return to pre-conflict levels.
How oil price gains transmit to CPI and PCE
To understand the impact of rising oil prices on Fed policy, it’s necessary to clarify the transmission mechanism from energy prices to broader inflation indicators.
First layer of transmission: Direct pull from energy CPI. With June CPI down 0.4% month over month, the energy component contributed 0.43 percentage points of downside. This means that if energy prices return to the levels before June, the energy component alone could pull CPI month over month from negative growth back into positive growth. Current WTI prices are up more than $15 per barrel from June’s trough. Based on the elasticity relationship between June energy prices and oil, the contribution from the energy component could quickly flip from -0.43 percentage points to a positive contribution.
Second layer of transmission: Indirect spillover to core inflation. Oil prices not only directly affect energy CPI, but also transmit to downstream goods and services prices through channels such as transportation costs and relative-price effects. In May, the relative-price ratio between U.S. core CPI and energy CPI had already fallen to levels not seen in recent years, indicating that core inflation is facing clear pressure from oil prices. While the June oil price decline helps ease downstream price pressure, that relief is being reversed. Ajay Rajadhyaksha, Chairman of Barclays Global Research, said the price transmission effects from an oil price shock have not ended, and high energy prices have not suppressed demand—only worsened inflation further.
Third layer of transmission: Sticky PCE response. The Fed’s main inflation metric is the PCE price index, not CPI. May PCE rose 4.1% year over year, higher than April’s 3.8%; core PCE rose 3.4% year over year, the highest since October 2023. Core PCE is at 3.4%, far above the Fed’s 2% long-term target. Institutional estimates put the year-end overall PCE year-over-year increase at 3.6%, and core PCE year over year at 3.3%. And this is a forecast made before oil prices have rebounded significantly. If oil prices hold in or further rise within the $85 to $90 per barrel range, the year-end PCE reading would likely need upward revision. Fed officials have predicted that inflation will stay elevated throughout 2026 and only ease in 2027.
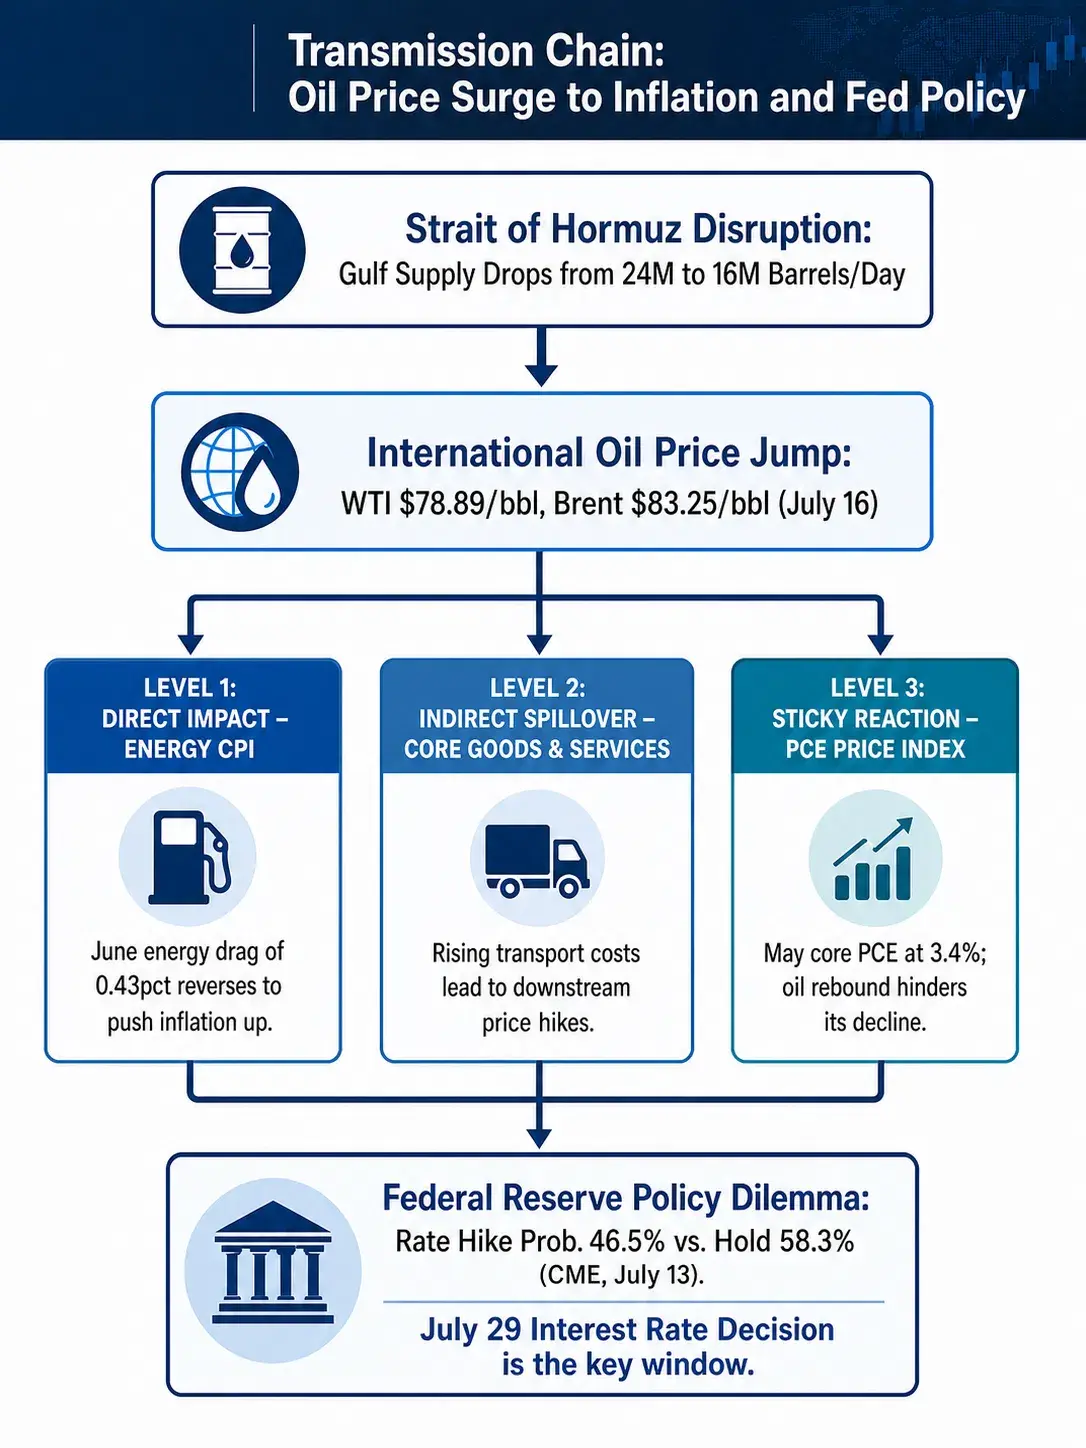
Transmission chain from rising oil prices to inflation and Fed policy
Fed policy dilemma: Misalignment between data dependence and geopolitical shocks
In testimony submitted to the House of Representatives on the day CPI data was released, Fed Chair Waller reiterated an anti-inflation stance and emphasized avoiding inflation expectations from rising. Fed Governor Christopher Waller said the central bank should not repeat the mistakes of 2021 and 2022—acting too slowly while inflation was rising. But he added that the central bank should not over-correct by hiking rates too fast.
This statement accurately summarizes the Fed’s current policy dilemma.
Rate-hike scenario: If oil prices remain above $85 per barrel, the cooling seen in June CPI would prove to be temporary. Given that core PCE is already at 3.4%, a second wave from energy prices could push overall inflation back above 4%. In this scenario, a Fed rate hike in July is not impossible—CME FedWatch shows a 46.5% probability of a hike, indicating the market is pricing in that possibility seriously.
Hold-steady scenario: In the baseline scenario, overall and core inflation in the U.S. continues to trend gradually lower. Shenwan Hongyuan believes that, considering the outlook for overall and core inflation cooling, the Fed could maintain “patience” without raising rates, and the hold-steady strategy may be sustainable through the first half of 2027. Donghai Research also said that with the U.S. labor market balanced by a simultaneous decline in supply and demand, under the baseline scenario, the likelihood of the Fed holding steady within the year remains relatively high. Morgan Asset Management also expects the Fed to keep rates unchanged in 2026 and make a single rate cut in the second half of 2027.
A third path: “Managing rate-hike expectations” between hikes and holding steady. Some analysts argue that the next 2 to 3 months could be a window of higher risk for Fed rate hikes—if oil prices rebound quickly and inflation pressure continues to transmit to downstream prices, the Fed may choose to raise rates. But given that the Fed did not choose to hike during a period when oil price pressure was greater earlier, the probability of actual rate hikes within the year remains low. A more likely Fed strategy would be to keep rates unchanged, while guiding market expectations through hawkish messaging to preserve flexibility for later policy decisions.
A dual pricing logic for U.S. Treasury yields
U.S. Treasury yields are simultaneously pricing in two forces: the easing expectations driven by the June CPI cooldown, and the renewed inflation risk driven by oil price increases. The brief drop in Treasury yields after the data release was quickly overtaken by a geopolitical risk premium.
In the short term, if oil prices continue to rise, the Treasury yield curve could become more “bear steep,” with longer-end yields rising due to higher inflation expectations, while shorter-end yields remain elevated as rate-hike expectations heat up. In the medium to long term, if the Fed chooses to hold steady and inflation stays elevated due to energy prices, real interest rates could decline passively. That would support interest-free assets such as gold, but it would mean continued erosion of purchasing power for holders of Treasuries.
Goldman Sachs’ scenario analysis provides two extreme reference points: if export recovery in the Gulf region continues to stall, Brent could break $110 in the fourth quarter; if tensions ease and production recovers faster than expected, oil prices could fall to the $60 range by year-end. These scenarios map to sharply different Fed policy paths—the first points to rate hikes and even further tightening, while the second opens room for rate cuts in 2027.
What the market is pricing right now is a middle state between these extremes: oil prices oscillating at high levels, the slope of inflation cooling flattening as it narrows, and the Fed staying patient while keeping the option of rate hikes. The June CPI data proves one thing: when energy prices fall, inflation can cool quickly. But the escalation in the U.S.-Iran conflict also proves another thing: when energy supply is threatened, this cooling can be reversed even faster.
For the Fed, the June CPI is a reassuring report, but geopolitical risks are rapidly turning that reassurance into fresh anxiety. The rate decision on July 29 will be the first observation window for how this anxiety translates into policy action.
FAQ
Q1: Why did the June U.S. CPI data come in far below market expectations?
Primarily driven by a decline in energy prices. In June, energy prices fell 5.7% month over month; this alone dragged down CPI month over month by 0.43 percentage points, basically explaining the entire month-over-month drop in CPI for the month. Core goods prices fell for two straight months, and the month-over-month growth rate of core services also fell from 0.3% to 0%.
Q2: How big is the impact of the Strait of Hormuz blockade on global crude oil supply?
The Strait of Hormuz accounts for about 20% of global seaborne oil shipment volume. Current average daily oil supply in the Gulf region has fallen from 24 million barrels before the conflict to 16 million barrels. On July 13, only 6 ships passed through the strait, down sharply from the pre-conflict average of over 100 ships per day.
Q3: How does a rise in oil prices affect the PCE inflation gauge the Fed cares about most?
Oil prices transmit to PCE through three channels: directly affecting the energy PCE component; indirectly pushing up core goods prices via transportation costs and relative-price effects; and squeezing corporate profits as energy costs rise, which then transmits to service prices. In May, core PCE had already risen to 3.4%, and an oil price rebound would make it harder for PCE to fall.
Q4: What is the current probability of the Fed raising rates in July?
As of July 16, the CME FedWatch tool shows a 10.2% probability of a 25 bps rate hike by the Fed at its July meeting, and an 89.8% probability of keeping rates unchanged.
Q5: If oil prices remain elevated, could the Fed still cut rates in 2026?
Most institutions believe the likelihood of rate cuts in 2026 is low. Morgan Asset Management expects the Fed to keep rates unchanged in 2026 and make one rate cut in the second half of 2027. Shenwan Hongyuan believes the hold-steady strategy could be sustainable through the first half of 2027. If oil prices continue to stay elevated, the time window for rate cuts would be pushed further back.