Summary
-
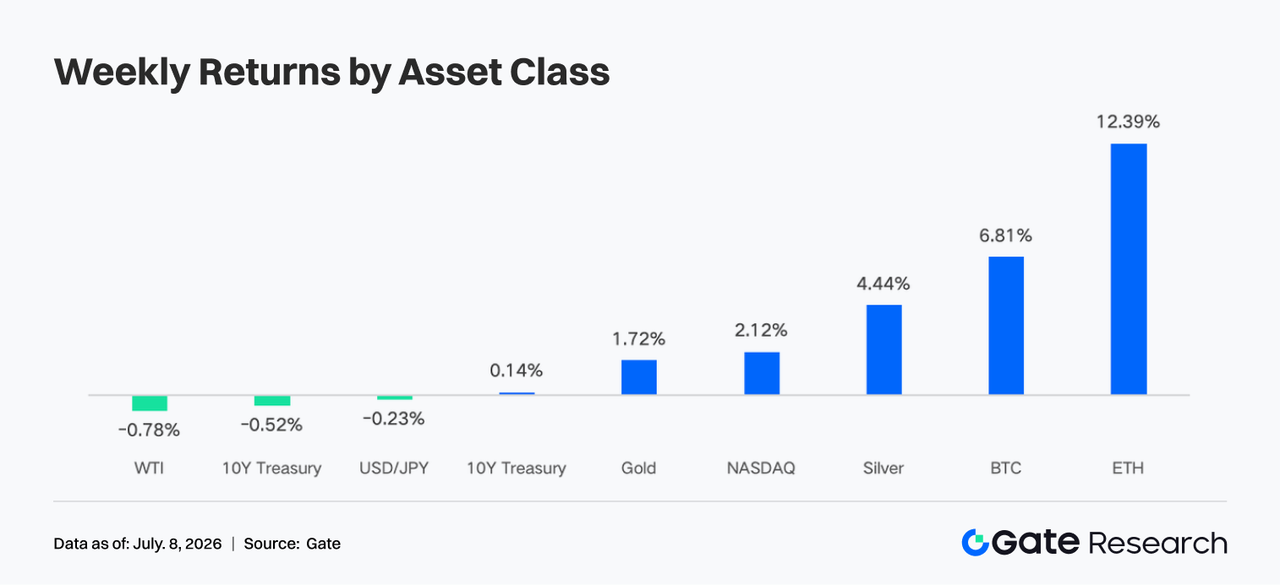
Risk appetite in the crypto market recovered, with BTC up about 6.8% for the week and ETH up about 12.2%. ETF flows remained net negative overall, but ETH ETFs were the first to see a small rebound in inflows, with institutional sentiment shifting from panic redemptions to tentative replenishment.
-
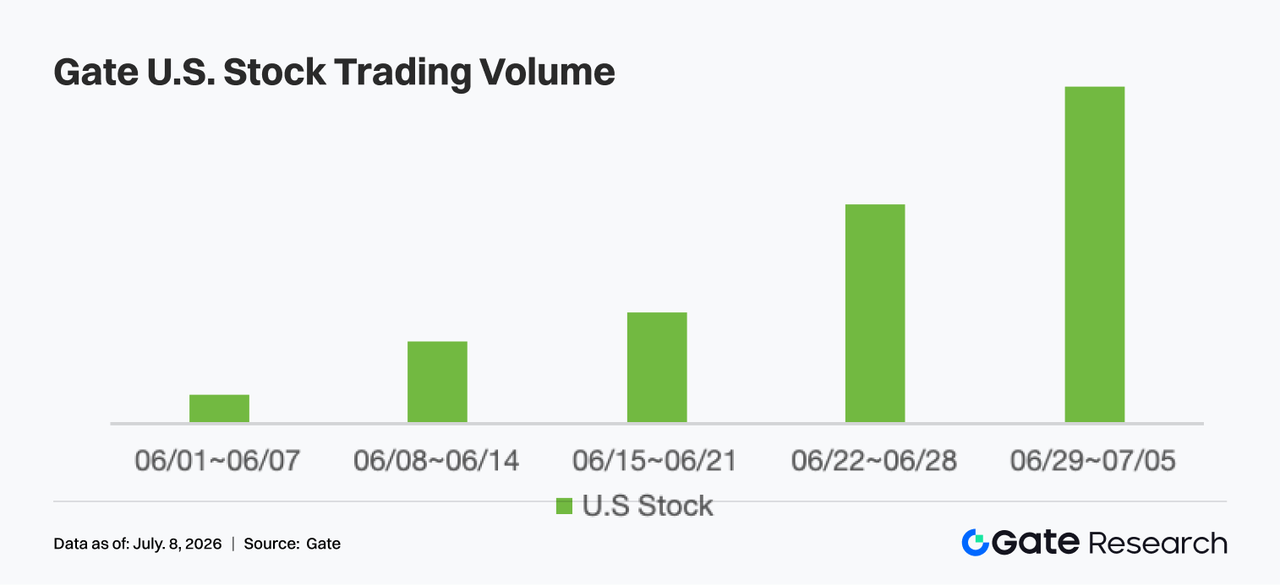
TradFi stock-related perp trading rose to around 60%–65% of volume. Gate TradFi weekly trading volume remained high at about $85 billion, with CFDs still contributing roughly 95% of turnover. U.S. stock trading volume rose for a fifth straight week and hit a new recent high.
-
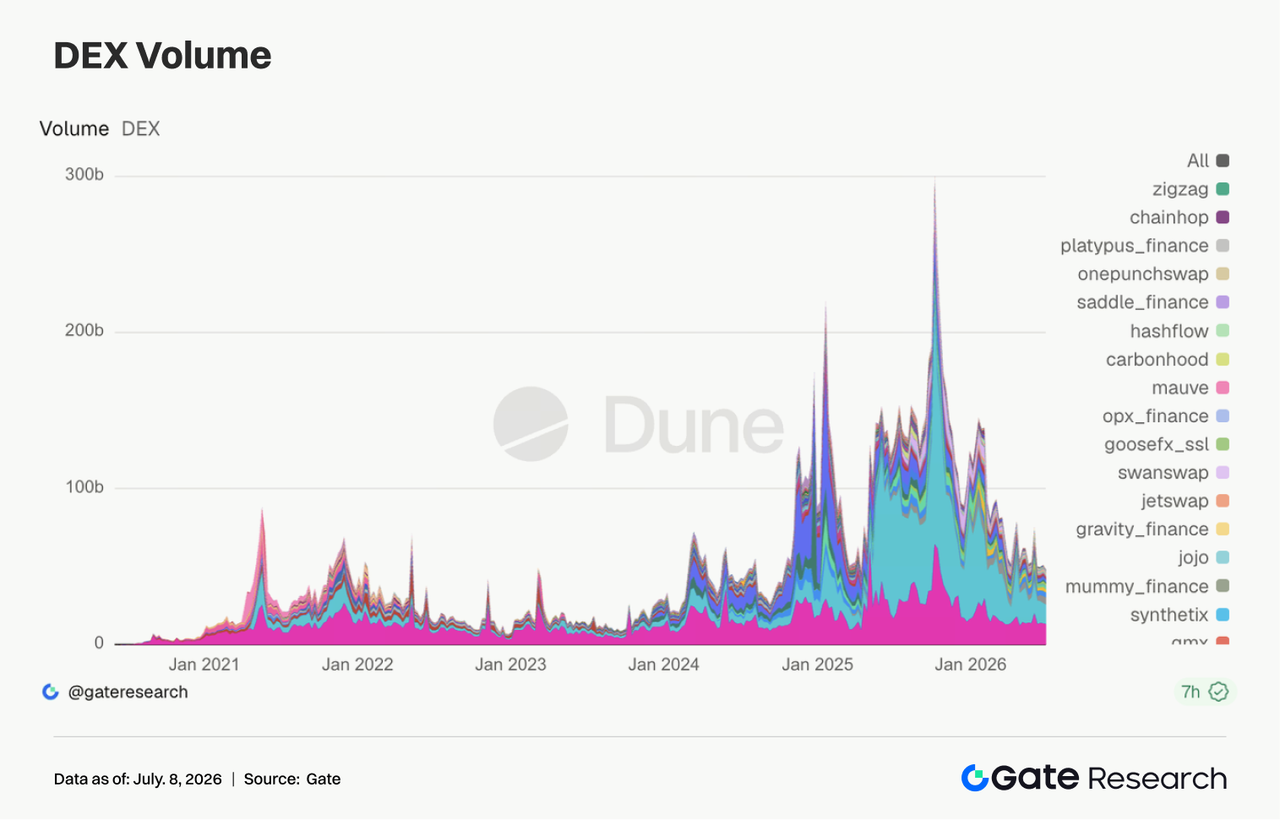
DEX trading structure continued to diverge. Uniswap and PancakeSwap volumes declined, while PumpSwap maintained strong growth, making the Solana issuance, trading, and wallet ecosystem the main source of incremental capital and protocol revenue.
-
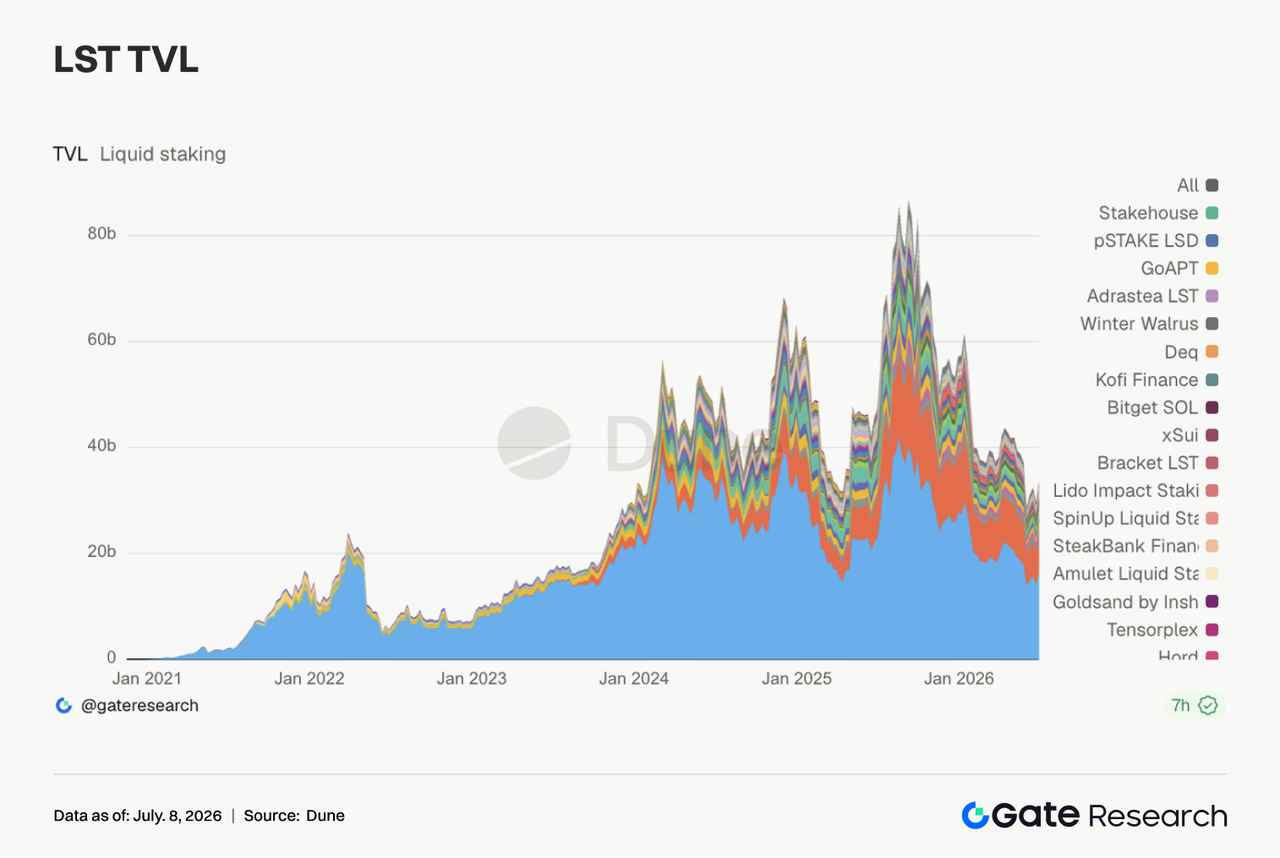
The LST sector also recovered, with staked ETH and SOL assets rebounding as risk appetite improved, while Aave lending demand reconcentrated in Ethereum’s main market.
-
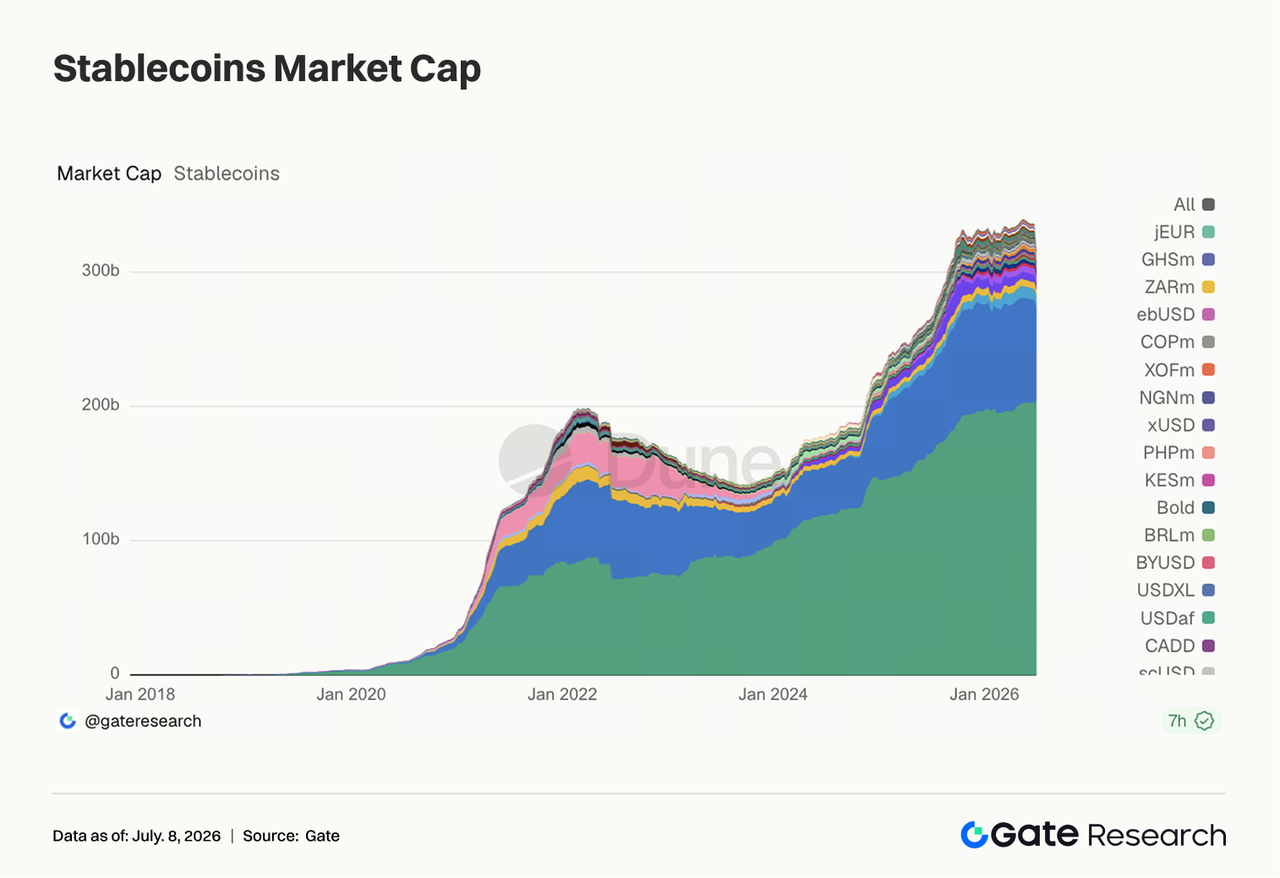
Stablecoin supply remained generally weak, but USDC continued strengthening its institutional channel with support from institutions such as BNY Mellon. Rising Aave USDC borrowing rates reflected recovering demand for high-quality dollar liquidity, while protocol revenue shifted from on-chain derivatives toward Solana traffic gateways.
-
BTC open interest rose from about $20.5 billion to $22.0 billion, while funding rates stayed positive, indicating leveraged capital was re-entering the market. Options volume also rebounded, 25D Skew recovered from deeply negative levels, and DVOL fell from 46–48 to 39–40.
-
In June, Gate platform spot and derivatives trading volumes rose 49.39% and 11.19% month-over-month, respectively. Gate institutional spot and derivatives volumes rose 17.71% and 10.70% month-over-month, respectively. In the first week of July, CrossEx trading volume rose 26% week-over-week.
1. Market Focus Analysis
Last week (June 29 to July 5, 2026), the main theme in global markets was jointly driven by cooling U.S. employment, declining rate expectations, and a recovery in risk appetite. U.S. nonfarm payrolls for June increased by 57,000, below market expectations of about 115,000, while April and May figures were revised down by a combined 74,000. The unemployment rate edged down from 4.3% to 4.2%, though this was mainly due to a decline in labor-force participation.
After the data release, market concern over the Fed continuing to raise rates in July eased. Following intraweek volatility, the 10-year U.S. Treasury yield closed around 4.4477%, while the 2-year yield fell back to about 4.13%, indicating marginal relief in rate pressure. U.S. equities moved broadly higher during the holiday-shortened trading week: the Dow rose about 2.0%, the S&P 500 gained about 1.8%, and the Nasdaq rose about 2.1%. However, AI and semiconductor sectors showed rotational pressure, suggesting that capital was not chasing high-valuation growth stocks in a one-way manner, but was instead repricing risk assets under a mix of “slowing growth but no further hawkish shift in policy.” In commodities, oil prices fluctuated between Middle East risk premiums and expectations of higher OPEC+ output, with WTI crude at one point hovering near $70. Gold remained elevated, reflecting that inflation and geopolitical risks have not fully faded. The crypto market benefited from lower Treasury yields, easing dollar liquidity pressure, and improved U.S. equity risk appetite, with both BTC and ETH strengthening during the week. ETH showed greater elasticity, indicating that capital was rotating from defensive BTC allocations into higher-beta assets.
2. Liquidity Analysis
2.1 ETFs remained in a clear net outflow state, with BTC ETFs posting about $1.787 billion in net weekly outflows
On the ETF side, spot BTC ETFs remained in a clear net outflow state last week. U.S. spot BTC ETFs saw net weekly outflows of about $1.787 billion, extending the heavy redemption pressure seen in June. However, on July 2, there was a single-day net inflow of $221.72 million, ending the previous streak of roughly 10 trading days and about $2.73 billion in cumulative outflows. In AUM terms, total net assets of spot BTC ETFs rose from about $72.818 billion on June 26 to $74.369 billion on July 2, an increase of about $1.551 billion, mainly because BTC’s price rebound offset net redemptions. At the product level, the largest inflow on July 2 went to Fidelity’s FBTC, at about $166 million, followed by ARKB at about $91.84 million. The most notable outflow came from BlackRock’s IBIT, which saw about $40.43 million in single-day outflows and remained in an ongoing outflow narrative.
Pressure on spot ETH ETFs was clearly lower than on BTC. Aggregated public daily-frequency data showed net outflows of about $13.65 million from June 29 to July 2, including outflows of about $30.04 million and $27.6 million on June 29 and June 30, respectively, before turning into inflows of about $14.89 million and $29.08 million on July 1 and July 2. AUM rose from about $8.594 billion on June 29 to about $9.020 billion on July 2, an increase of about $426 million, driven more by ETH’s price rebound and modest capital replenishment. At the product level, ETHA ranked among the top inflow leaders on both July 1 and July 2, with about $29.74 million of inflows on July 2, while products such as ETHE / ETHB bore most of the redemption pressure during the week.
Overall, institutional sentiment has not turned fully bullish, but has shifted from panic redemptions to tentative replenishment. BTC still needs IBIT inflows to resume in order to confirm the trend, while ETH is showing small-scale capital returning from the lows.
2.2 TradFi Liquidity
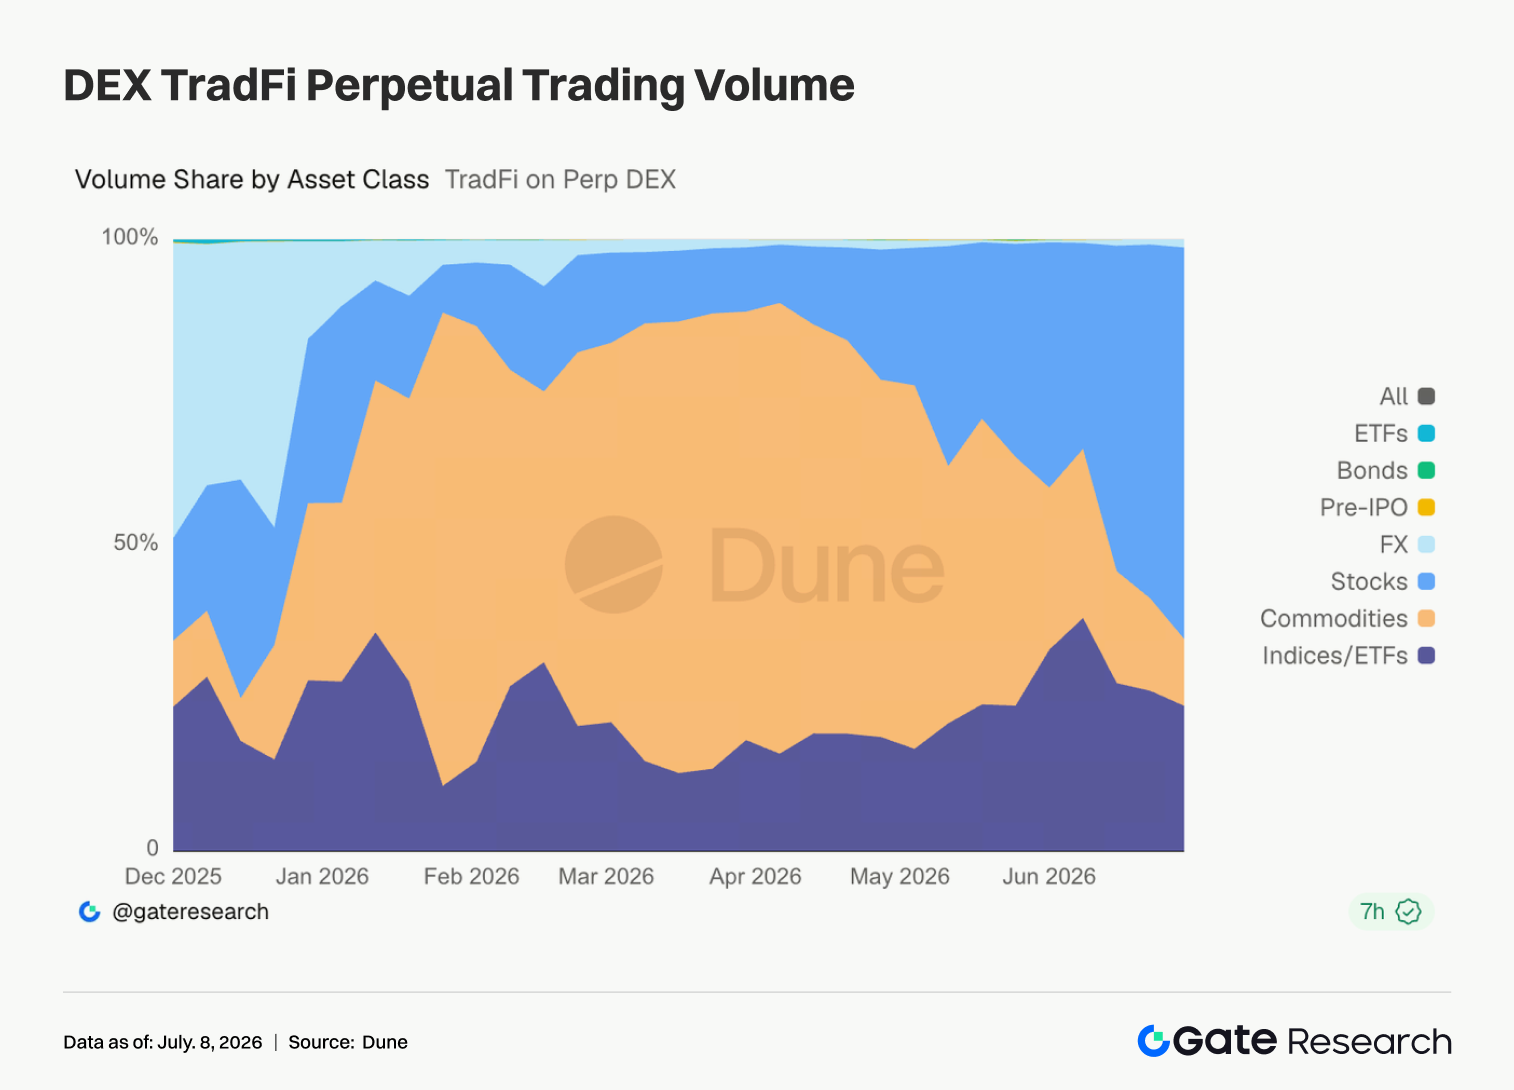
- TradFi Perp DEX: Over the past week, the trading structure of TradFi Perp DEXs continued to concentrate in equity assets. Equity perpetuals quickly rose to about 60%–65% of trading volume, once again becoming the clear market leader. Commodity contracts, which had previously dominated, continued to fall to around 10%–15%, indicating cooling interest in safe-haven trades such as gold and crude oil. Meanwhile, index/ETF contracts remained stable at around 20%. Other asset classes such as FX, bonds, Pre-IPO, and ETFs continued to account for a relatively low share of volume and made only limited contributions overall, as capital continued concentrating in highly liquid equity products.
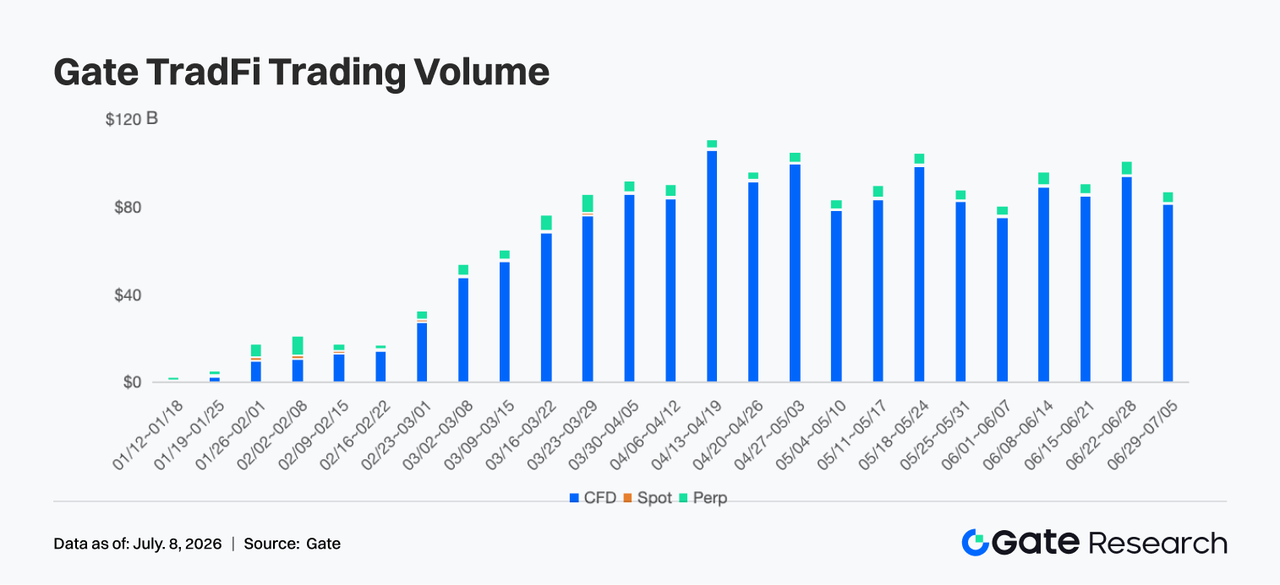
- Gate TradFi trading volume: Over the past week, Gate TradFi total trading volume was about $85 billion, down roughly 13%–15% week-over-week. Total volume last week was close to $98 billion, a recent high. This week it fell back to about $85 billion, but remained above late-May and early-June levels, showing that overall trading activity stayed stable. CFDs remained the absolute core business. CFD trading volume was about $81 billion, accounting for roughly 95% of total trading volume. Although lower than the previous week, it still contributed the overwhelming majority of turnover and remained the main source of growth in Gate TradFi’s product system. Perps remained resilient. Perp trading volume stayed in the $400 million to $500 million range, accounting for about 5%, with little overall change, suggesting that derivatives trading demand remained steady even as market volatility moderated.
- Gate U.S. stock asset trading volume: Gate officially launched its U.S. stock trading service on June 2. Supported by advantages including real underlying asset backing, direct trading with USDT, no overnight holding fees, and high liquidity, Gate’s U.S. stock trading volume continued to grow rapidly over the past week, reaching a new recent high and rising further from the previous week, extending a five-week growth streak since early June. As features such as U.S. stock trading, pre-market and after-hours trading, web access, and 24/7 trading continued to go live, user participation kept rising. At the same time, weaker U.S. employment data boosted market risk appetite and equity turnover, further supporting growth in the platform’s U.S. stock trading volume and reflecting that Gate’s global equities business is entering an accelerated expansion phase.
- TradFi order book depth: We selected XAUT, the highest-volume TradFi product, to analyze its order book depth (Delta). Over the past week, green Delta bars clearly outnumbered red ones, especially on July 1, 3, and 6, when there were multiple net increases in buy-side liquidity of $500,000 to $800,000, showing that market makers continued replenishing bids and that market absorption capacity remained strong. XAUT’s price rose from about $4,000 to the $4,160–$4,180 range, while buy-side depth in the order book increased in parallel, indicating that the rise was more supported by real liquidity than by short-term price pulling under thin depth. Although there were some negative Delta readings of $200,000 to $500,000 between July 2 and July 5, they were short-lived and did not form a continuous liquidity withdrawal, so their impact on price was limited. Overall, the latest large buy-side injections suggest that strong liquidity support has formed around $4,150. If macro safe-haven sentiment continues in the short term, XAUT’s depth structure should remain supportive of price strength.
3. On-Chain Data Insights
3.1 Leading DEX spot activity continued cooling, while PumpSwap brought Solana speculative traffic back into focus
This week, the main structure of DEX trading continued to rotate. Uniswap and PancakeSwap held the top two spots, but their volumes edged down from the previous week, with no clear expansion in turnover among mainstream spot pools. PumpSwap, by contrast, continued rising, with both trading volume and user count staying high, as Solana speculative traffic shifted toward platforms integrating issuance and secondary trading. Meteora also showed some recovery, but more mature liquidity venues such as Raydium, Curve, and Aerodrome remained relatively flat, meaning capital did not produce a broad cross-chain rally.
3.2 Stablecoin supply remained generally weak, but USDC’s institutional channel kept opening up
Stablecoin supply continued to contract slightly this week. Most major assets, including USDT, USDC, USDS, USD1, and USDe, edged lower, and there was no large-scale new dollar inflow on-chain. Relatively bright spots were some expansion in PYUSD and relative stability in DAI, reflecting small-scale capital reallocation between regulatory and yield narratives. This week, BNY Mellon announced support for custody, transfers, minting, and burning of USDC on its digital asset platform, which is a substantive positive for USDC’s institutional channel. At the same time, support from BlackRock, Google, Coinbase, and others for Open USD also indicates that stablecoin competition is shifting toward embedded payments, custody, settlement, and institutional wallets. However, opposition from community banks to stablecoin legislation is still intensifying, and regulatory resistance has not disappeared.
3.3 The LST sector clearly recovered from last week’s pullback, with ETH and SOL staking assets rebounding together
This week, the LST sector rebounded clearly. ETH-side protocols such as Lido, Rocket Pool, and StakeWise all recovered from last week’s lows. SOL-side assets showed similarly strong elasticity, with Jito, Sanctum, and Jupiter Staked SOL all rebounding to varying degrees. Since TVL is dollar-denominated, this recovery was related to the rebound in ETH and SOL prices, but it also shows that the prior week’s position reductions did not evolve into sustained redemption pressure. After the KelpDAO/rsETH incident, institutions still appear to prefer LSTs with stronger safety and clearer pathways. The risk premium between standard LSTs and cross-chain wrapped assets has already diverged. Overall, this week’s LST recovery was jointly driven by valuation repair and improving risk appetite.
3.4 Aave lending balances were lifted by Ethereum’s main market, though the multi-chain structure remained differentiated
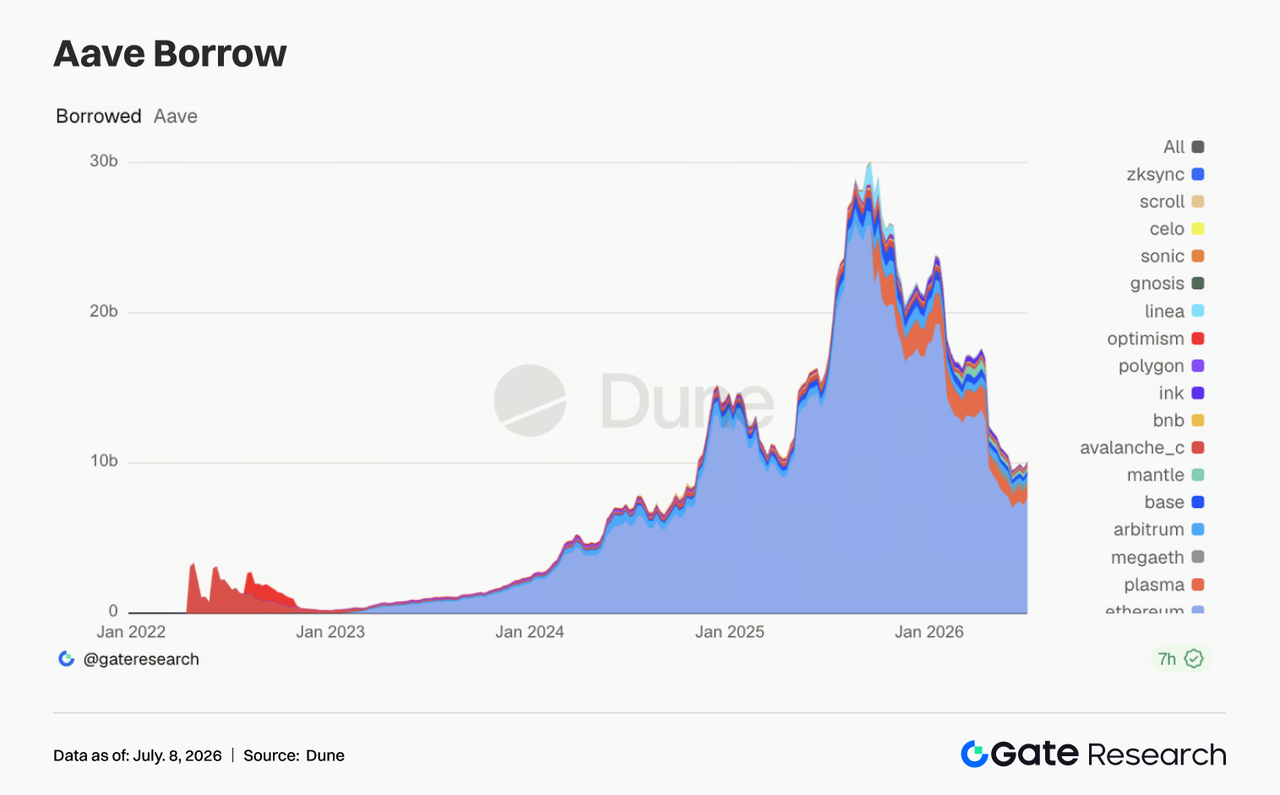
Aave lending balances recovered this week, with most of the increase coming from Ethereum’s main market. As risk appetite recovered, capital still preferred returning first to the core market with the strongest liquidation depth and collateral quality. Some markets such as Arbitrum, Base, Mantle, and Ink also improved slightly, but Plasma and MegaETH continued to decline, suggesting that the earlier pace of new-market expansion has slowed. This structure is consistent with the risk-recovery logic of recent weeks: Aave has not lost lending demand, but capital is becoming more selective about chains, collateral, and risk-control parameters.
3.5 Aave core asset lending rates diverged again, with financing pressure in USDC clearly rising
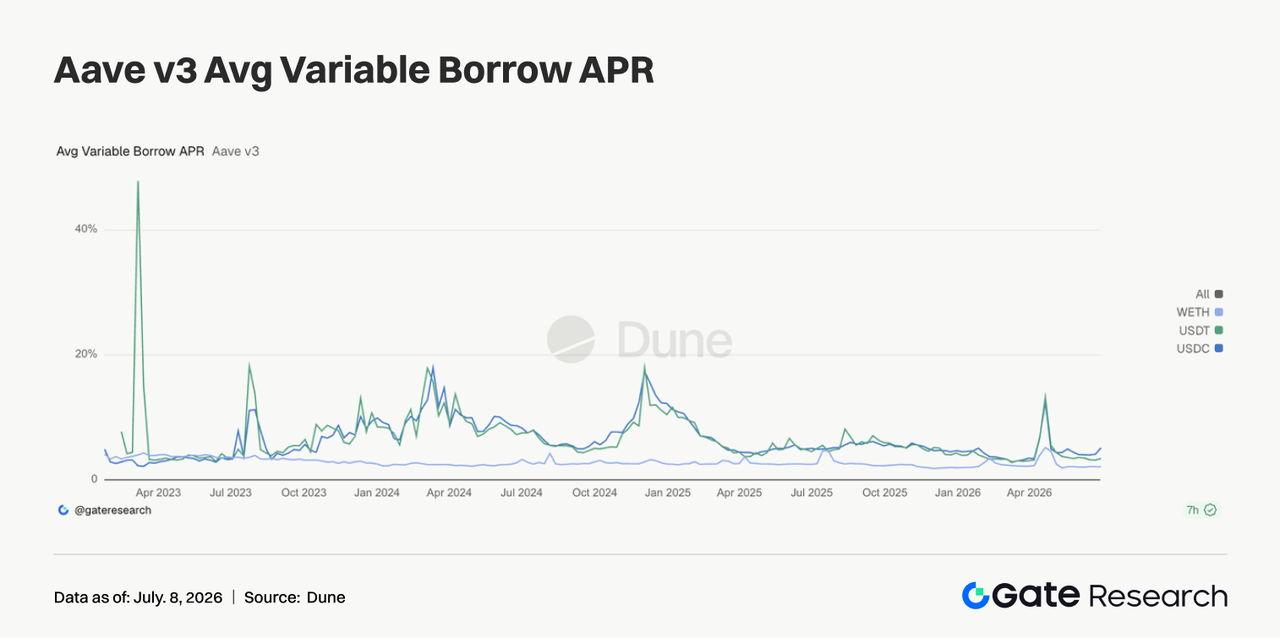
Aave’s three core asset rates showed fresh divergence this week. USDC’s average borrowing cost rose clearly, USDT edged higher, while WETH remained basically at low levels. USDC still saw brief spikes to higher rates during the week, indicating that the core dollar pool remains sensitive to changes in utilization. By contrast, WETH rates did not rise in tandem, suggesting that directional ETH leverage has not become crowded. This combination typically corresponds to recovering institutional demand for stablecoin turnover, arbitrage, and collateral management. Aave community discussions about increasing USDC liquidity buffers had practical relevance in this week’s data. The conclusion from the rate side is clear: market risk appetite has improved, but the first thing to become more expensive is still high-quality dollar liquidity.
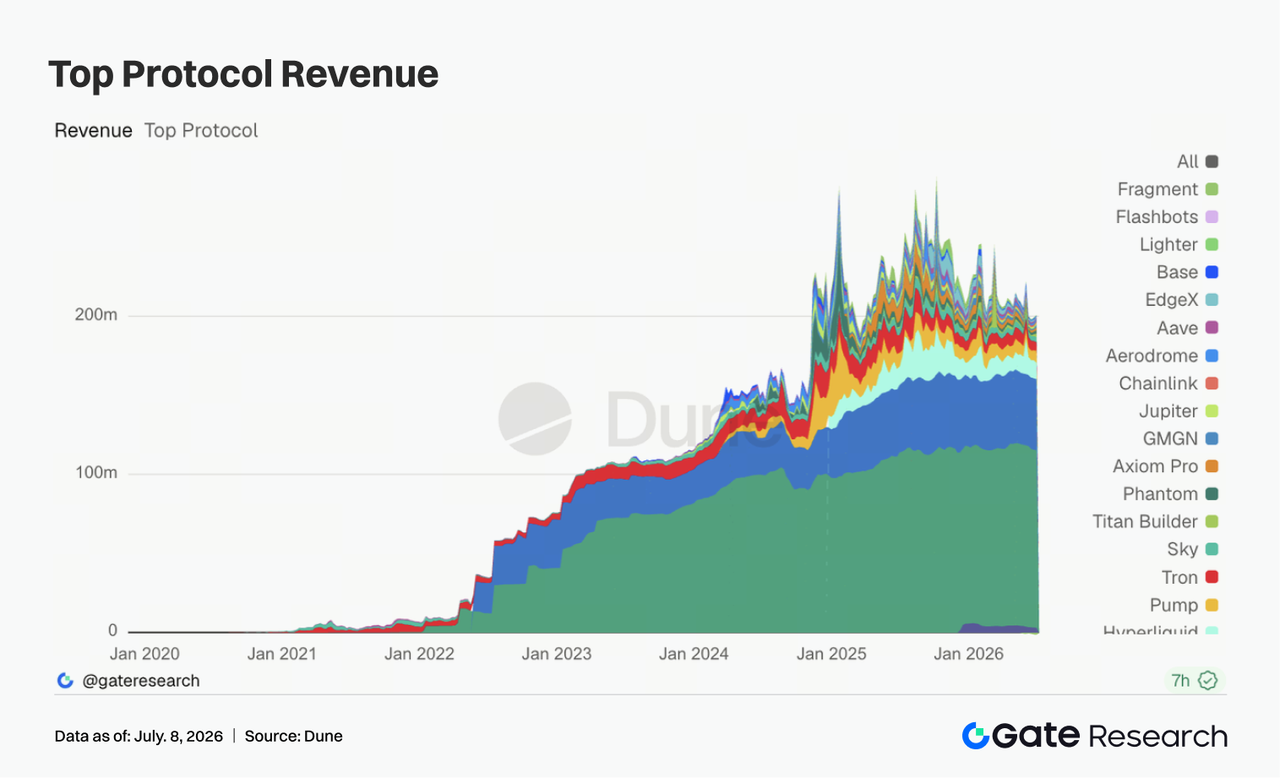
The structure of protocol revenue changed clearly this week. Tether and Circle remained the most stable cash-flow foundations, but the main growth elasticity came from Solana traffic gateways such as Pump.fun, PumpSwap, Axiom, and Phantom. Hyperliquid Perps revenue declined from the previous week; enthusiasm for on-chain perpetuals and equity index/pre-IPO trading cooled from earlier highs, though it still remains one of the highest-revenue on-chain derivatives protocols. Titan Builder revenue continued improving, reflecting that order-flow and MEV-related infrastructure still has strong cyclical elasticity. Aave V3 revenue declined slightly, matching the divergence in lending rate structure and the uneven recovery in total balances. Combined with DEX data, both the revenue side and the trading side point to the same main theme this week: mainstream spot platforms stabilized the base, while true marginal elasticity came from Solana issuance, wallets, and high-frequency trading front ends. Stablecoin issuers provide stable cash flow, while trading infrastructure and traffic gateways provide short-term elasticity.
4. Derivatives Tracking
4.1 BTC price recovered from lower levels, while rising OI showed leveraged capital re-entering
Last week, BTC first weakened and then strengthened. At the start of the week, the price was still fluctuating near $60,000, briefly dipping toward $59,000 around June 30 before gradually recovering and rebounding into the $63,000–$64,000 range from July 3 to July 5. Overall, the price shifted from the weakness of the previous week into a rebound from lower levels, though it has not fully broken out of the range-bound structure.
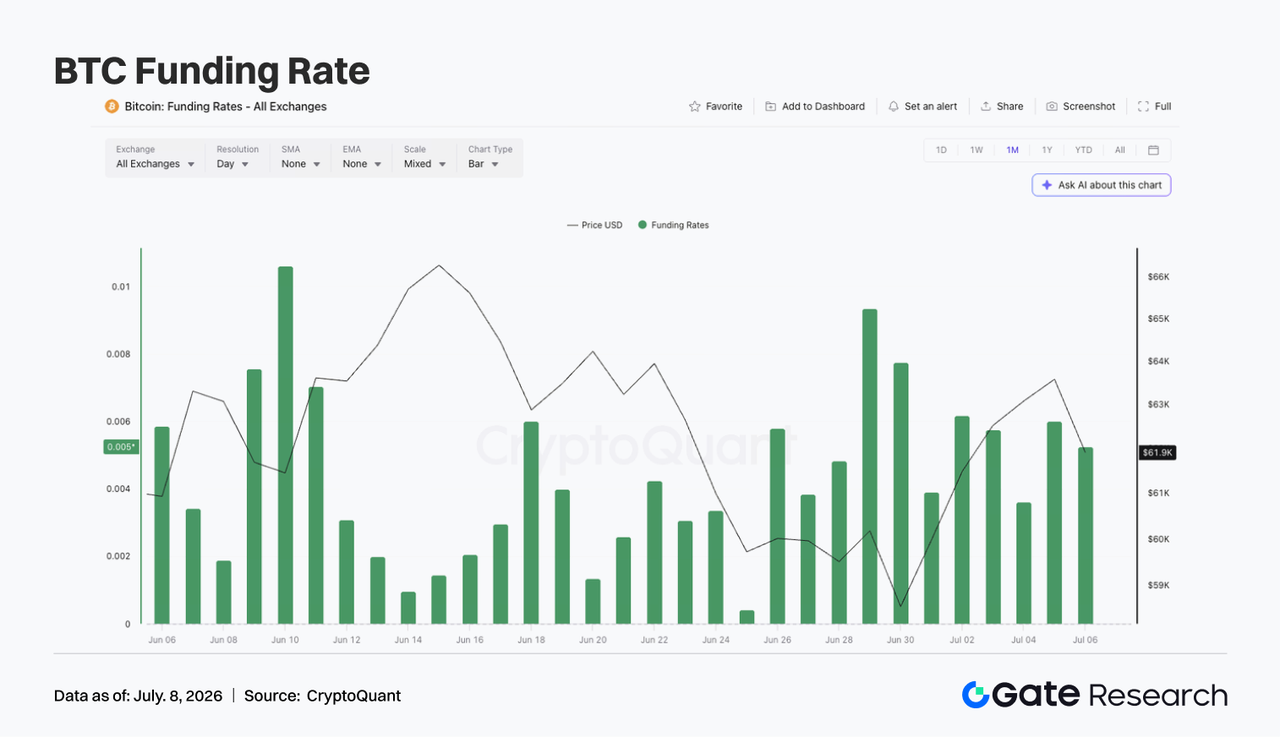
As for open interest, there was a clear rebound this week. OI was about $20.5 billion around June 29, then gradually rose back to around $21.9 billion to $22.0 billion from July 3 to July 5. The combination of price rebound and rising OI indicates that leveraged capital is re-entering the market, with new positions providing some support for this recovery. Funding rates stayed positive throughout the week, mostly in the 0.003 to 0.006 range, showing that bullish sentiment remained dominant. Compared with prior periods of extremely elevated funding, rates did not visibly get out of control this week, but against the backdrop of a fresh price recovery, persistently positive funding still means the market has already re-accumulated some long exposure.
Overall, BTC derivatives shifted this week from “defensive positioning at low levels” to “mild leveraged recovery.” If price can hold above $63,000, the rebound in OI could help extend the rally. But if BTC falls back toward $60,000 again, newly added long positions may once again face deleveraging pressure.
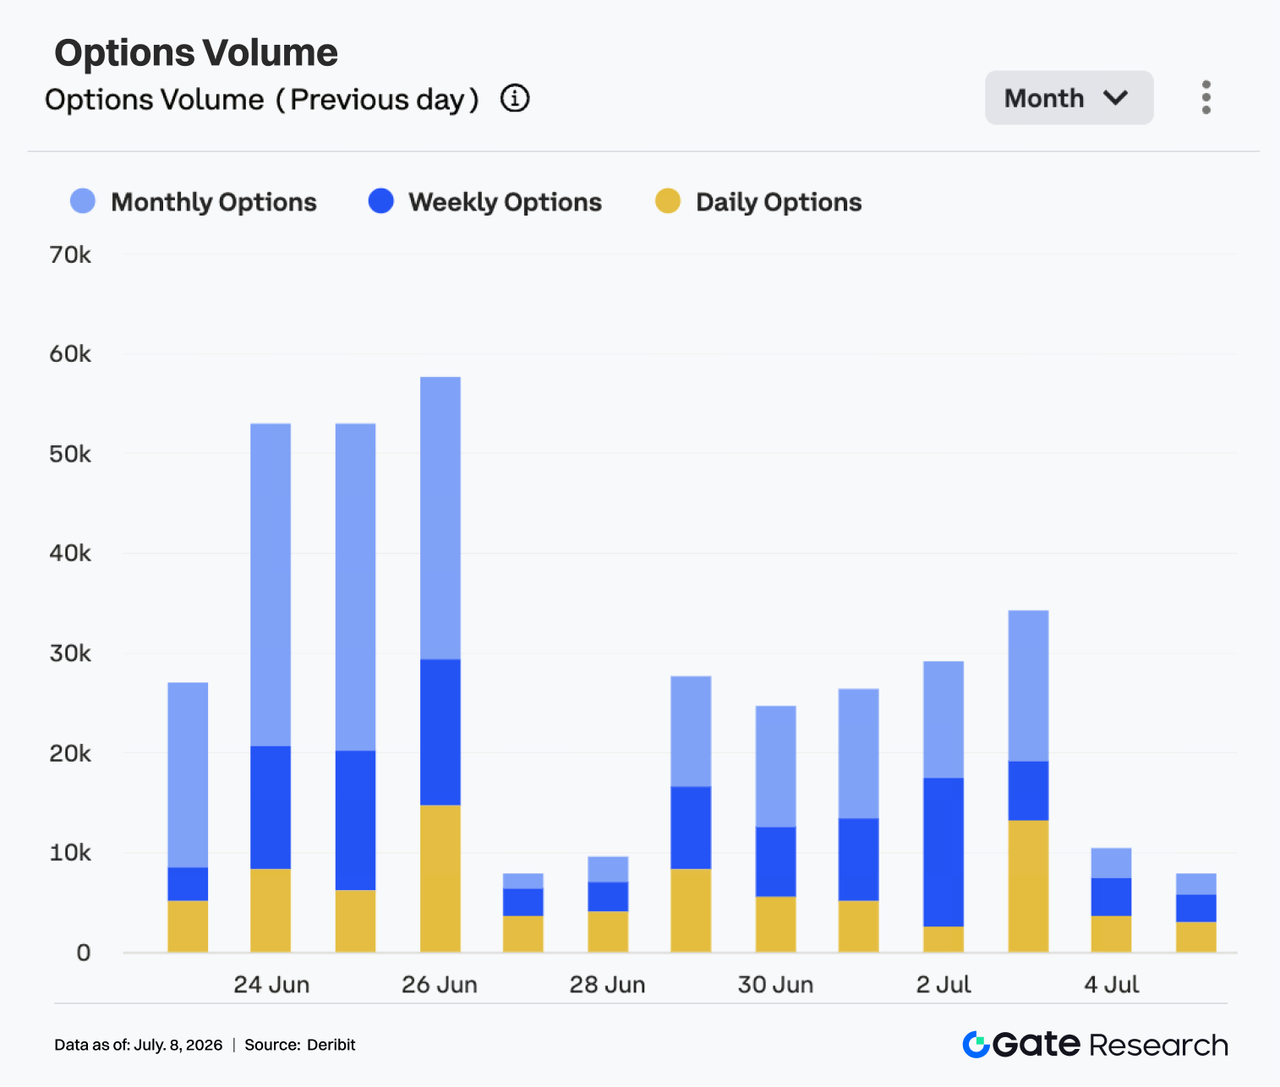
4.2 Options volume stayed steady first, then rose, while monthly contracts continued to dominate the trading structure
The options market remained quite active last week. From June 29 to July 1, BTC options volume mostly held in the 24,000 to 27,000 contract range, remaining relatively stable overall. From July 2 to July 3, volume expanded further and climbed to about 34,000 contracts around July 3, the weekly high.
Structurally, monthly options remained the main source of volume, indicating that market participants continued using longer-dated contracts for directional positioning and risk management. Weekly options volume also remained steady, reflecting ongoing short-term trading demand during the rebound. By contrast, daily options saw some pickup on certain trading days, but did not become dominant overall. Weekend volume dropped clearly, falling to about 8,000 to 10,000 contracts from July 4 to July 5, indicating that short-term trading enthusiasm cooled after the price rebound. Overall, the options market this week did not show panic-style volume expansion, but instead displayed a structure of “price recovery + monthly-contract dominance + weekend cooling.”
From a trading-behavior perspective, options activity reflected more position adjustment after the rebound than one-way chasing. If BTC continues holding above $63,000, options volume may remain moderately active; if price falls back below $60,000, protective demand may once again push volume higher.
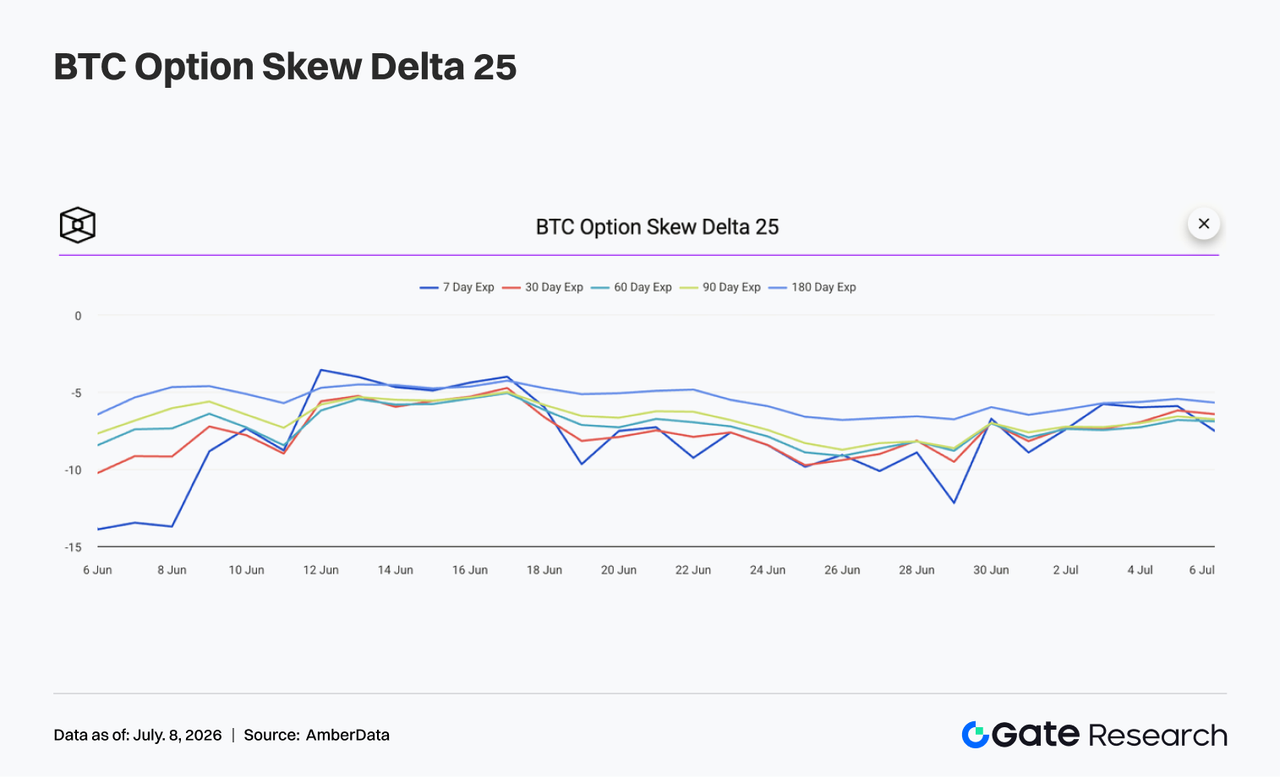
4.3 25D Skew recovered from deeply negative levels, but downside protection demand has not disappeared
From the 25D Skew curve, BTC skew across maturities showed an overall recovery trend last week. At the start of the week, 7D Skew briefly sat in deeply negative territory, close to -12, indicating that short-dated downside protection demand remained strong and that the market was still wary of BTC falling back below $60,000.
As BTC gradually rebounded, short-dated skew recovered quickly. After June 30, 7D Skew rose back to around the -6 to -7 range, sharply narrowing the gap with other maturities and indicating that the earlier concentrated defensive buying in the front end had eased. Medium- and long-dated skew also recovered, but remained negative overall. 30D, 60D, 90D, and 180D Skew mostly traded around -6 to -7, indicating that while the market is no longer extremely pessimistic, it is still paying a certain premium for downside risk.
Overall, skew moved this week from an extreme defensive state back to a relatively balanced but still negative range. If BTC can continue holding above $63,000, short-dated skew may keep recovering. If price falls back below $60,000, protective demand may heat up again.
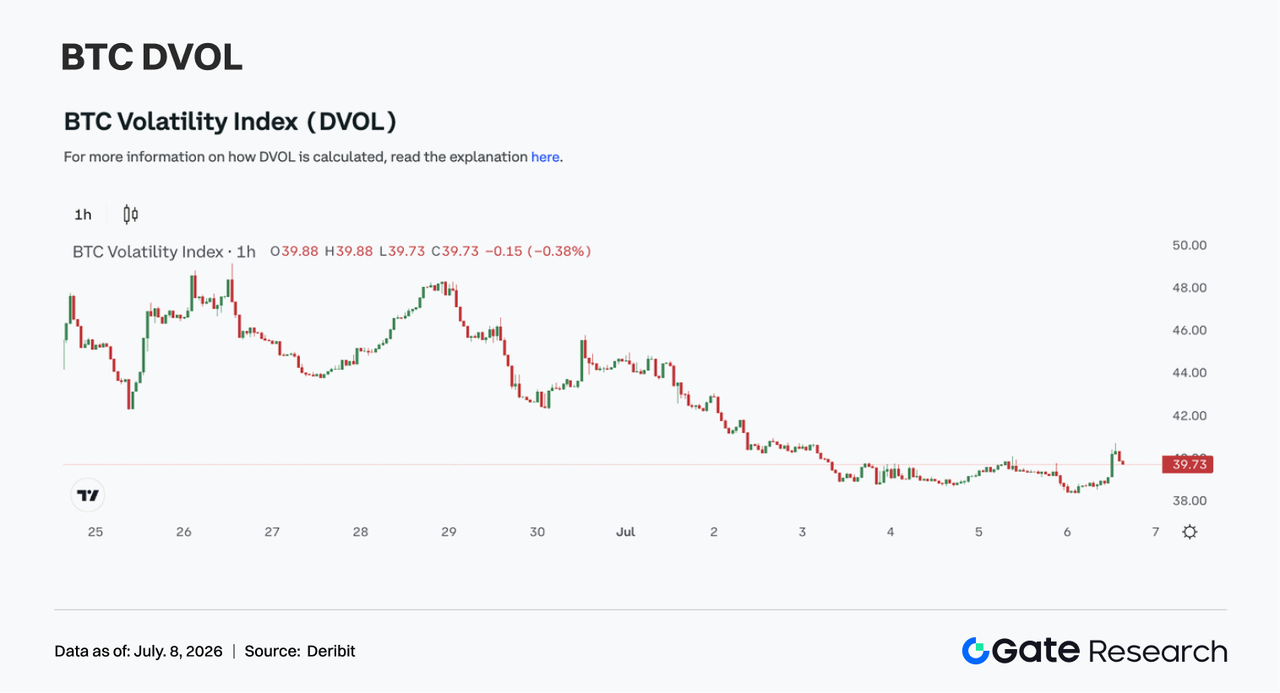
4.4 DVOL fell clearly as market volatility expectations cooled along with price recovery
In terms of volatility, BTC’s volatility index DVOL declined overall last week. At the start of the week, DVOL was still around 46 to 48, reflecting that the risk premium brought by the previous week’s price dip and protective demand had not fully faded.
After entering July, as BTC gradually recovered and skew rebounded from deeply negative levels, DVOL began to decline clearly. From July 3 to July 5, DVOL fell back to around 39 to 40, significantly lower than at the start of the week, showing that market pricing for future sharp volatility cooled noticeably. This decline in DVOL is not inconsistent with the rebound in OI and price, indicating that the market currently leans more toward a mild recovery than a high-volatility breakout. The options market also did not see persistent panic buying of protection, further confirming that volatility premium is being released.
Overall, BTC is currently in a combined state of “price recovery + lower volatility + mildly negative skew.” If price continues fluctuating in the $62,000 to $64,000 range, DVOL may remain low. If price breaks upward or falls back below $60,000, volatility may expand again.
5. Outlook for This Week
6. Gate Institutional Updates
- Trading performance remained resilient, with BTC and ETH spot continuing to lead the market
-
Platform spot trading volume in June rose 49.39% month-over-month, significantly above the average level of major exchanges.
-
BTC and ETH spot trading performance continued to lead the market, with BTC trading volume up 95.42% month-over-month and ETH up 72.50%, both ranking among the top major trading platforms. Spot trading activity in smaller-cap tokens also continued improving, overall maintaining growth in line with the market.
-
Platform derivatives trading volume rose 11.19% month-over-month, while institutional spot and derivatives volumes rose 17.71% and 10.70% month-over-month, respectively, with the trading structure continuing to improve.
-
Multiple global quantitative, market-making, and high-frequency trading institutions continued advancing integration, and institutional-grade trading demand remained active.
- The CrossEx ecosystem continued expanding, with Q2 trading scale hitting a new high
-
CrossEx cumulative trading volume and cumulative capital scale in Q2 both maintained rapid growth, continuing to break historical highs.
-
In the first week of July, CrossEx trading volume rose 26% week-over-week, with institutional capital continuing to flow in.
- Institutional products and capital services continued upgrading
-
Capital solutions such as large-size interest-free lending and OTC Loan continued to be upgraded, meeting diversified institutional funding needs.
-
Multiple leading institutions applied for institutional-grade products such as RPI, Colo, GMCC, and OTC Loan, with penetration of professional trading services continuing to improve.
-
The lending business maintained steady growth, with new institutional clients continuing to go live, further improving institutional capital efficiency.
- Technical infrastructure continued to improve
-
WebSocket, REST API, and trading-path performance continued to be optimized, further reducing order-processing and market-data push latency.
-
The 3.0 trading architecture continued advancing, with重点 optimization focused on high-frequency tail latency and system stability.
-
The AI customer service bot continued to be upgraded, with base-level issue resolution accuracy remaining above 85%.
-
Third-party infrastructure such as Fireblocks and Copper continued to improve, with further gains in automation capabilities and a better institutional onboarding experience.
Data Sources:
Gate Research is a comprehensive blockchain and cryptocurrency research platform that provides deep content for readers, including technical analysis, market insights, industry research, trend forecasting, and macroeconomic policy analysis.
Disclaimer
Investing in cryptocurrency markets involves high risk. Users are advised to conduct their own research and fully understand the nature of the assets and products before making any investment decisions. Gate is not responsible for any losses or damages arising from such decisions.