北辰DZHTHWD

vip
Peak Tier 0
Market Analyst
On-chain Analyst
No content yet
1/4 Comprehensive Heatmap Analysis Viewpoint:
Currently at 3147, holding above the multi-cycle moving averages, indicating a short-term bullish structure. Key technical indicators are resonating positively, combined with increasing price and volume, with momentum continuing. Attention should be paid to resistance around 3170; if a breakout occurs with volume support, further upward space may open. In the short term, the bullish/bearish boundary can be observed at 3115.
BTC:
Downward support levels to watch: primary support around 90600, secondary support near 89400. If the downward momen
BTC1,38%
ETH0,93%
View Original
post-image
  • Reward
  • Comment
  • Repost
  • Share
Today's ETH trading strategy:
Short ETH at 3043
Stop loss at 3072 with 50%
If volume breaks through 3100, then stop loss at 3108 with 50%
Take profit at 2939 with 70%
Take profit at 2673 with 30%
ETH0,93%
View Original
post-image
  • Reward
  • Comment
  • Repost
  • Share
ETH Trading Strategy for Today
Short at 2983
Stop loss at 3036
Take profit at 2913 with 50%, keep 50% to break even.
ETH0,93%
View Original
post-image
  • Reward
  • Comment
  • Repost
  • Share
Today we will discuss trend lines
1: How to draw a good trend line? Trend lines are one of the basic skills for trend traders. How to correctly draw a trend line? First, understand the essence of trend lines. For example: (Figure 1) When an uptrend forms, the lows keep getting higher, and the highs also keep getting higher, i.e., higher highs and higher lows. Conversely, a downtrend (Figure 2) shows that the highs keep decreasing, and the lows are also decreasing. Therefore, the essence of a trend line is to track the changes in high and low points over a certain period.
2: What are the condit
View Original
post-image
post-image
post-image
  • Reward
  • 1
  • Repost
  • Share
PIZHFvip:
First have a wonderful wish, then achieve it step by step. Hahaha
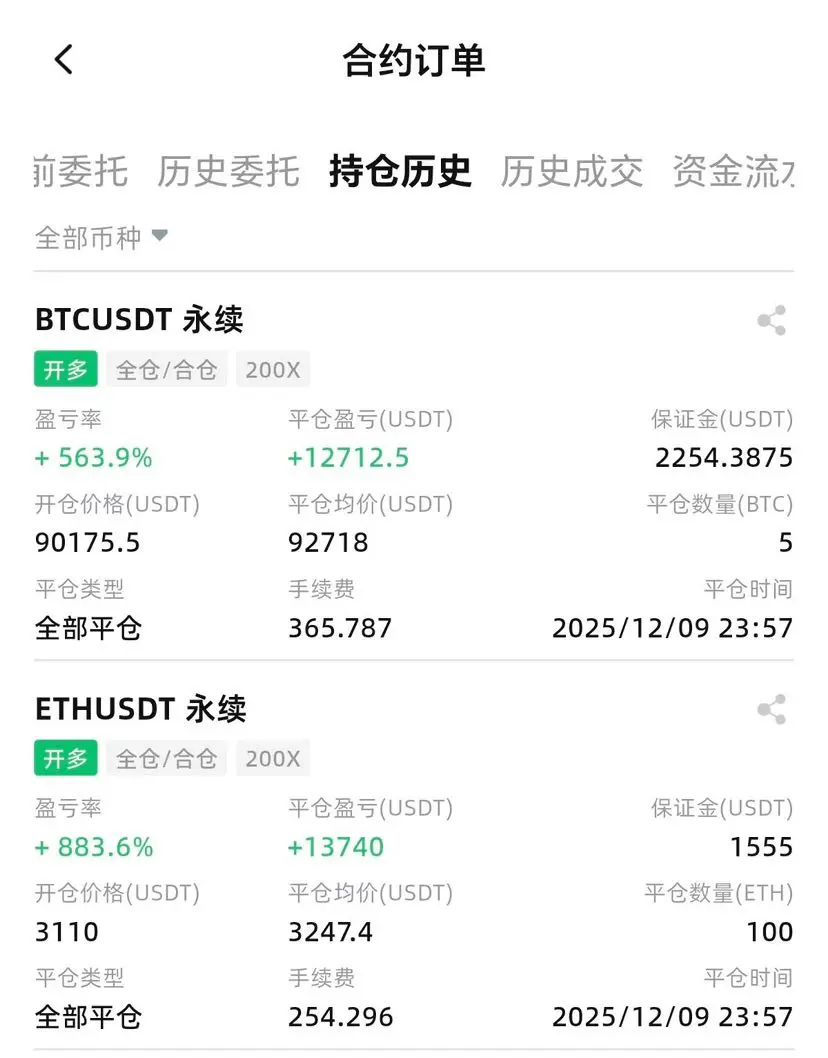
12.23 Bitcoin Ethereum evening strategy!
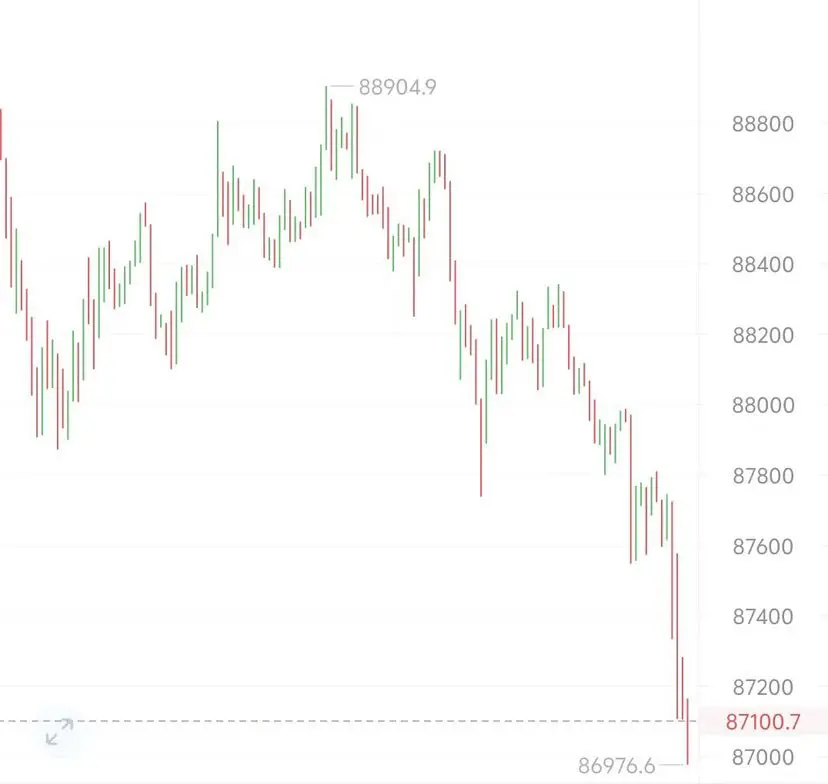
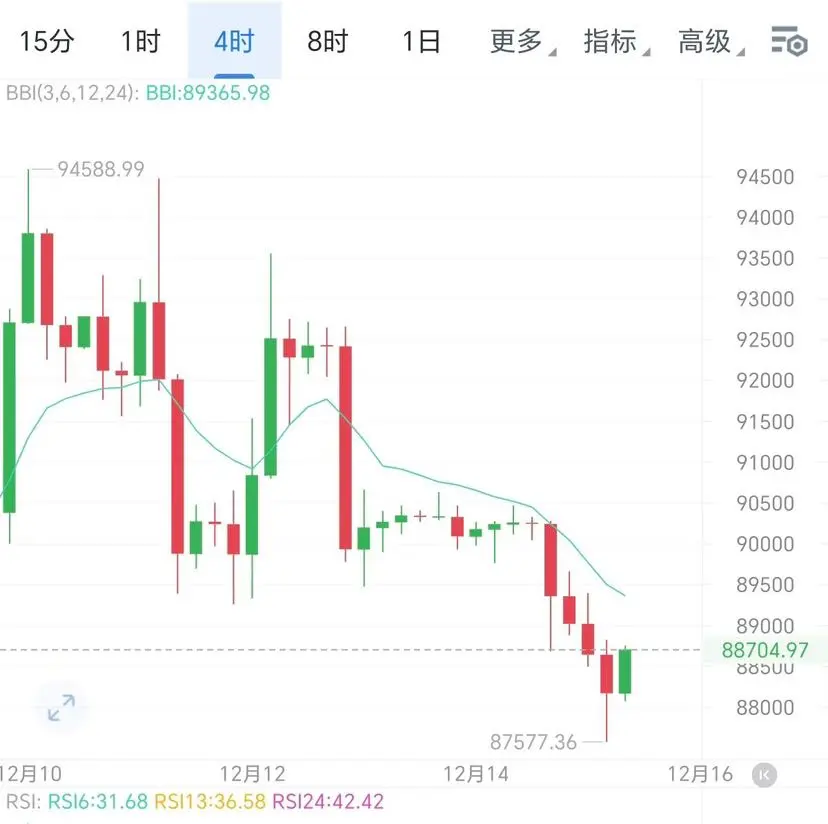
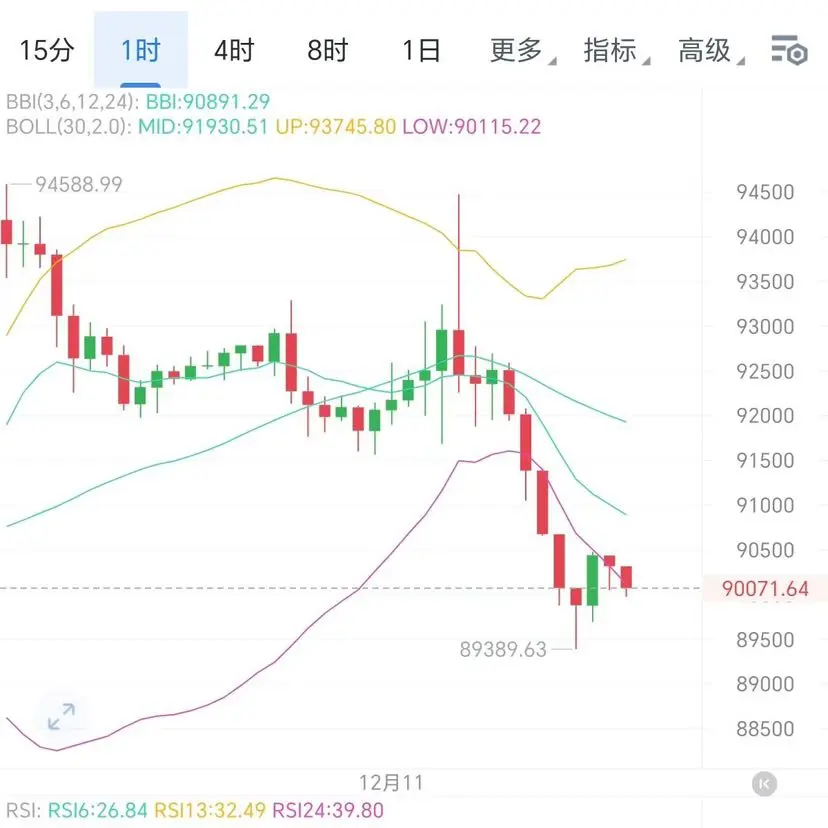
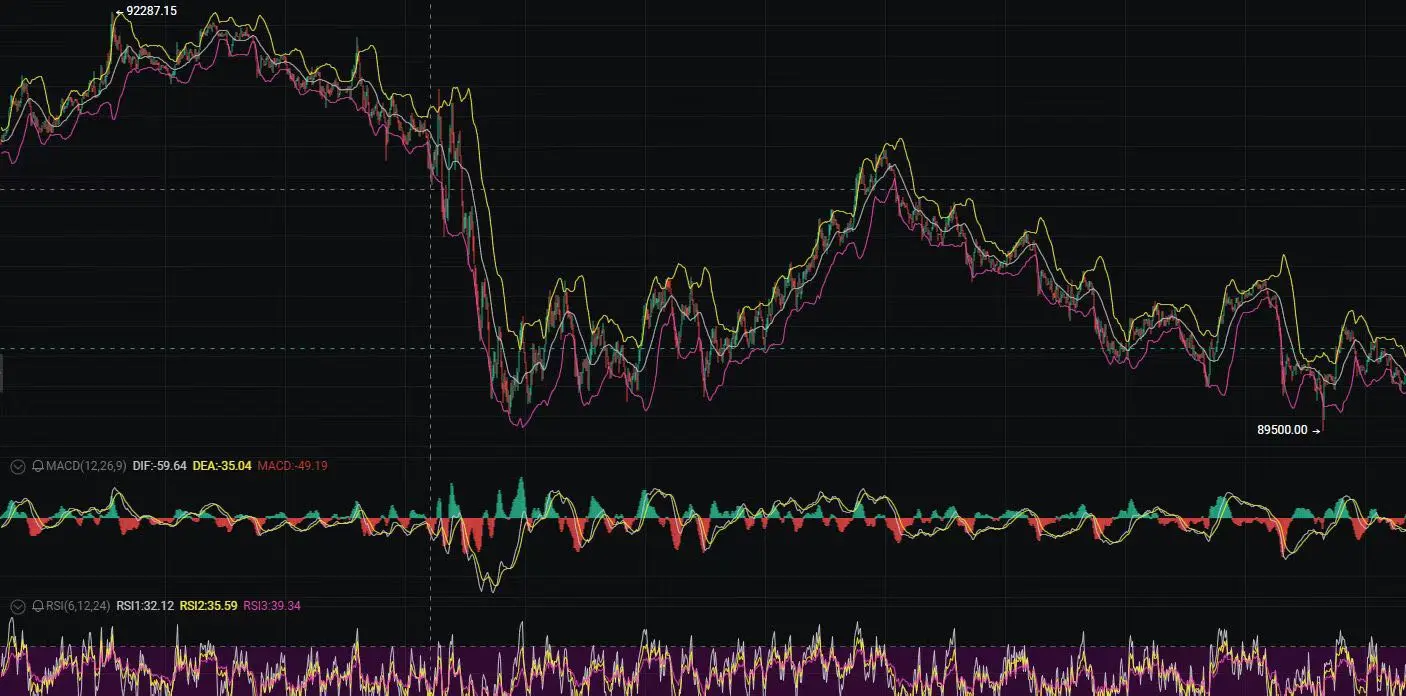
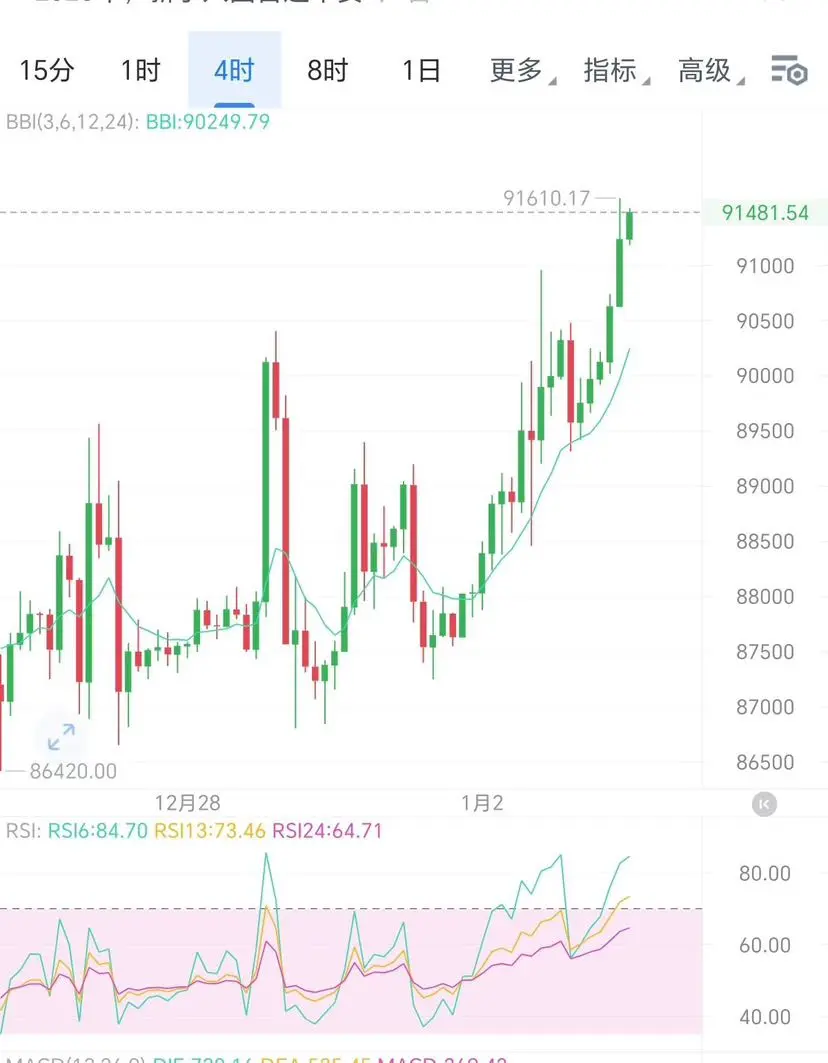
Short Bitcoin at 88000-88500, target 87000-86000, defense at 89500! $BTC
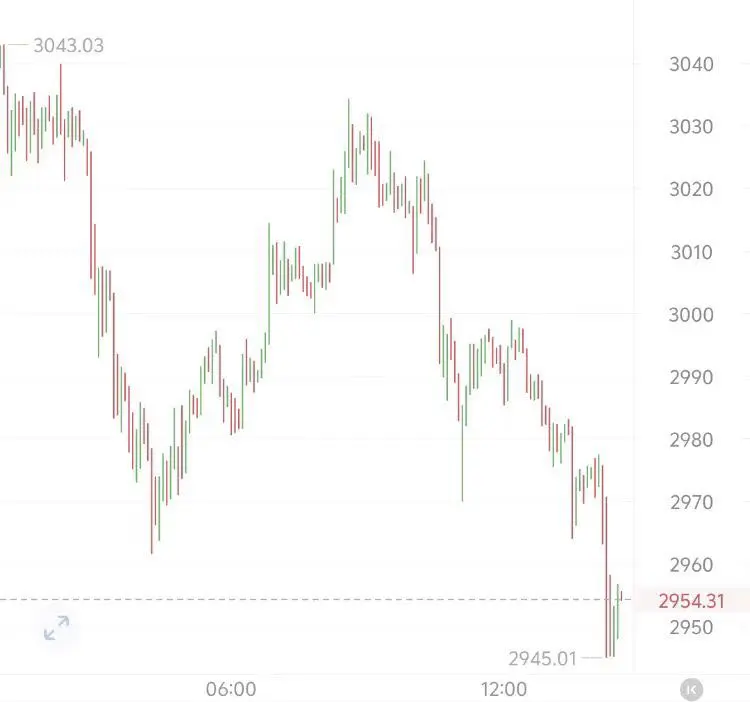
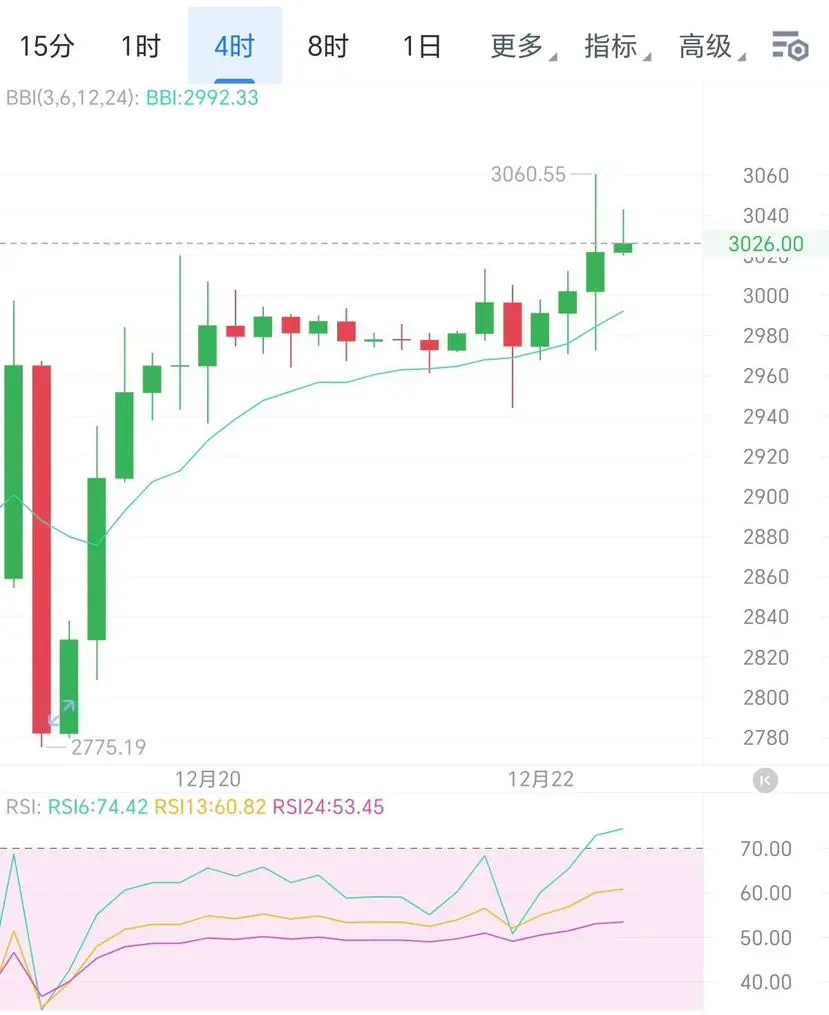
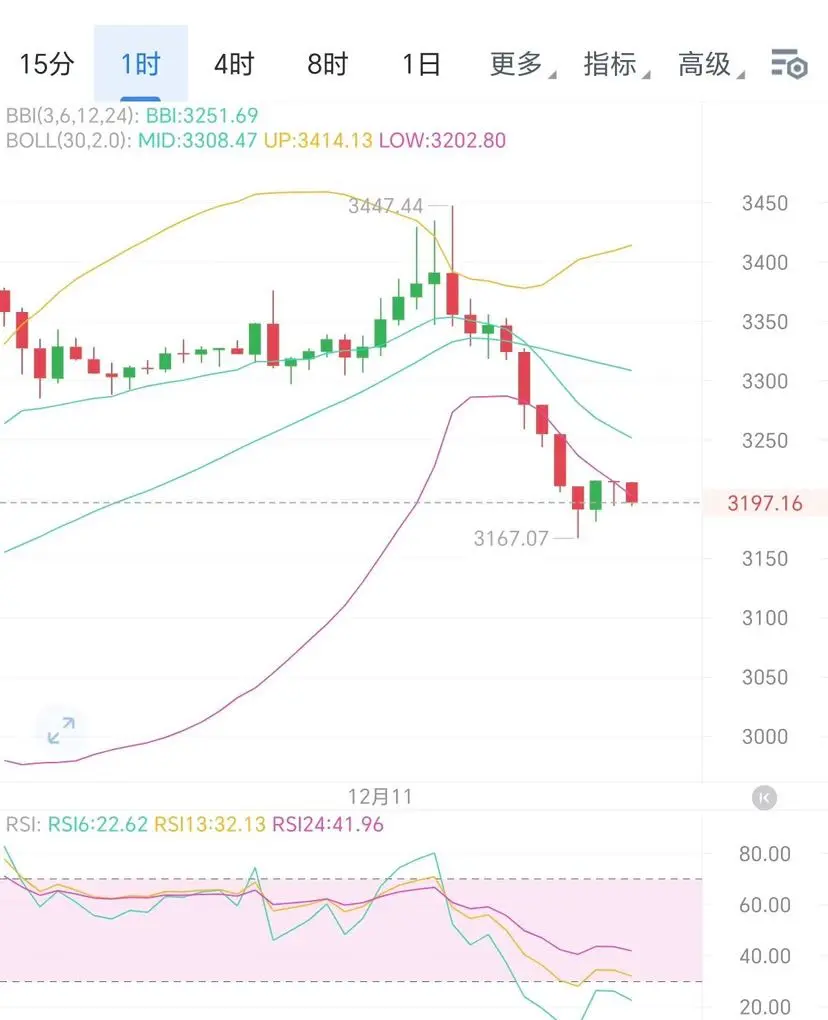
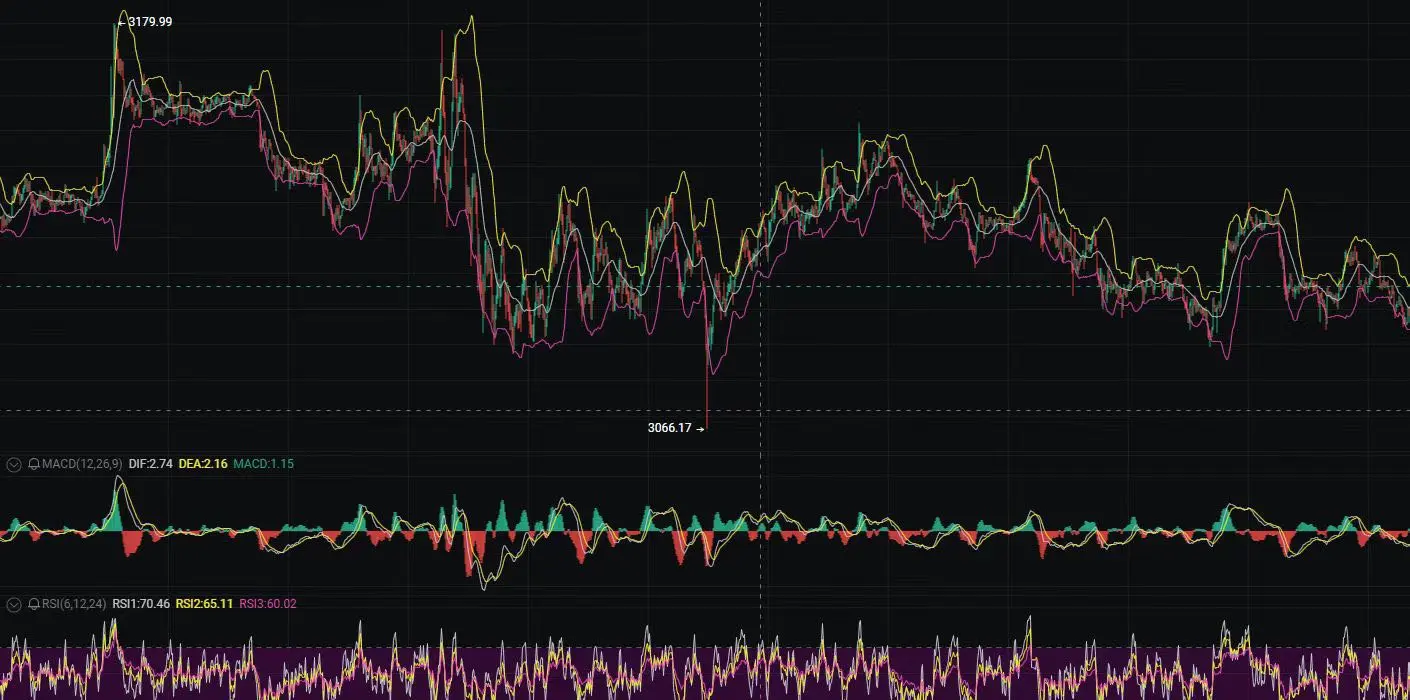
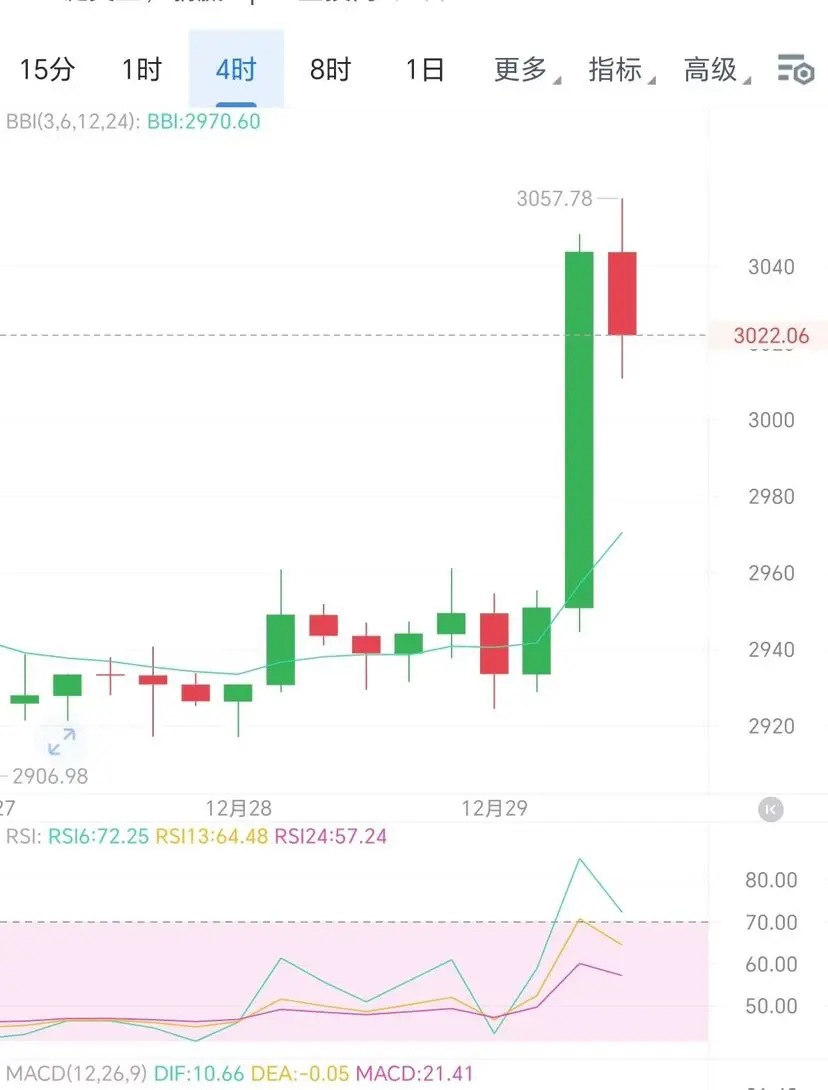
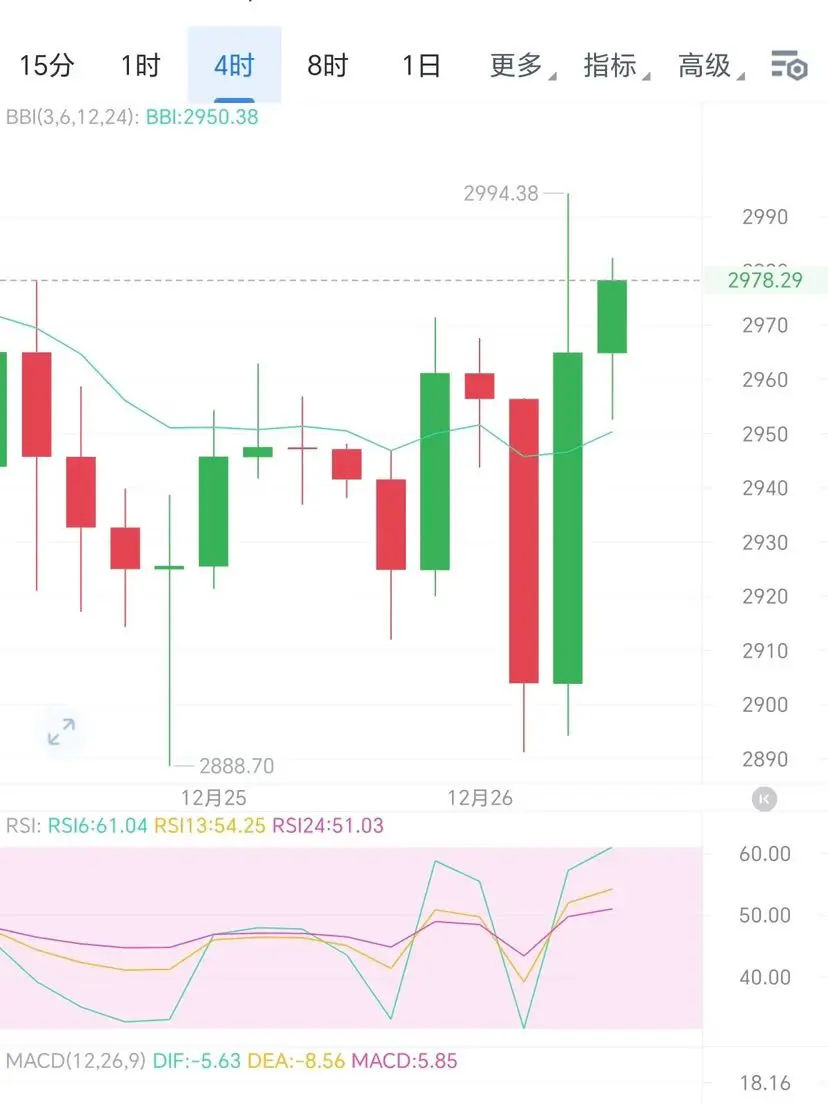
Short Ethereum at 2970-3000, target 2900-2850, defense at 3050!
The strategy is time-sensitive and is subject to real-time guidance in private!
Follow Beichen, lock in clear strategies and practical results. Team slots are limited, and if you're truly looking for a breakthrough❓ Action is the only answer❗️❗️
ETH0,93%
BTC1,38%
View Original
  • Reward
  • Comment
  • Repost
  • Share
12.23ETH afternoon price movement prediction analysis

From the current candlestick chart, the ETH price rose to 3043.03 during the day, then started to fluctuate downwards. In the afternoon, the decline continued to expand, reaching a low of 2945.01. The current quote is 2954.31, with short-term bears dominating the market rhythm, and the downtrend is quite evident.

1. Core signals of short-term technical analysis

1. Trend and Pattern: The hourly K-line presents a "high pullback + ladder decline" pattern, continuously closing in the red and breaking through key integer supports such as 3
ETH0,93%
View Original
post-image
  • Reward
  • Comment
  • Repost
  • Share
12.23BTC afternoon price movement prediction and analysis

From the current K-line chart, it can be seen that the BTC price has shown a stepped decline after reaching an intraday high of 88904.9. In the afternoon, the decline further expanded, hitting a low of 86976.6. As of the current quote of 87100.7, short-term bearish forces dominate.

1. Short-term technical signals

1. Trend characteristics: The hourly K-line continuously closes in the red, breaking through key support levels of 88000 and 87500. The moving average system shows a bearish arrangement, indicating a clear short-term down
BTC1,38%
View Original
post-image
  • Reward
  • Comment
  • Repost
  • Share
Analysis on the afternoon of 12.22
The 1-hour chart shows a clear bearish signal, with the price rising to the peak of 89600 and then forming a long upper shadow, indicating heavy selling pressure above; after a short-term rapid rebound, the upward momentum is weak, and there is a technical need for a pullback; the current price is consolidating without breaking the previous high, with an increasing divergence from the moving averages, and the volume did not increase synchronously during the rise, indicating a weakening upward momentum. It is highly likely to fall back to the moving average su
View Original
post-image
  • Reward
  • Comment
  • Repost
  • Share
From a technical structure perspective, the price has formed a daily-level "lower high" and "lower low" bearish pattern, and it continues to operate below the main moving averages. The current 89,000-89,500 zone has become a recent key resistance area. If a rebound cannot break through this area with volume, the moving average system will form a dynamic resistance, and the bearish momentum may further strengthen. The short-term core risk lies in the validity of the previous support at 87,900. Once this level is broken, the downward space may further open up to the 85,000-86,000 region.
Bitcoin
BTC1,38%
ETH0,93%
View Original
post-image
  • Reward
  • Comment
  • Repost
  • Share
Today’s Bitcoin technical analysis conclusion: It is in a critical consolidation and decision-making period. The bulls' lifeline focuses on the 88,000-89,000 support zone. The upward momentum is insufficient, and there is a need to watch out for the risk of a breakdown.
Core Technical Indicators Breakdown
Trend Indicators (EMA/Bollinger Bands): The daily K-line has lost the EMA15 level (91,000). The upper band of the Bollinger Bands has compressed to 94,200. After retesting the middle band (89,900), the price has shown weak consolidation; the 4-hour Bollinger Bands have narrowed to 88,800-93,7
BTC1,38%
View Original
post-image
  • Reward
  • Comment
  • Repost
  • Share
Market Analysis
Last night, the script played out again: the Federal Reserve announced a rate cut, Powell’s speech was dovish, the market initially celebrated and surged higher, then a large bearish candle slammed down, trapping all the late buyers. What does this indicate? It shows that the current market is extremely fragile; any positive news that pushes prices up is just a “trap to lure more longs,” providing a better entry point for the bears to dump.
This is the third rate cut this year, and the market has become numb; technical indicators all point to “bearish.” Daily candles have been
BTC1,38%
ETH0,93%
View Original
post-image
post-image
  • Reward
  • 4
  • Repost
  • Share
GateUser-9af343aavip:
Real-time strategy: Sell in batches between 3276-3306, target 3180, stop-loss above 3318
View More
Yesterday evening, ETH surged sharply from 3100 to 3400, skyrocketing by 300 points and catching people off guard. Afterwards, the price consolidated and is now fluctuating around 3300.
From a technical standpoint, on the 4-hour chart, the price pulled back to the moving average and found key support. If the price holds steady, you can chase longs. The Bollinger Bands are expanding upward in all three tracks, indicating that bullish sentiment is recovering. The MACD indicator is above the zero axis and turning upward, with volume bars continuously increasing. You can buy on pullbacks during th
ETH0,93%
View Original
post-image
  • Reward
  • Comment
  • Repost
  • Share
The long position strategy given this afternoon has perfectly closed in profit, so you can sleep soundly now.
If you have no ideas, feel free to follow—an eight-year crypto veteran will help you break through.
View Original
post-image
post-image
  • Reward
  • Comment
  • Repost
  • Share
12.9 Market Analysis: BTC & ETH
The overall market remains in a consolidation phase. BTC and ETH are repeatedly testing support levels in key ranges. There is slight divergence in the short-term trends, but the overall structure remains within a controllable range. Below is a multi-timeframe interpretation and trading reference.
【BTC Trend】
On the daily chart, BTC continues to consolidate around the 90,000 level, with intensified long-short battles.
4-hour technicals:
- MACD red bars are shortening → Bullish momentum is temporarily easing, and short-term price action is relatively weak
BTC1,38%
ETH0,93%
View Original
post-image
post-image
  • Reward
  • Comment
  • Repost
  • Share
🔥Breaking: This week, the crypto market faces a decisive moment!
The next few days will directly determine the market trend for this month! Three major events, each of which could ignite the market 🔥
📅 December 9: JOLTs Job Openings Data Release
Forecast: 7.2 million, a key indicator for monitoring the labor market!
Below 7.2 million = Weak employment → Rate cut expectations rise → Positive for liquidity 🚀
Above 7.2 million = Strong employment → Rate cuts may be delayed → Market pressure 😰
🏛️ December 10: Fed Interest Rate Decision + Powell Speech
The market has already priced in a "25 b
BTC1,38%
ETH0,93%
View Original
post-image
  • Reward
  • Comment
  • Repost
  • Share
Tonight's ETH trading plan:
Short at 3183
Stop loss at 3258
Take profit at 3070-2983-2875, sell 30% in batches
Take your share.
ETH0,93%
View Original
post-image
  • Reward
  • Comment
  • Repost
  • Share
Bitcoin completed a long-short reversal in the early morning, surging over 4,000 points in a short period and successfully breaking through the psychological resistance at 90,000. Bullish sentiment is marginally recovering, breaking the previous weak consolidation pattern.
On the daily chart, a bullish candle was formed. After breaking above the midline resistance, the price continued upward but encountered resistance near 91,700 and pulled back to around 88,900. This area has concentrated selling pressure; subsequent rebounds testing this range are still expected to face pullbacks, so pay att
BTC1,38%
View Original
post-image
  • Reward
  • Comment
  • Repost
  • Share
  • Pin

Trade Crypto Anywhere Anytime
qrCode
Scan to download Gate App
Community
  • 简体中文
  • English
  • Tiếng Việt
  • 繁體中文
  • Español
  • Русский
  • Français (Afrique)
  • Português (Portugal)
  • Bahasa Indonesia
  • 日本語
  • بالعربية
  • Українська
  • Português (Brasil)