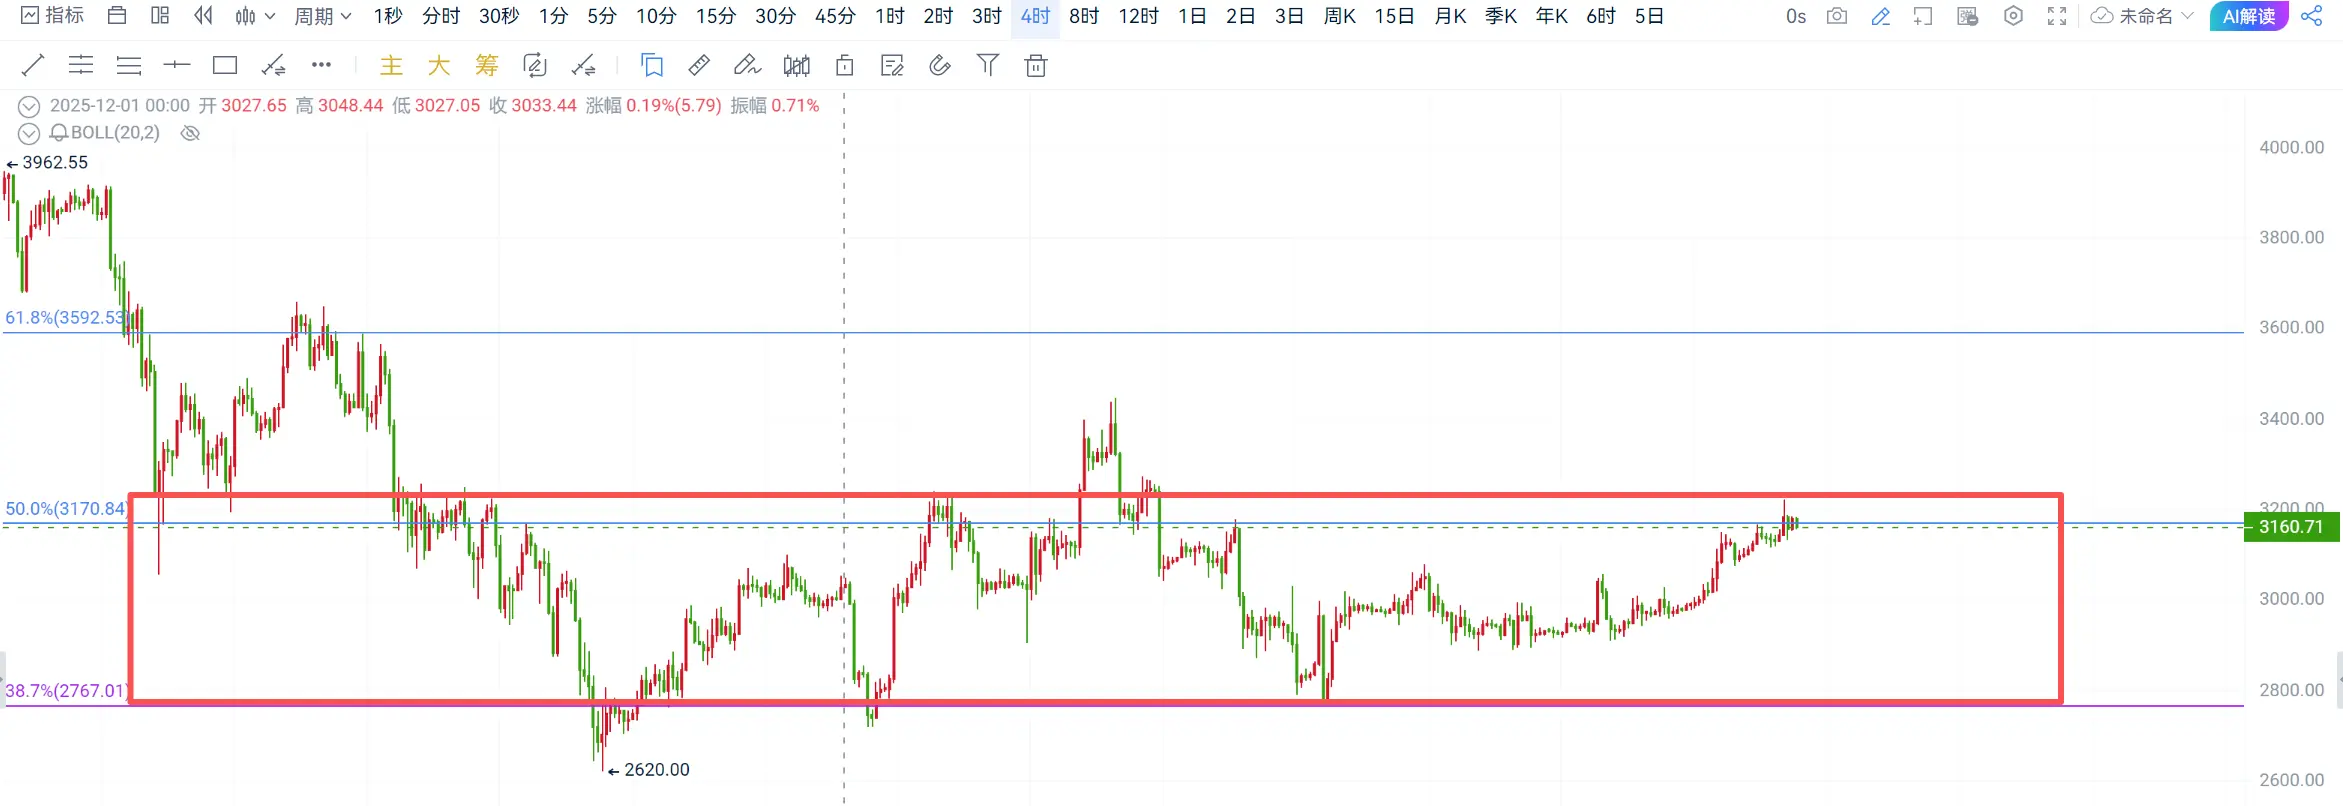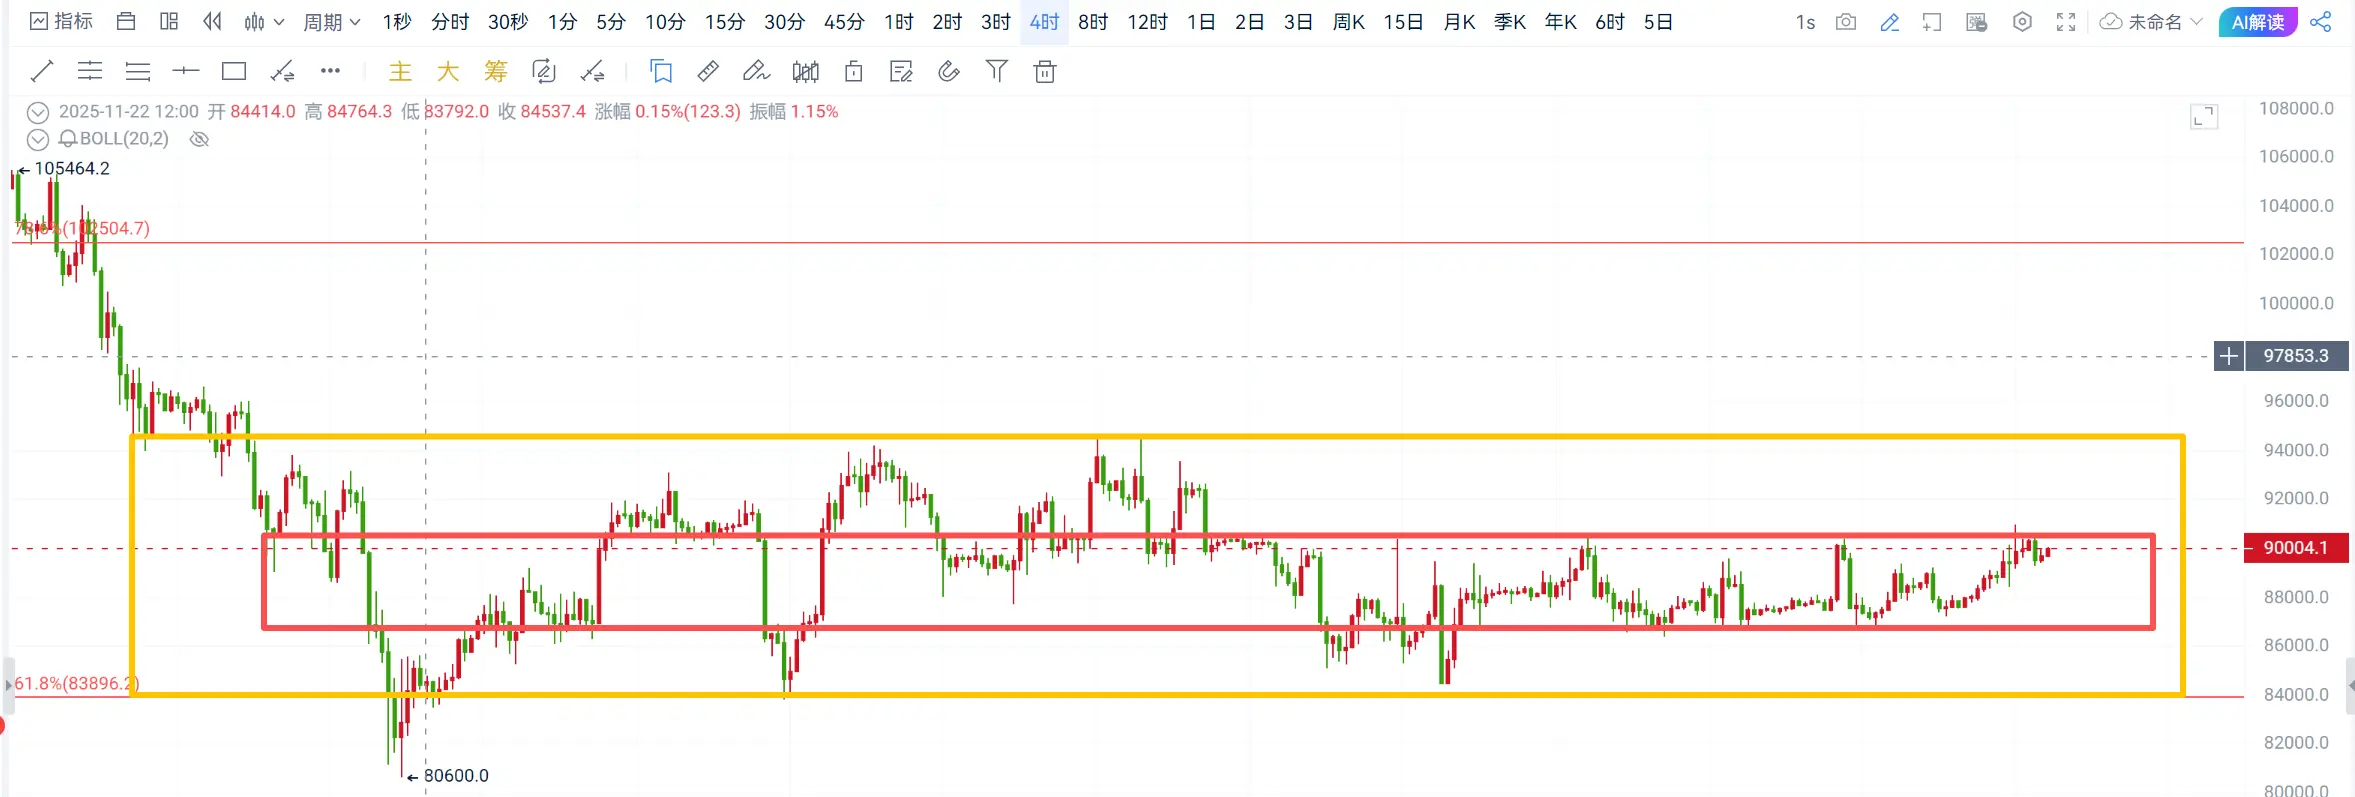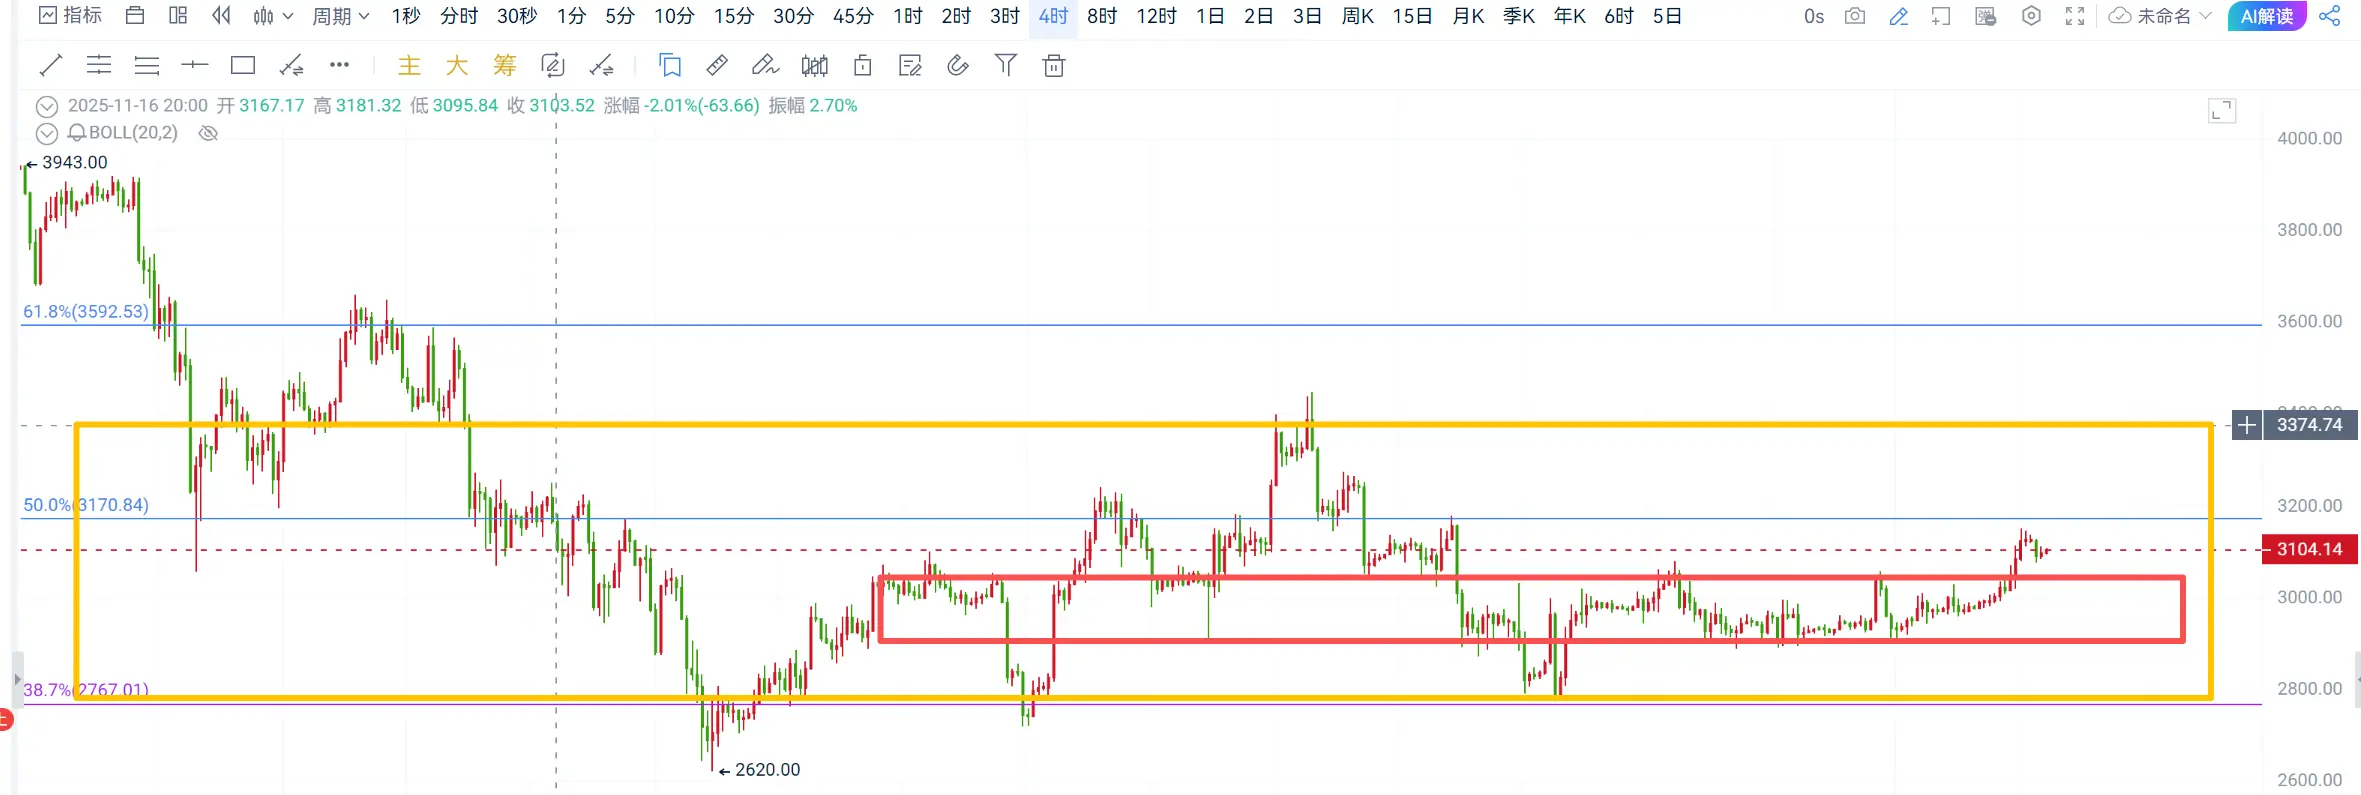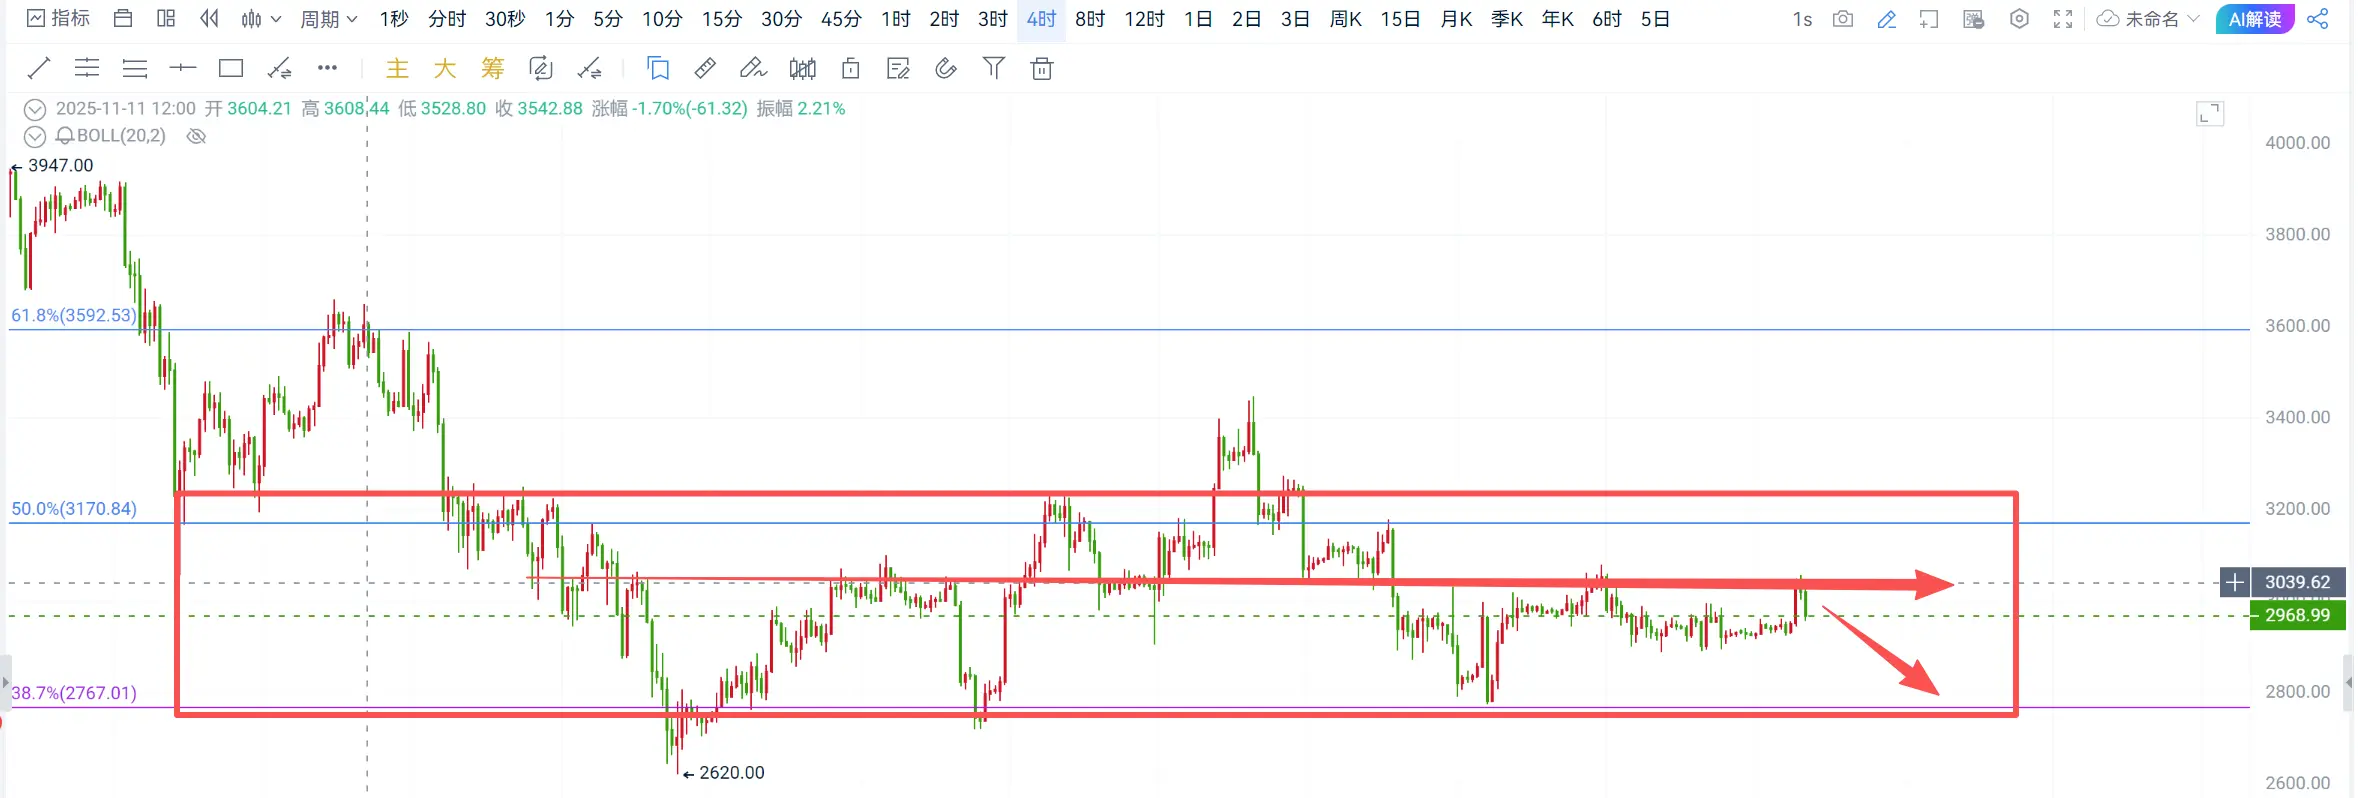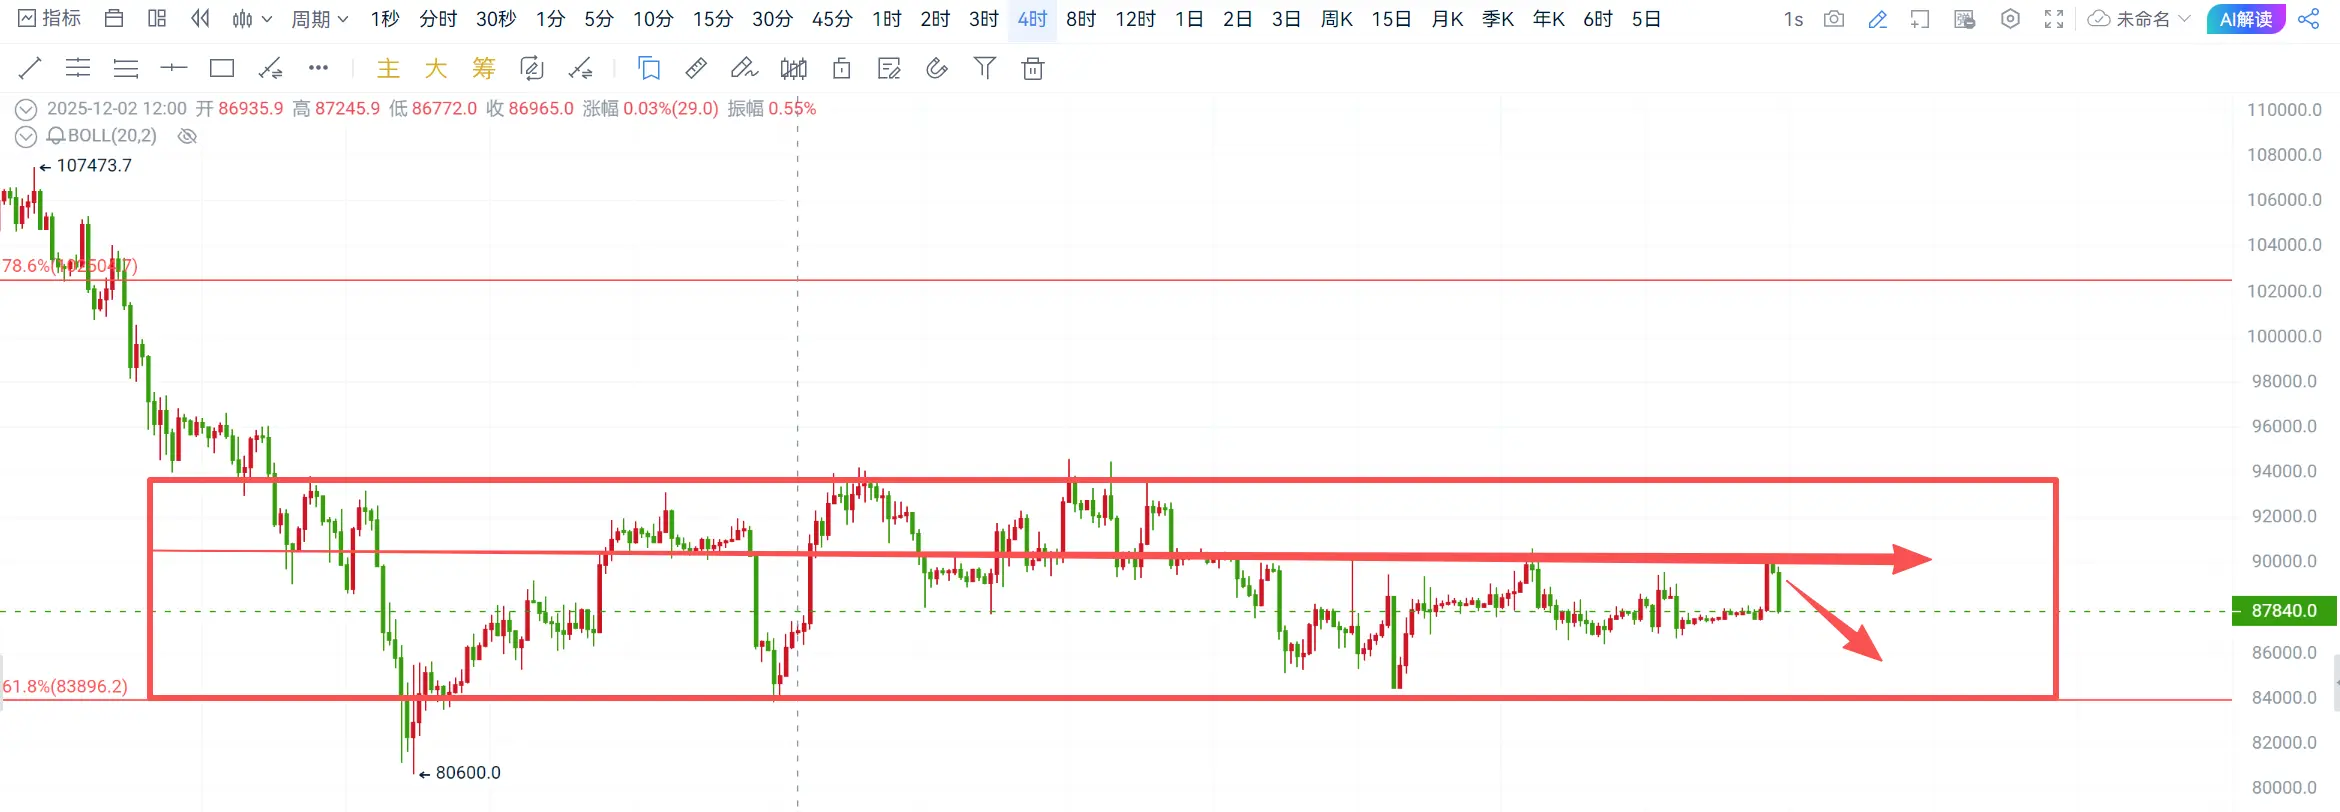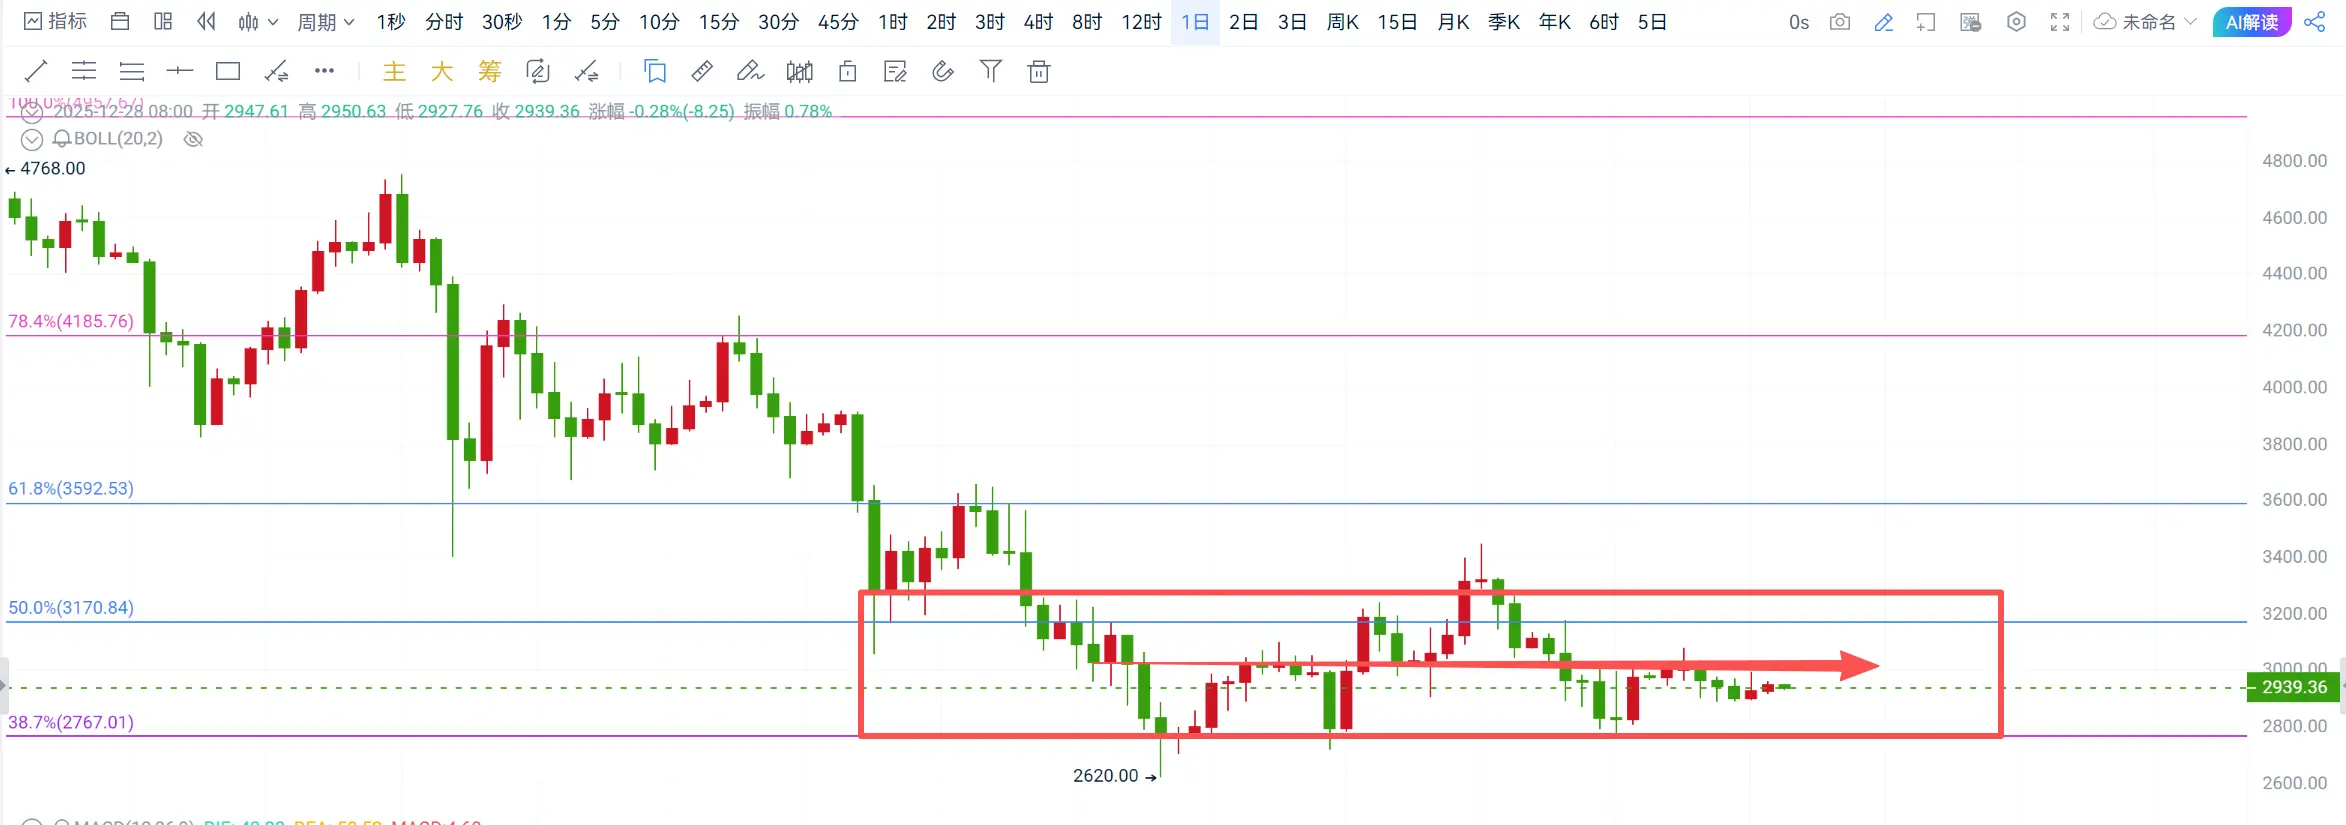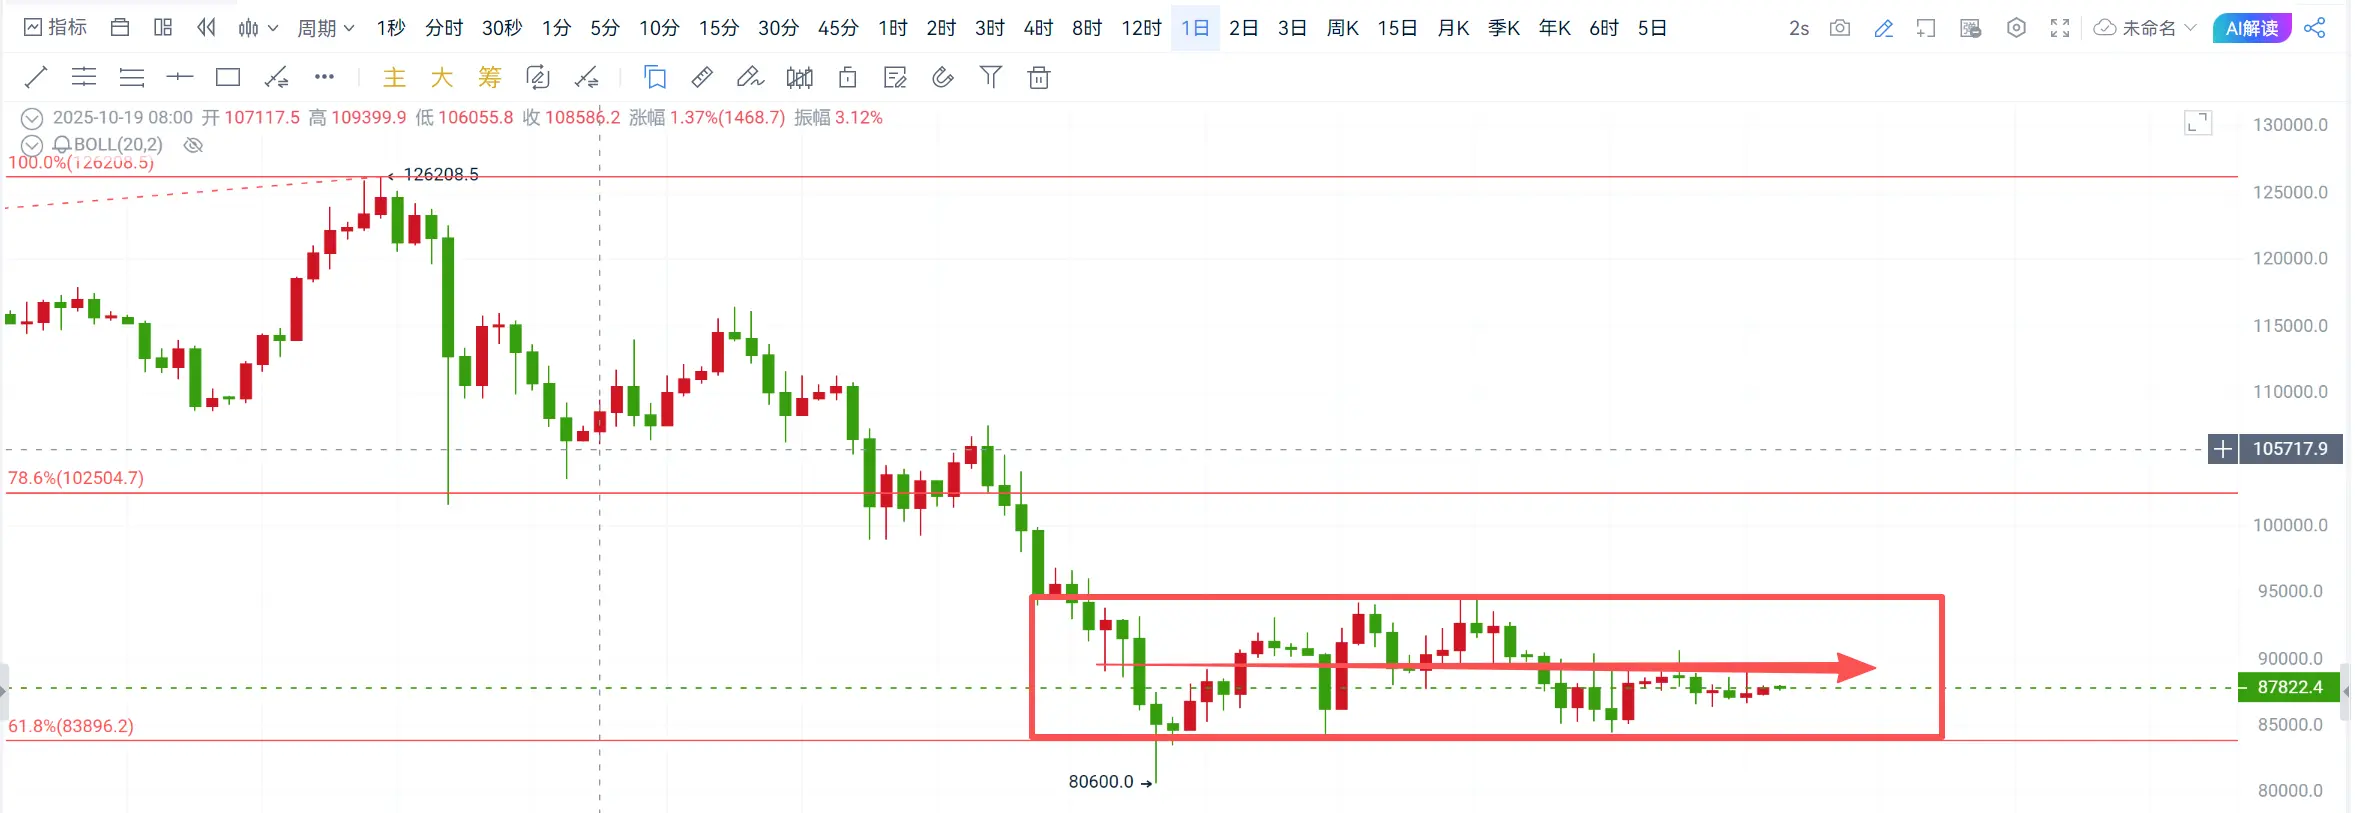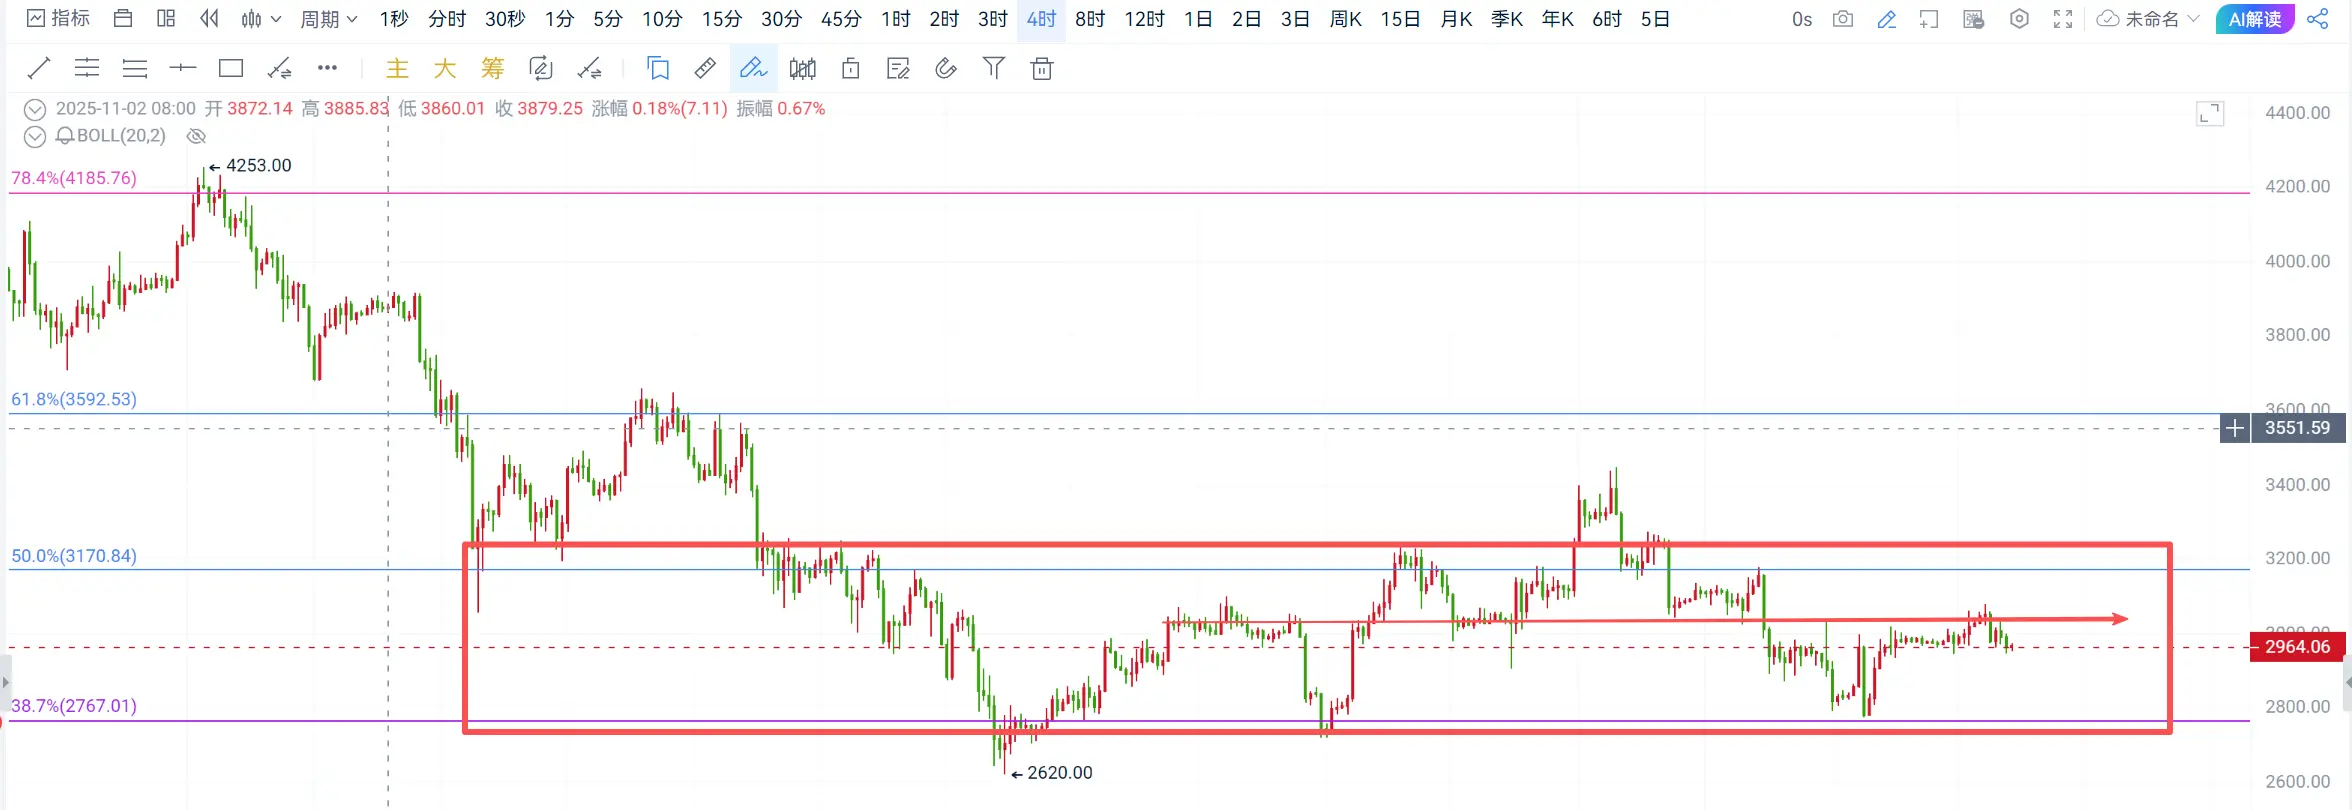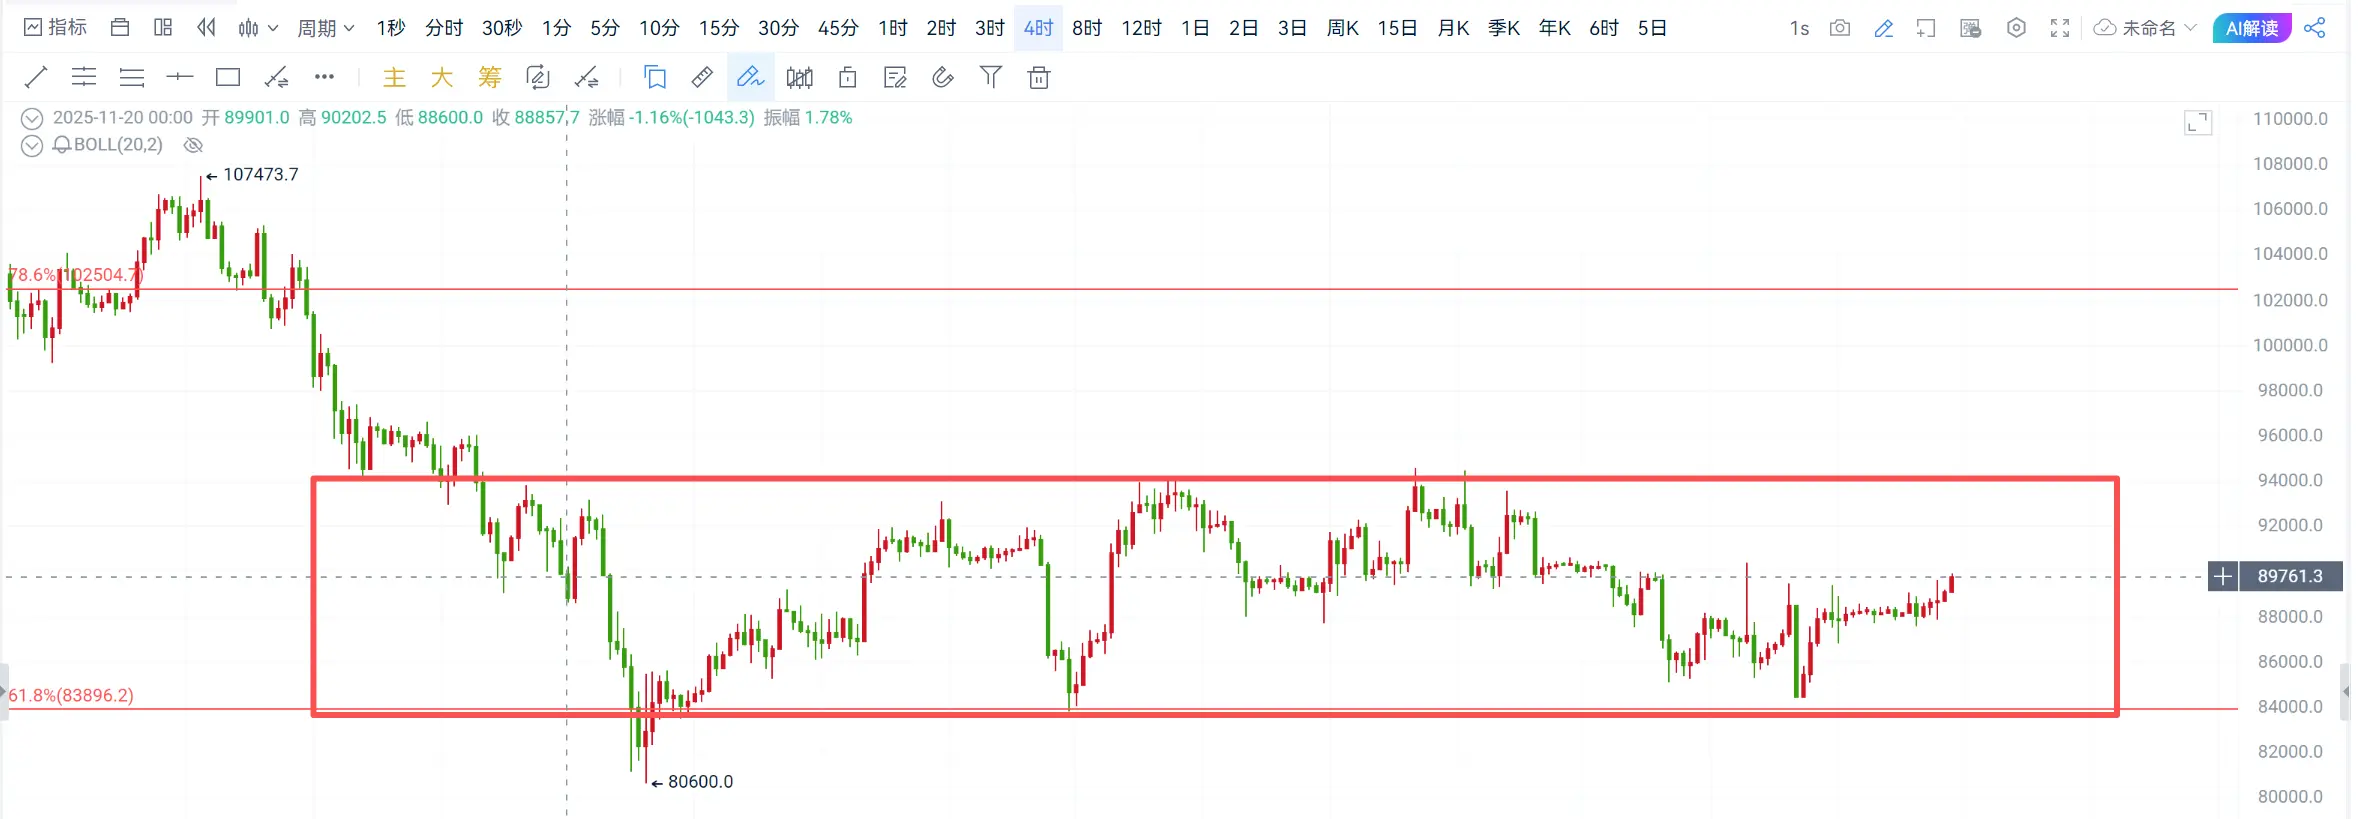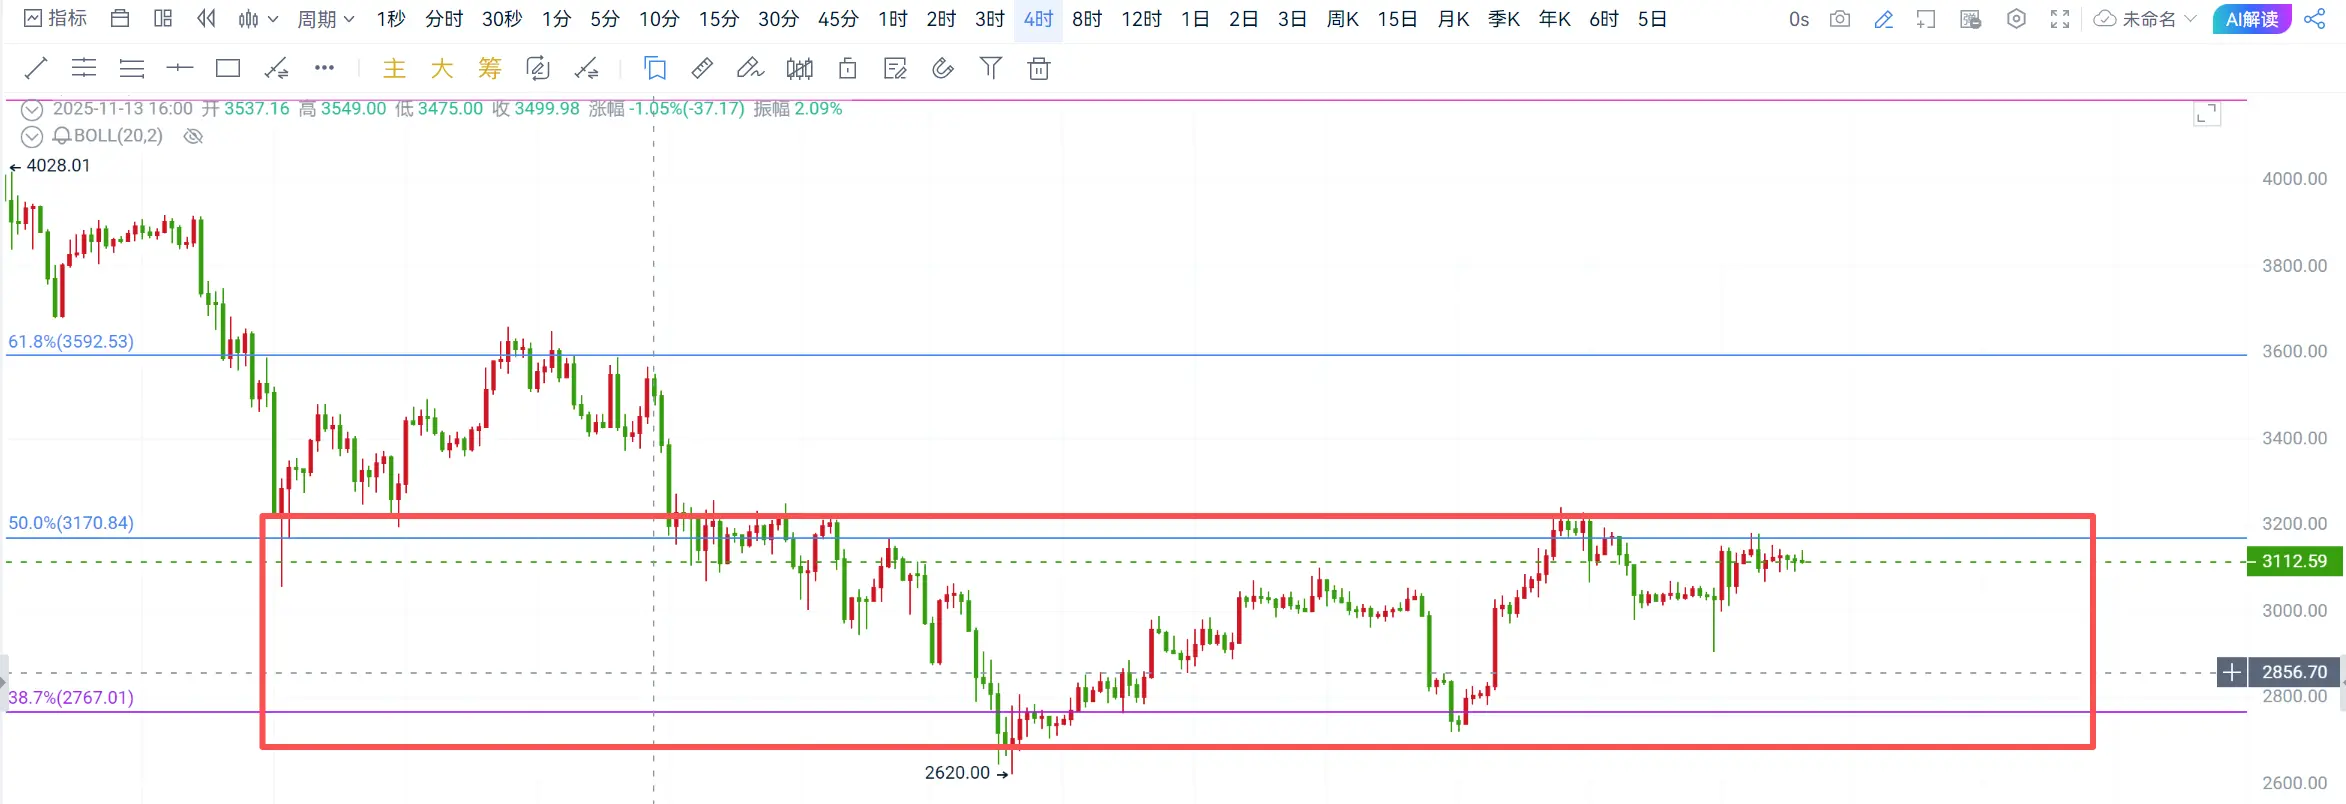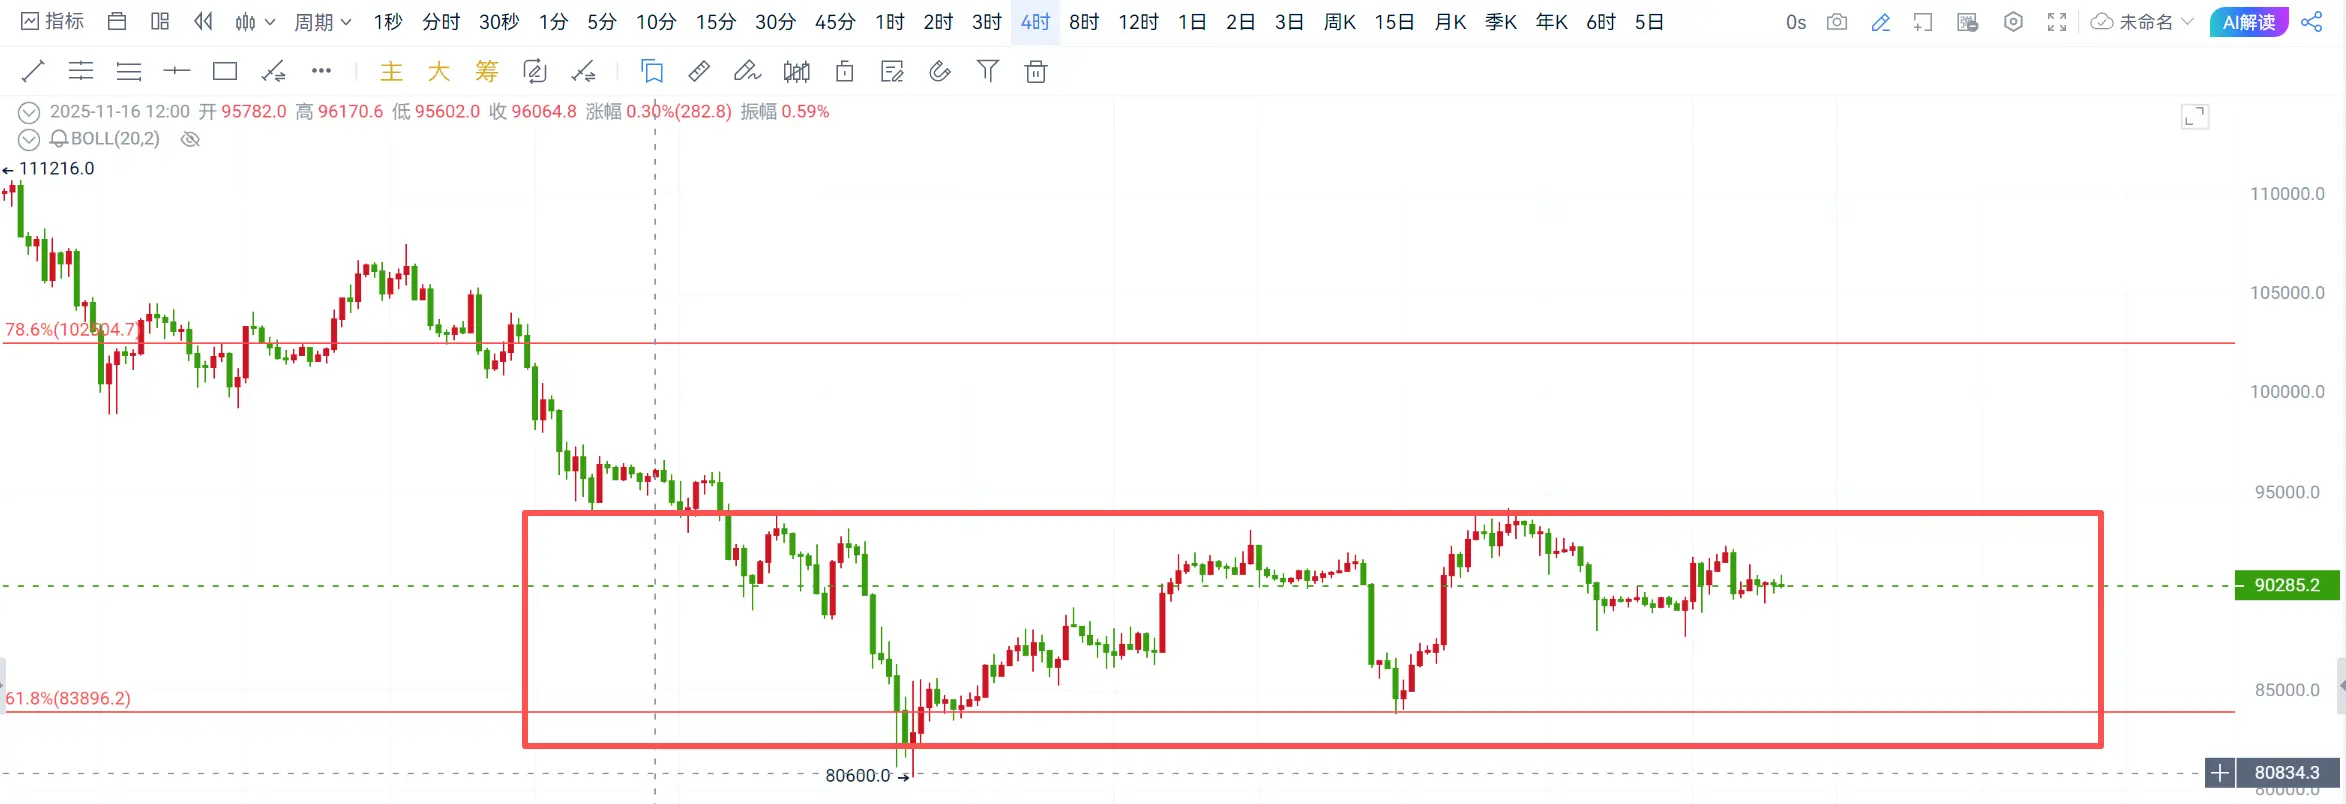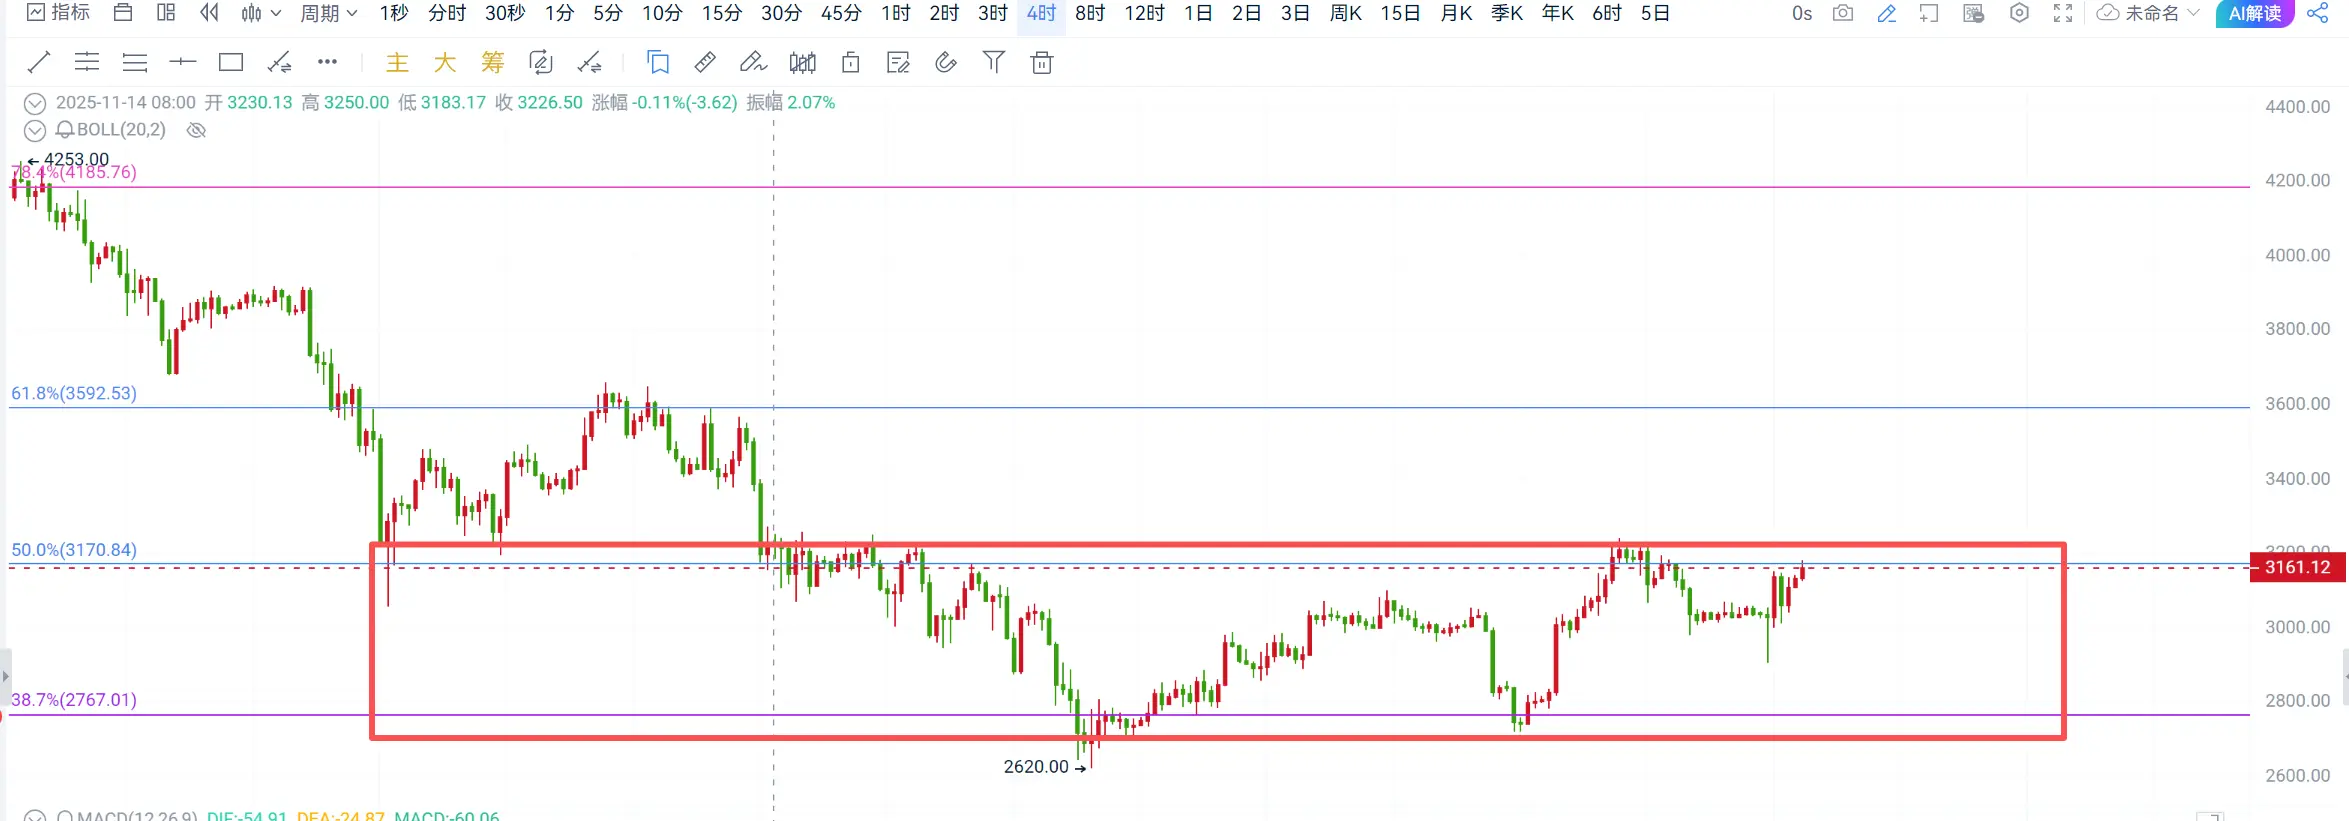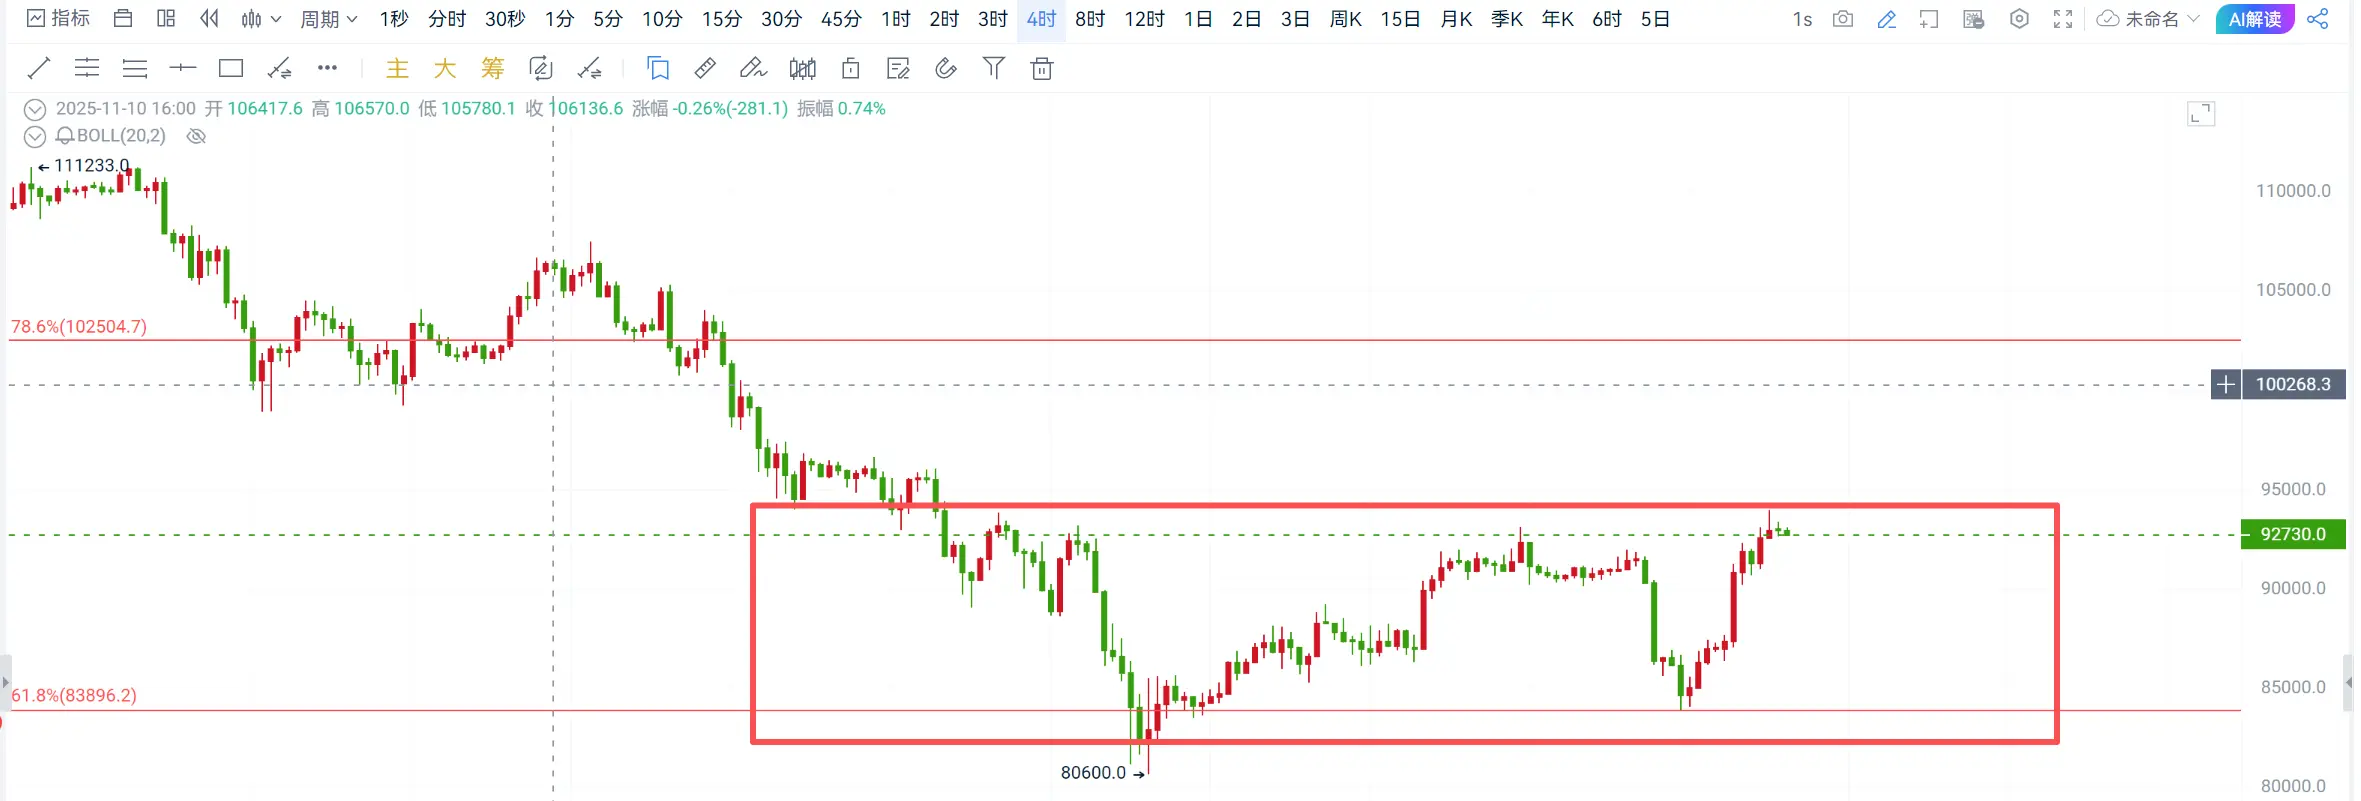
The daily chart shows Bitcoin continuing its upward trend, approaching around 93,000. After breaking through the lower half of the box structure, it surged strongly toward the top of the box, near 94,500. The top is at 94,500, the bottom at 84,500, with support around 90,000. There is still some room to move upward from here! Ethereum also continues its upward trend, approaching 3,200. After breaking through the lower half of the box, it has been rising steadily, with a top at 3,320, a bottom at 2,770, and support around 3,030. As previously mentioned, breaking through the resistance levels is a good entry point. The daily support level is around 3,230, with a breakout target of 3,320-3,420!
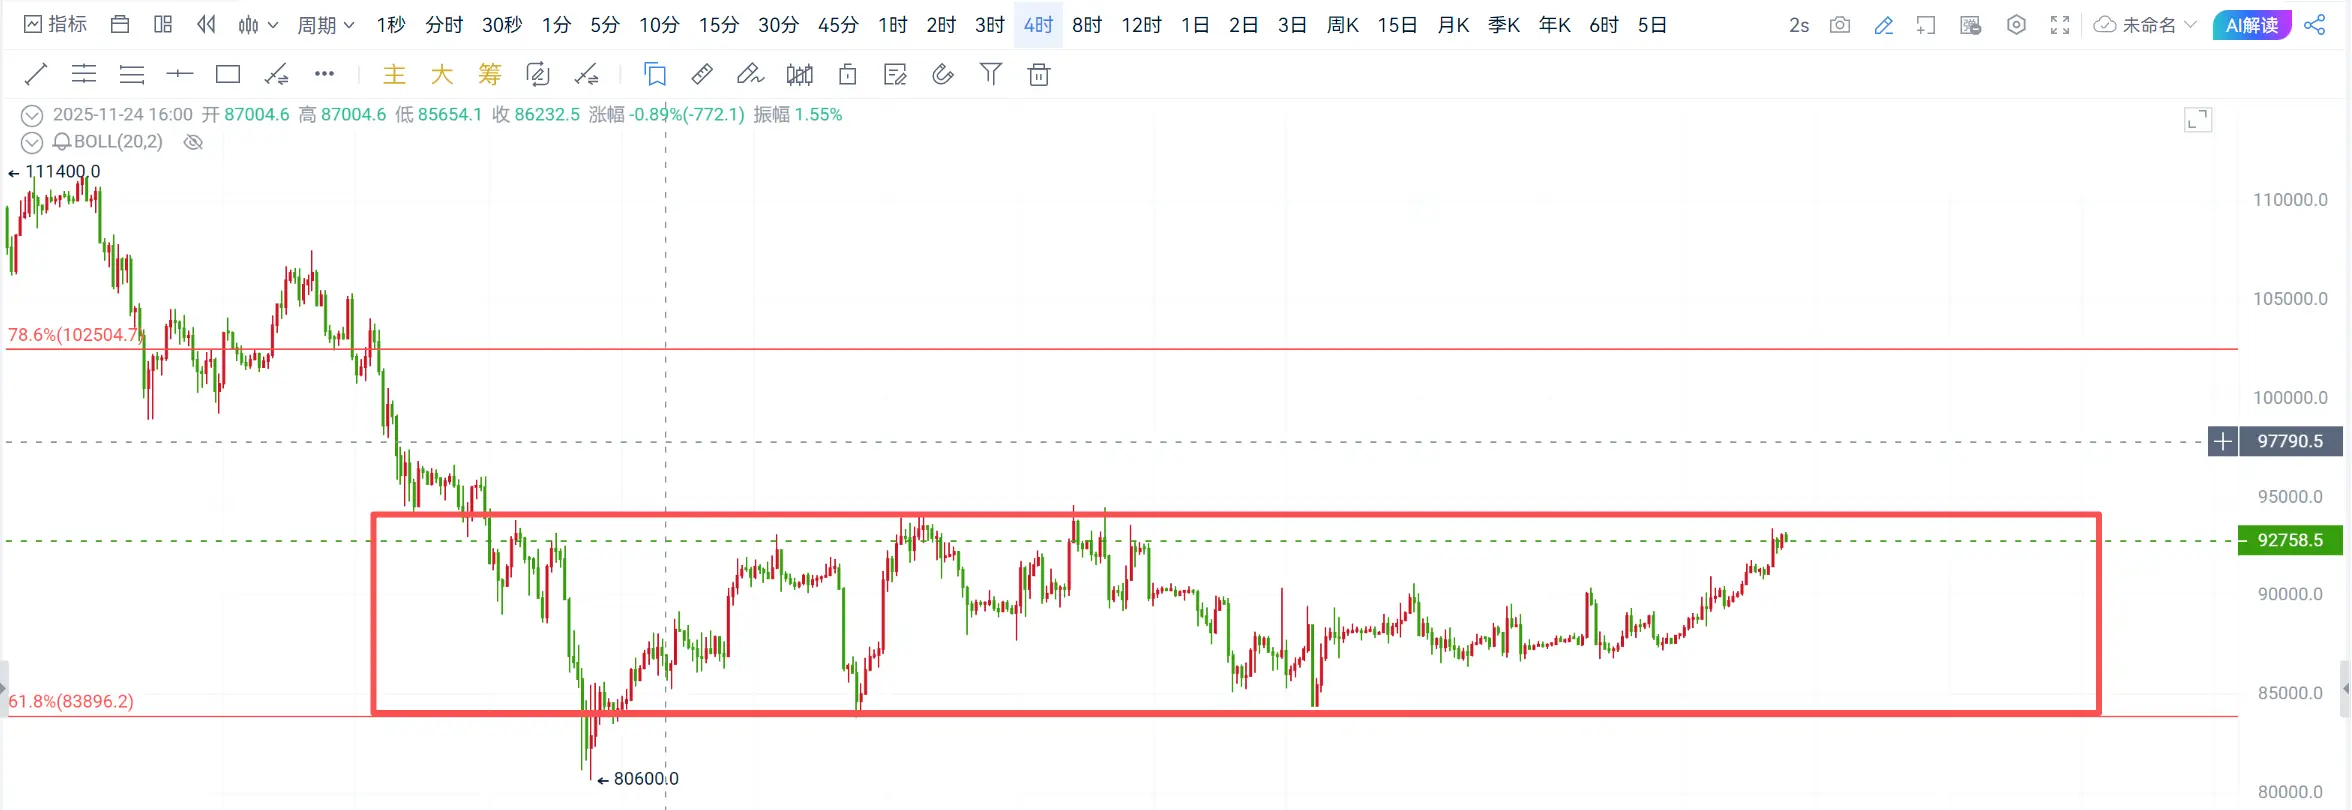
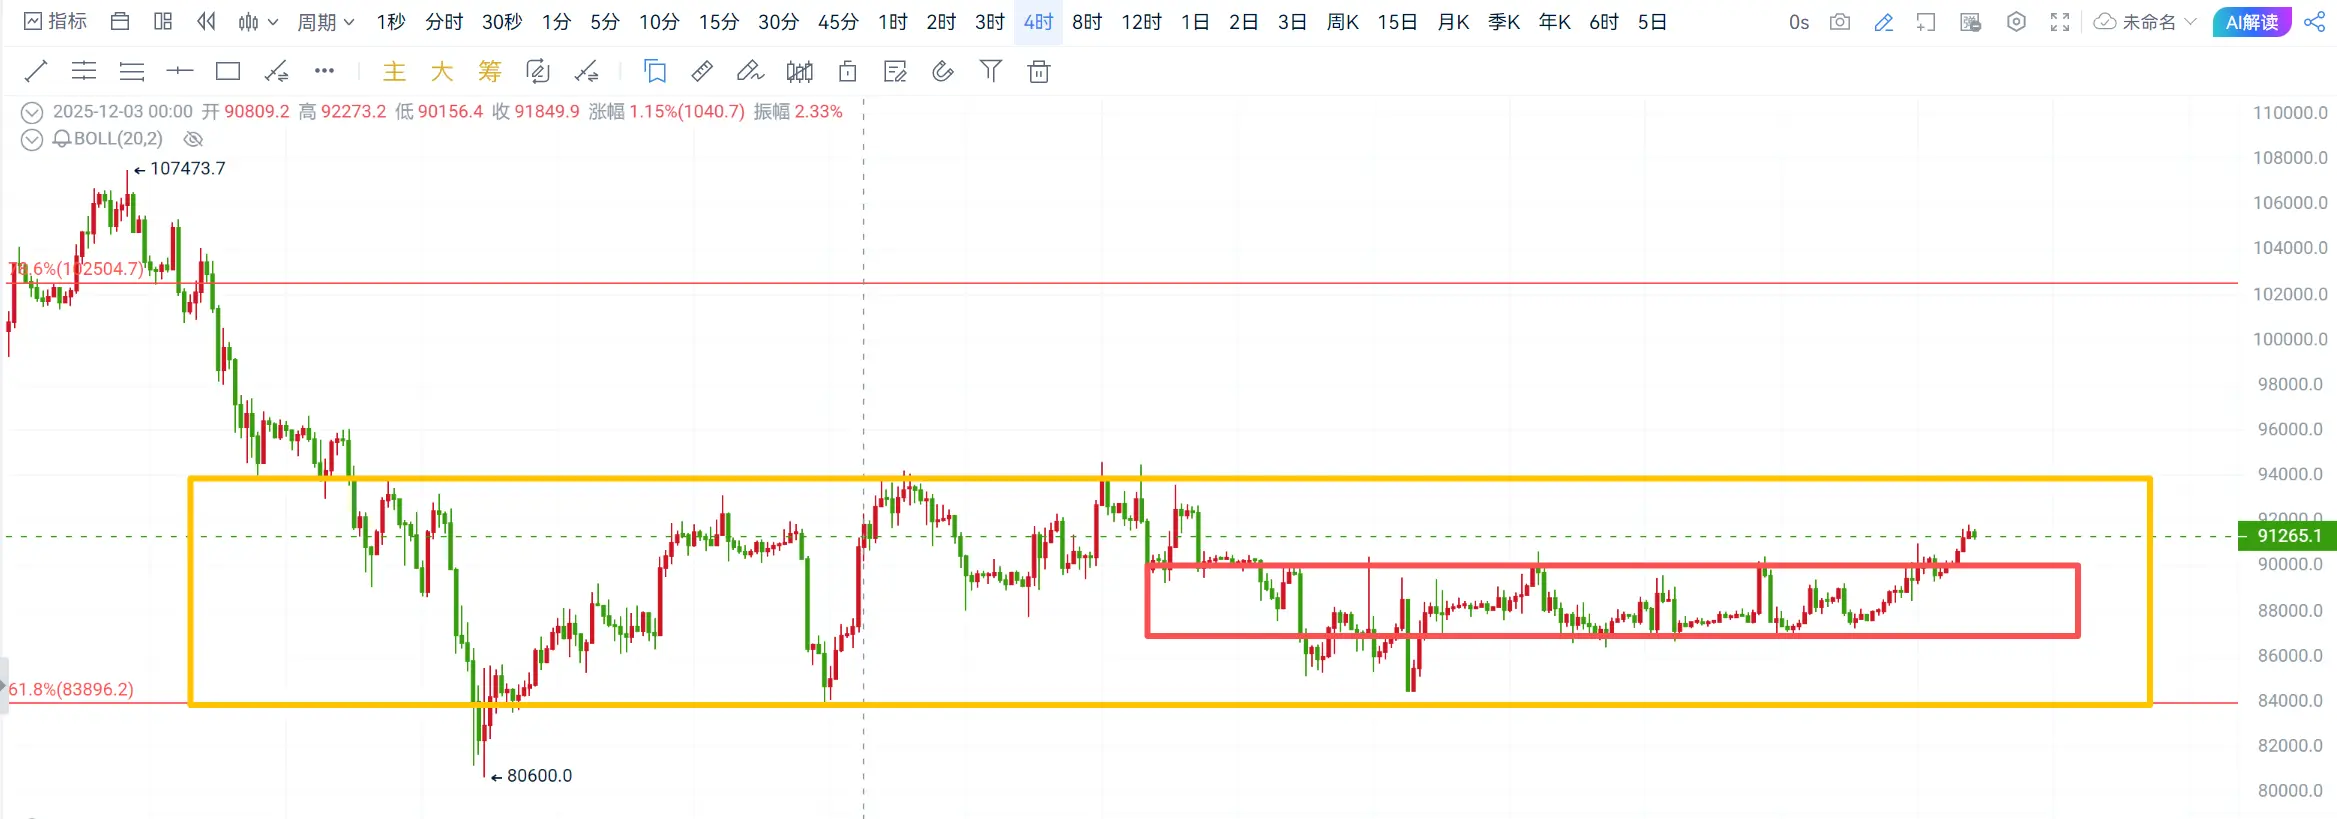
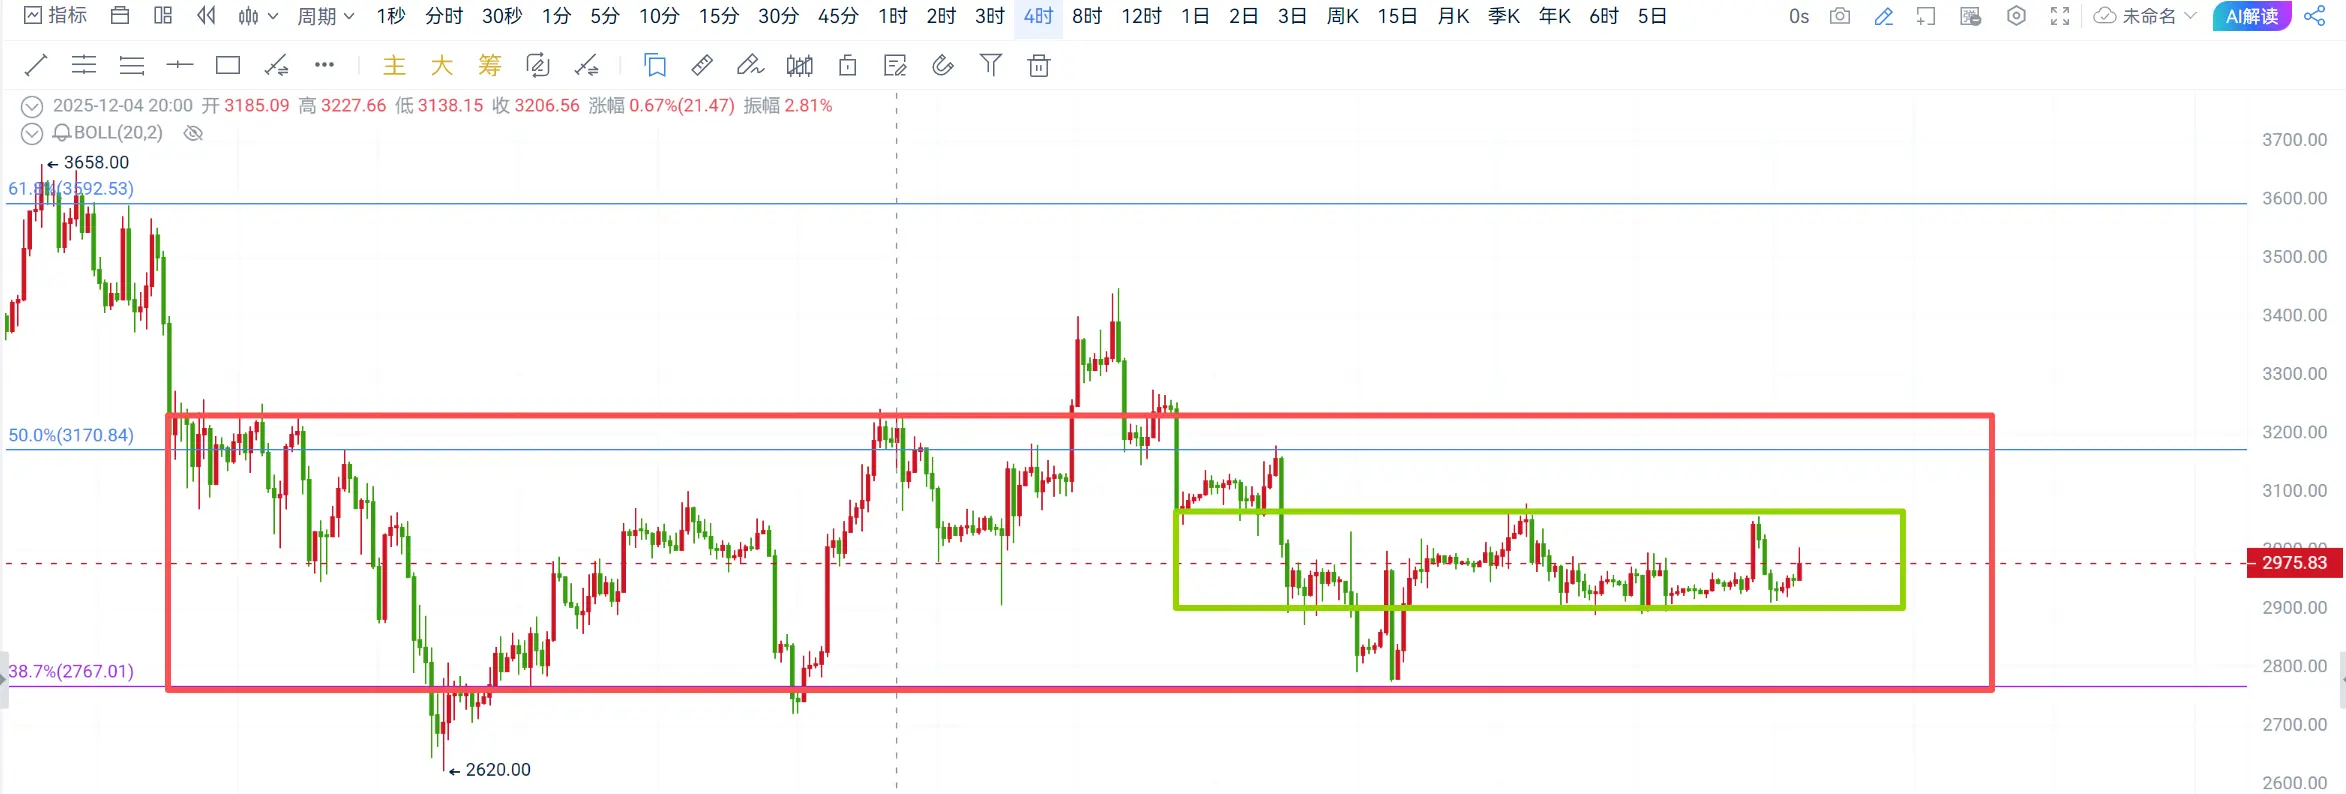
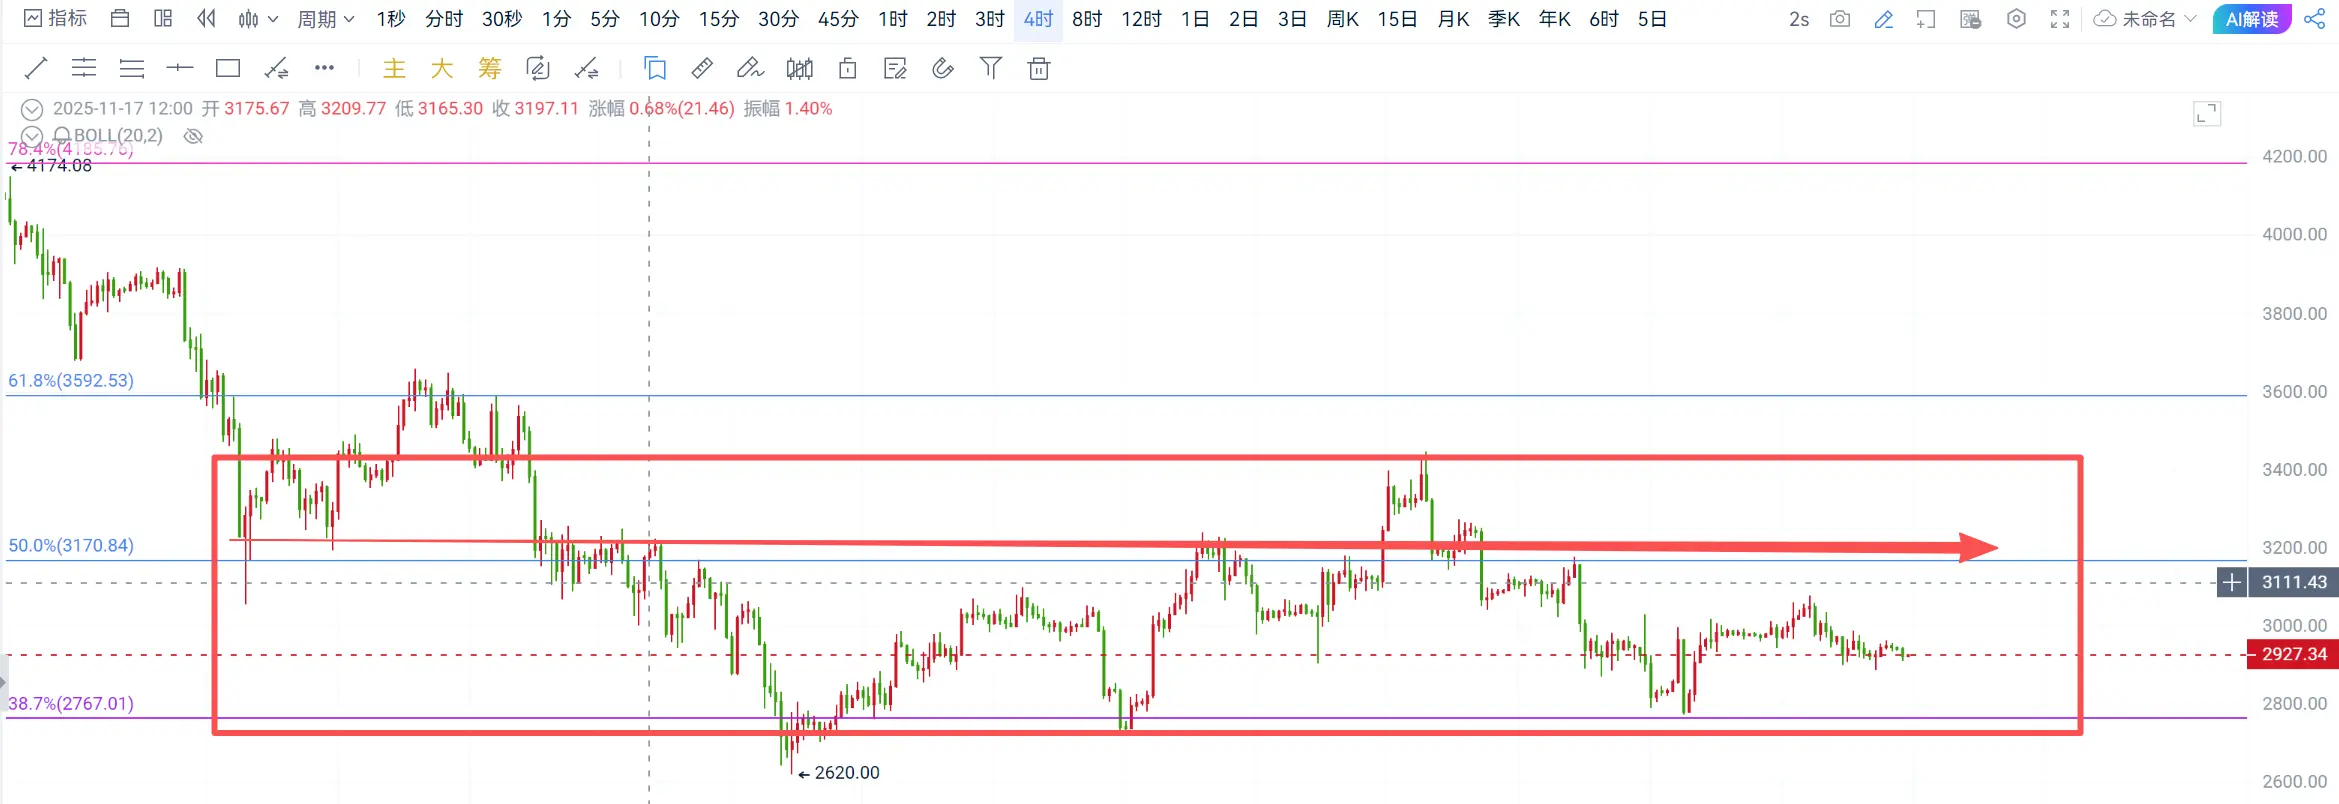
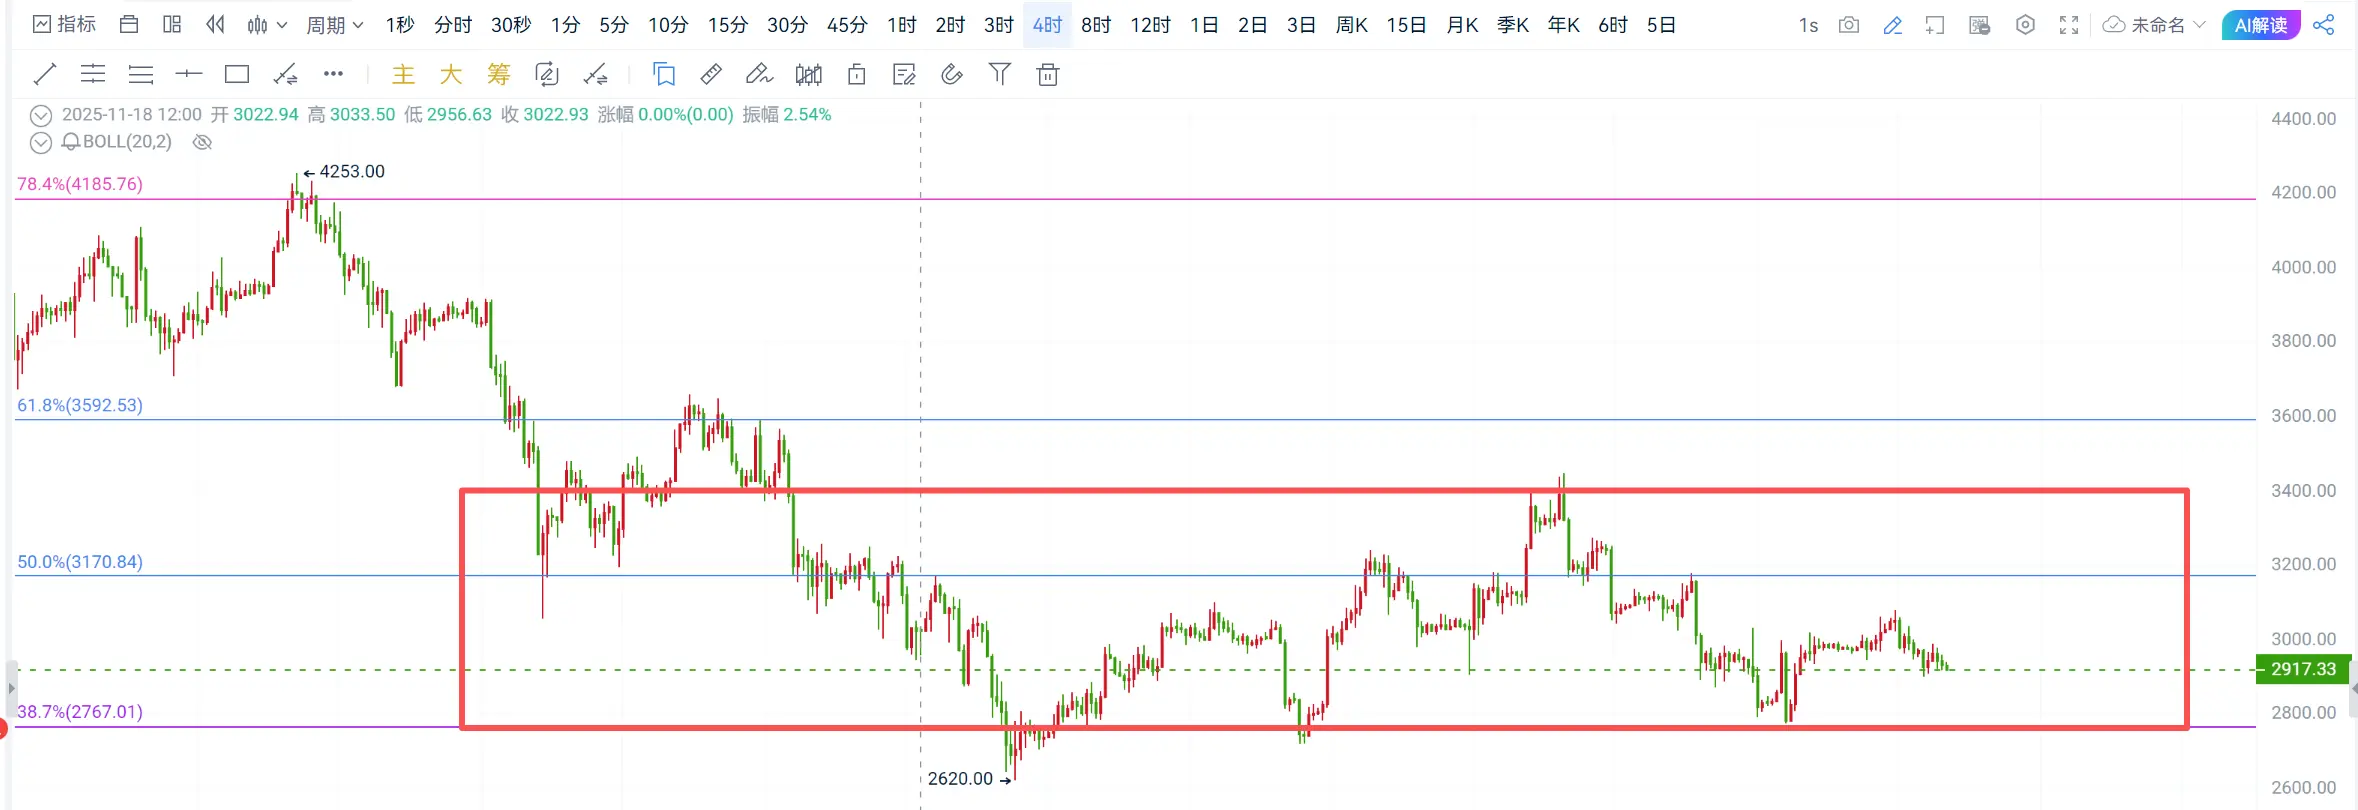
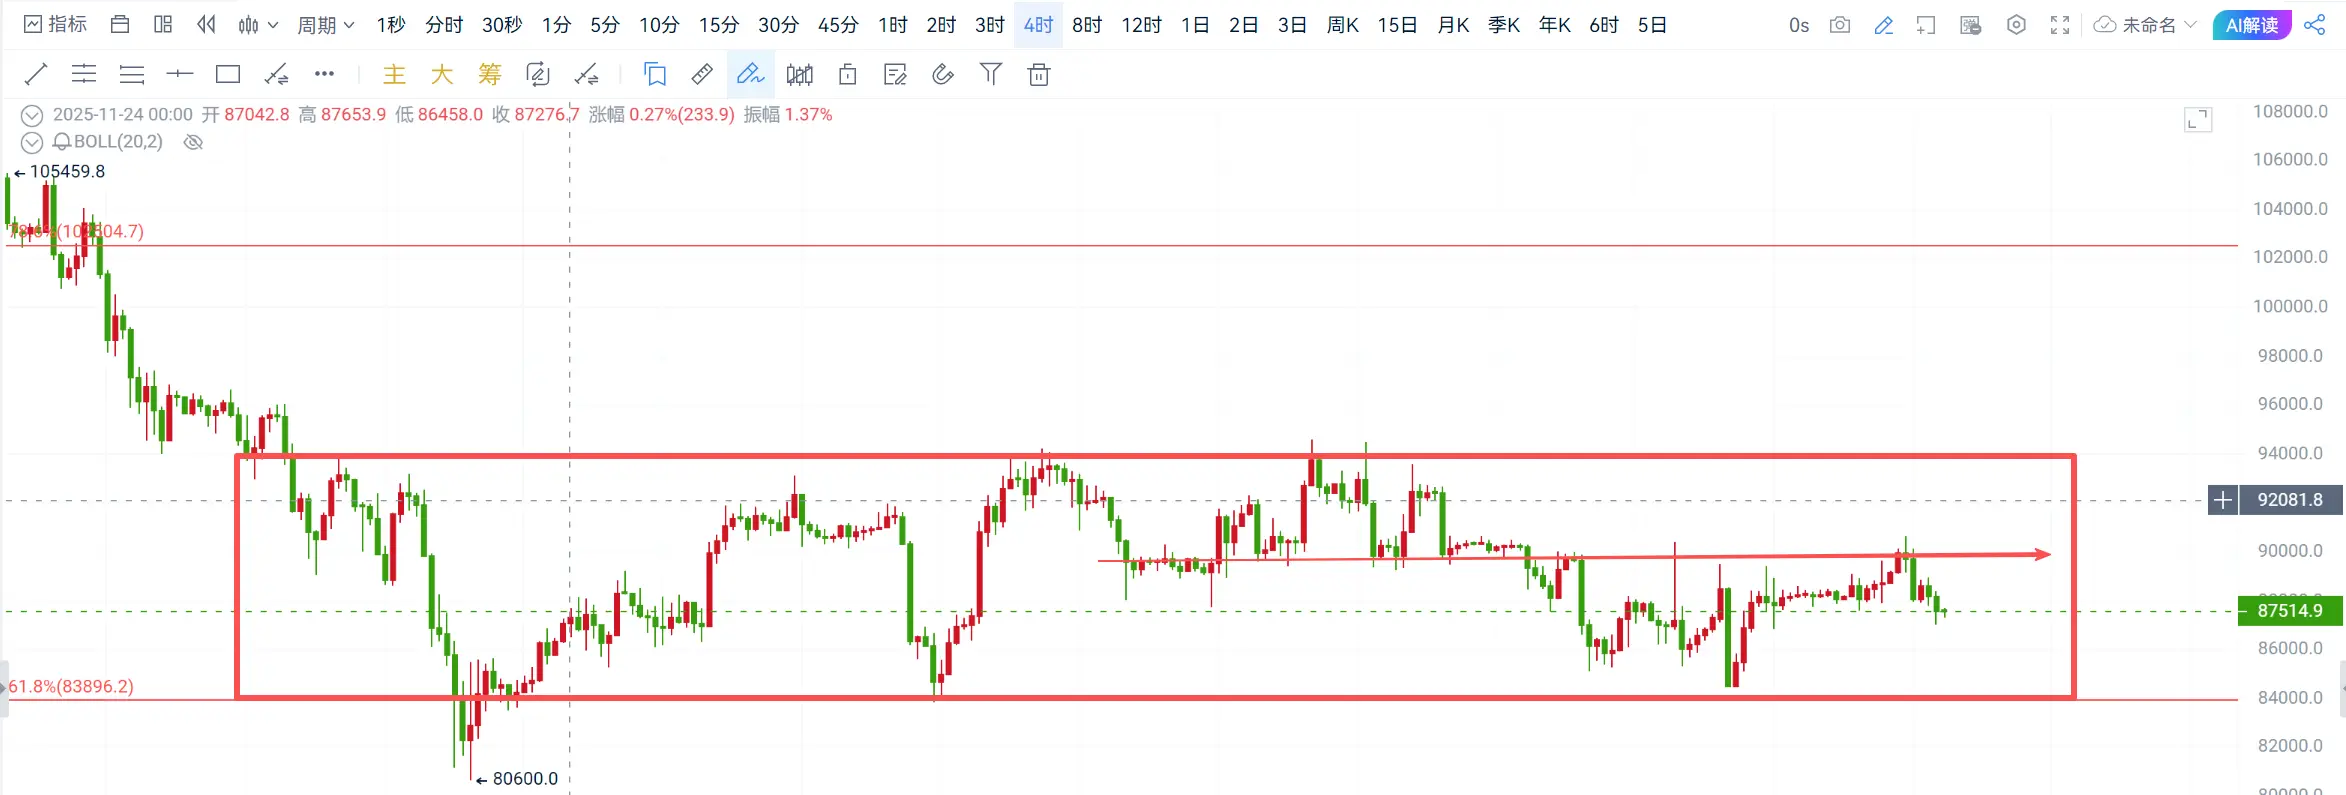
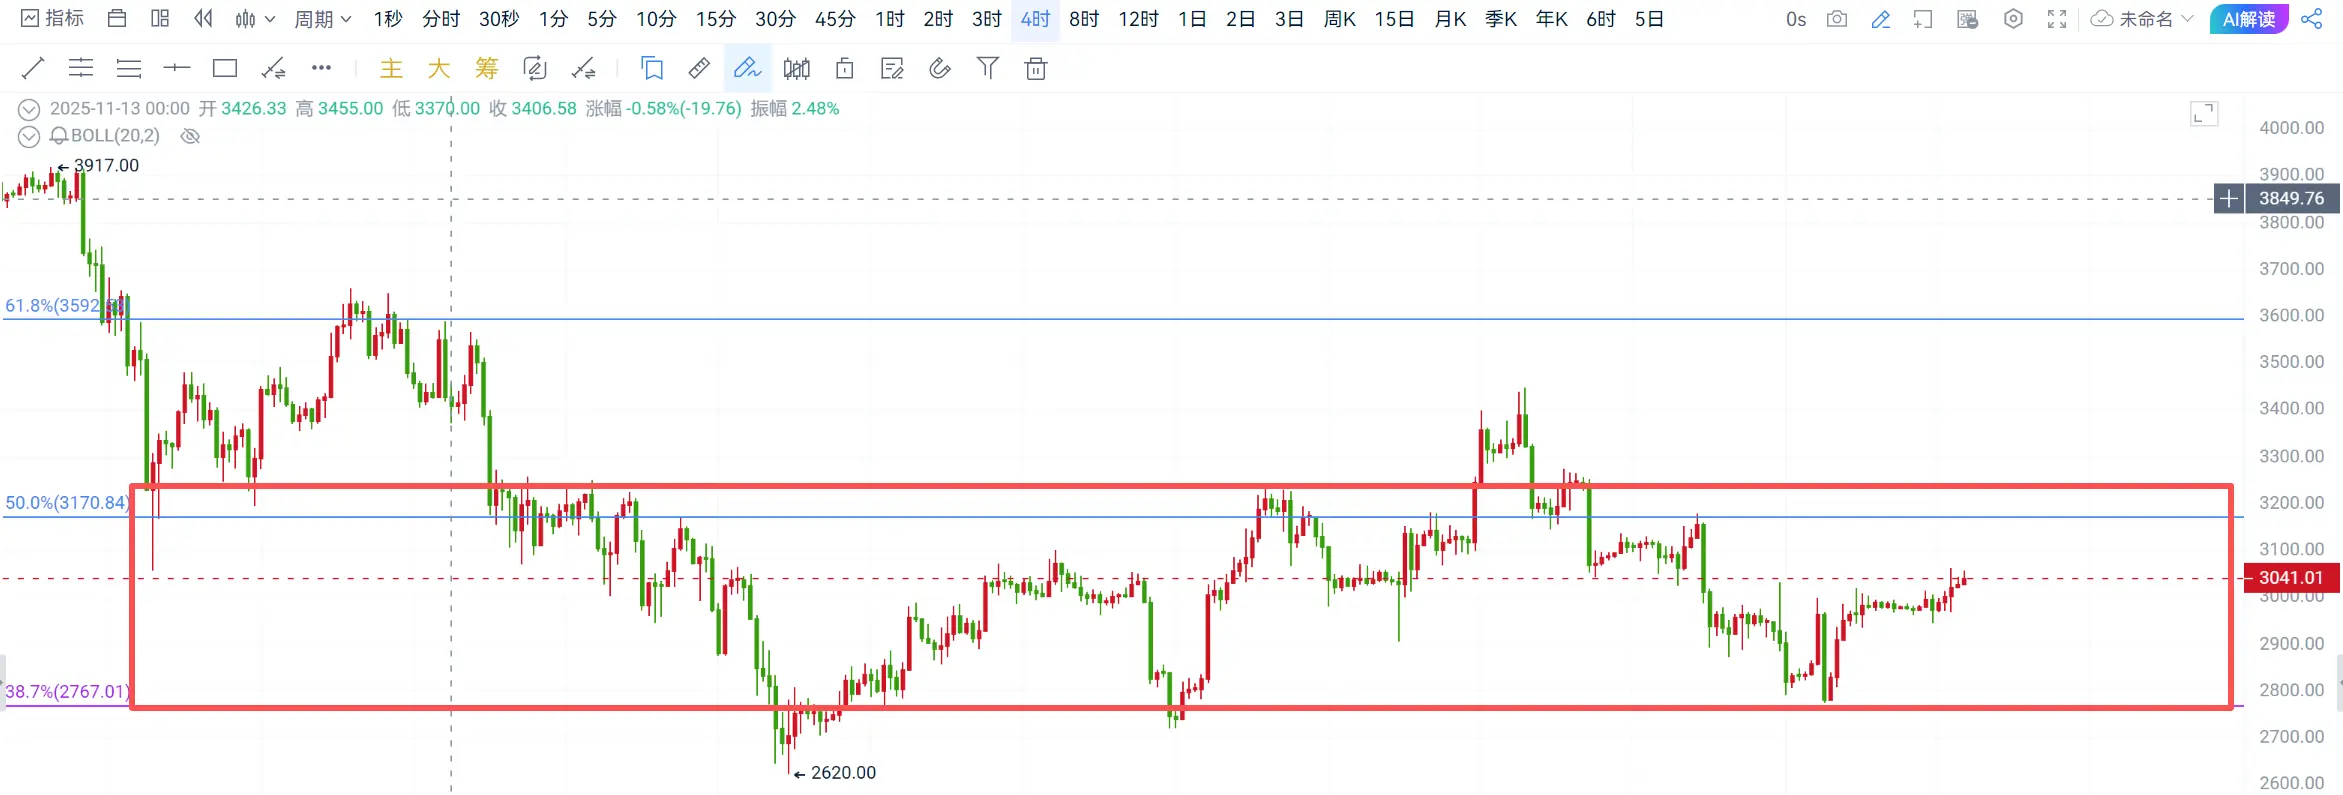
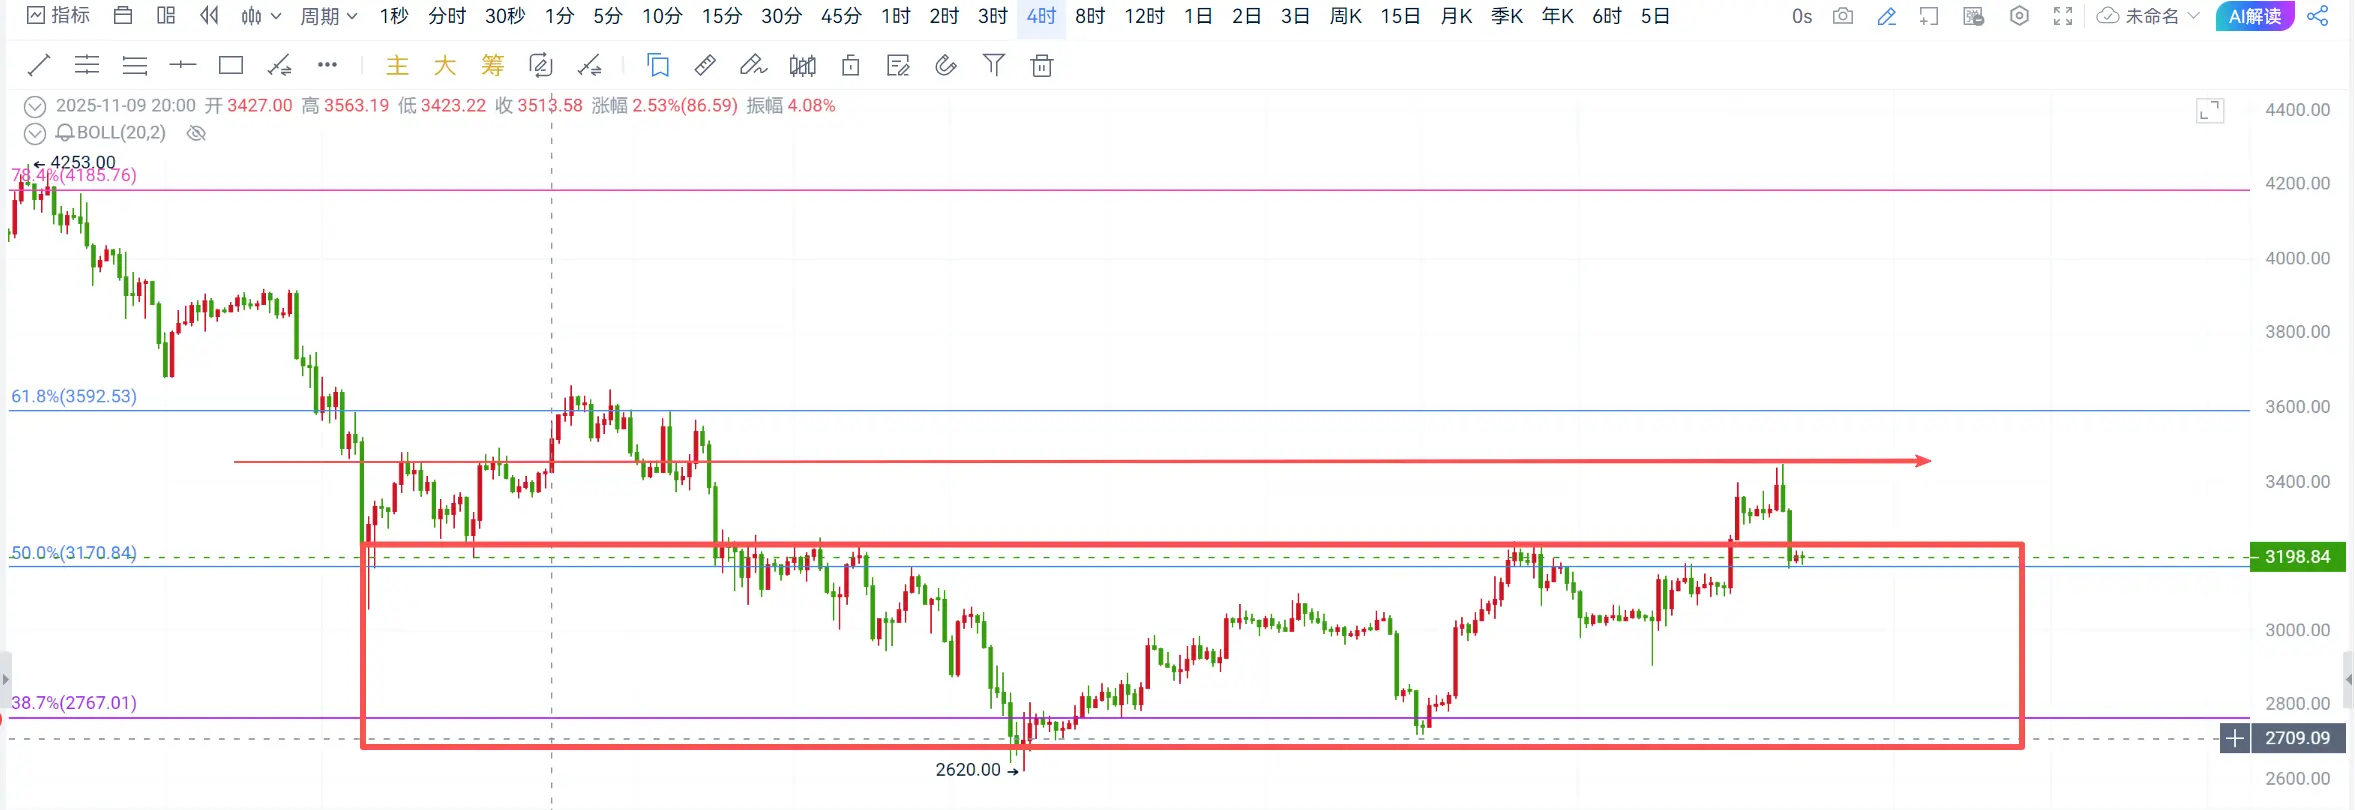
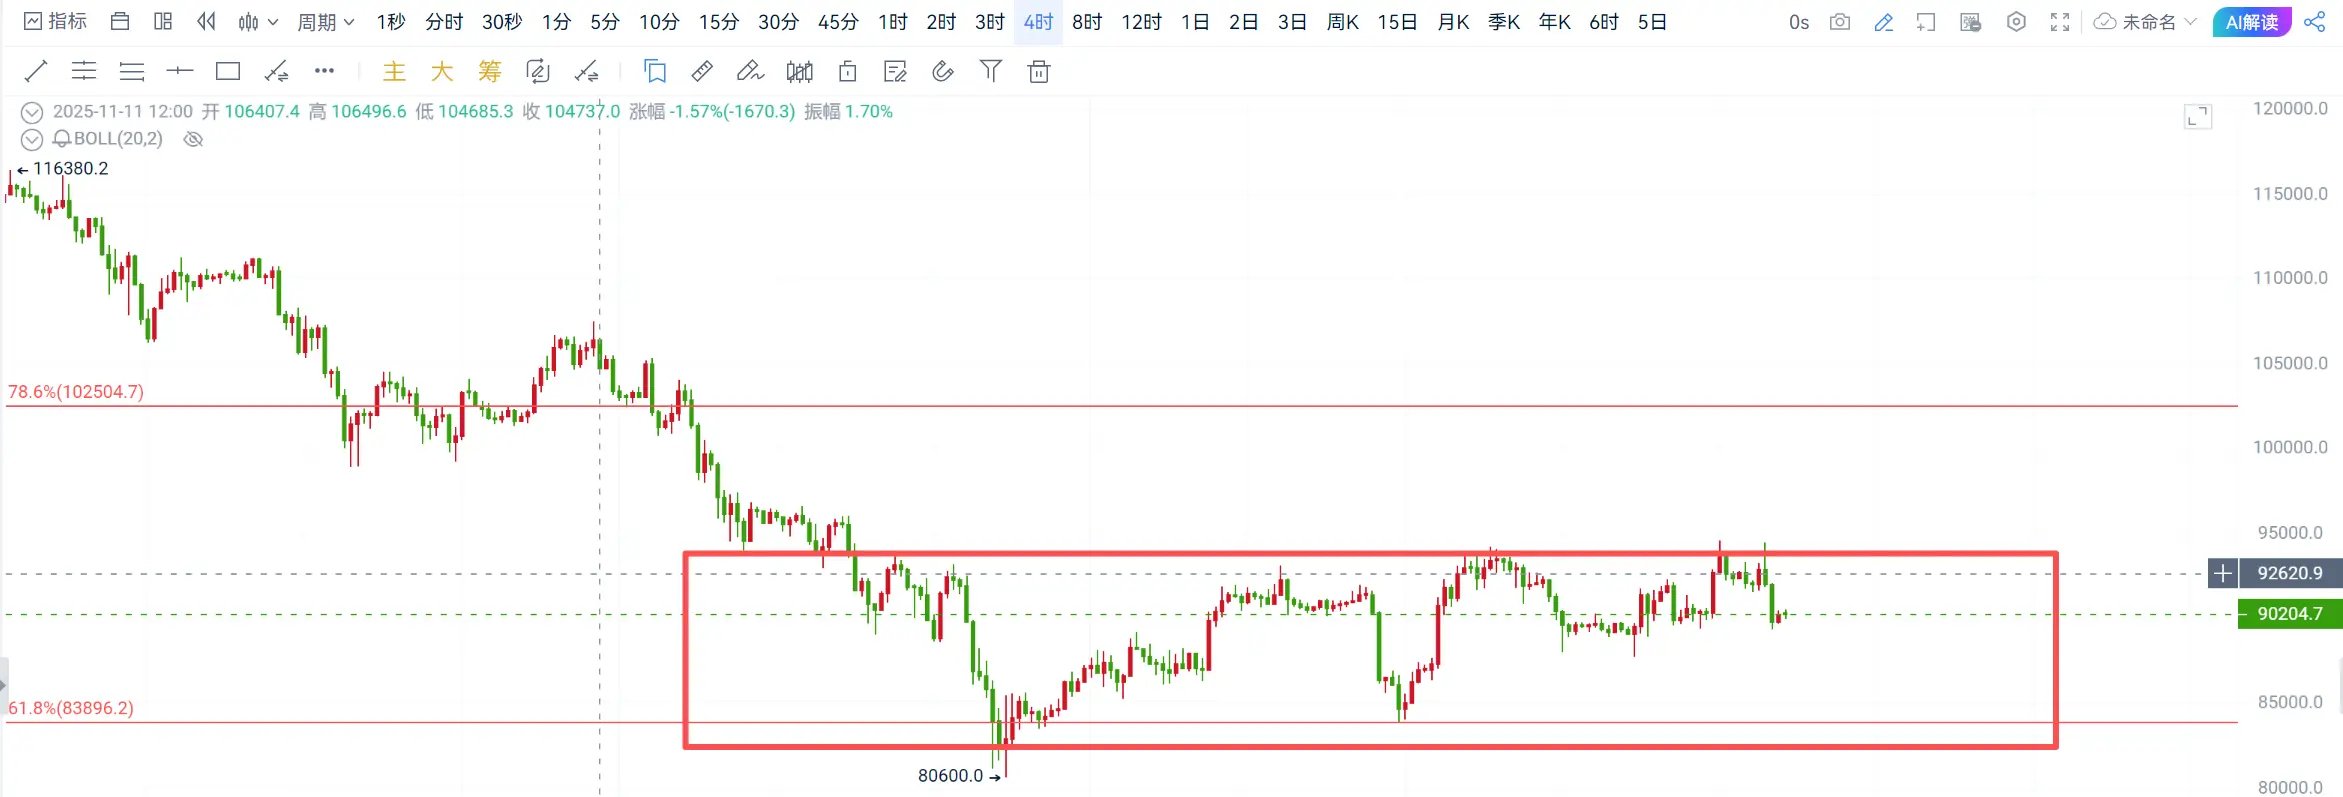
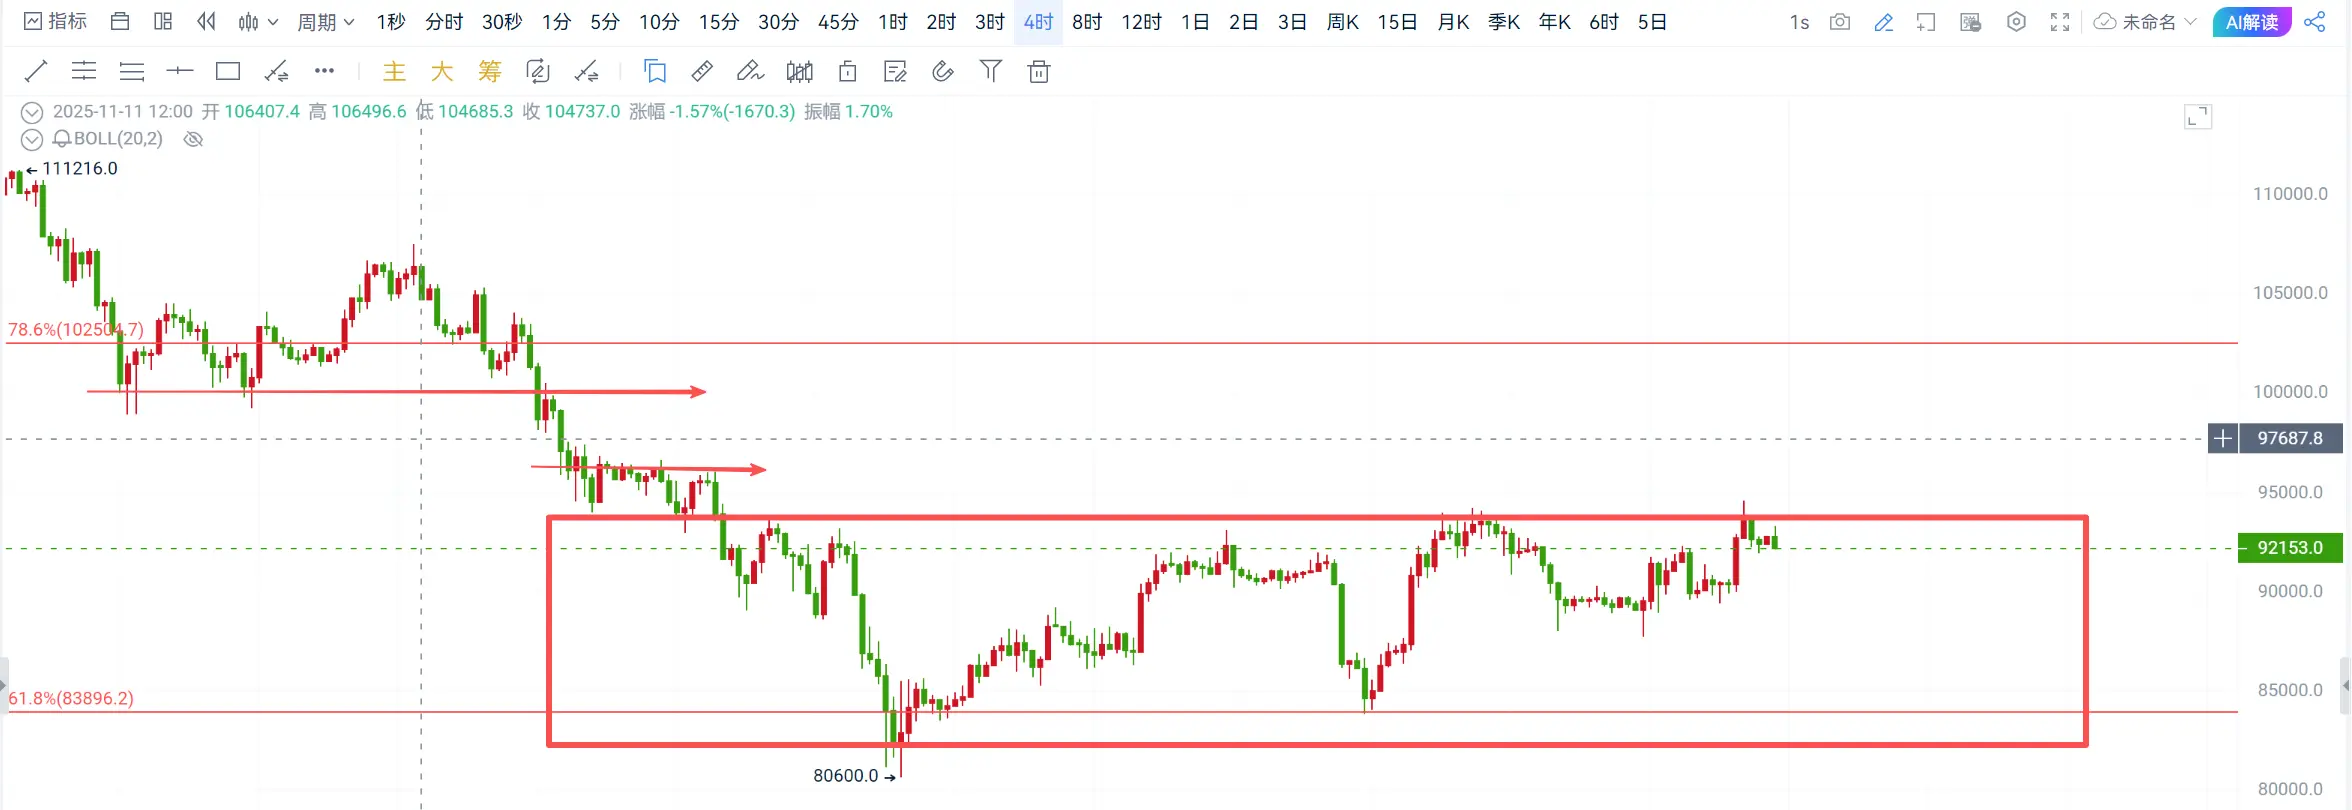
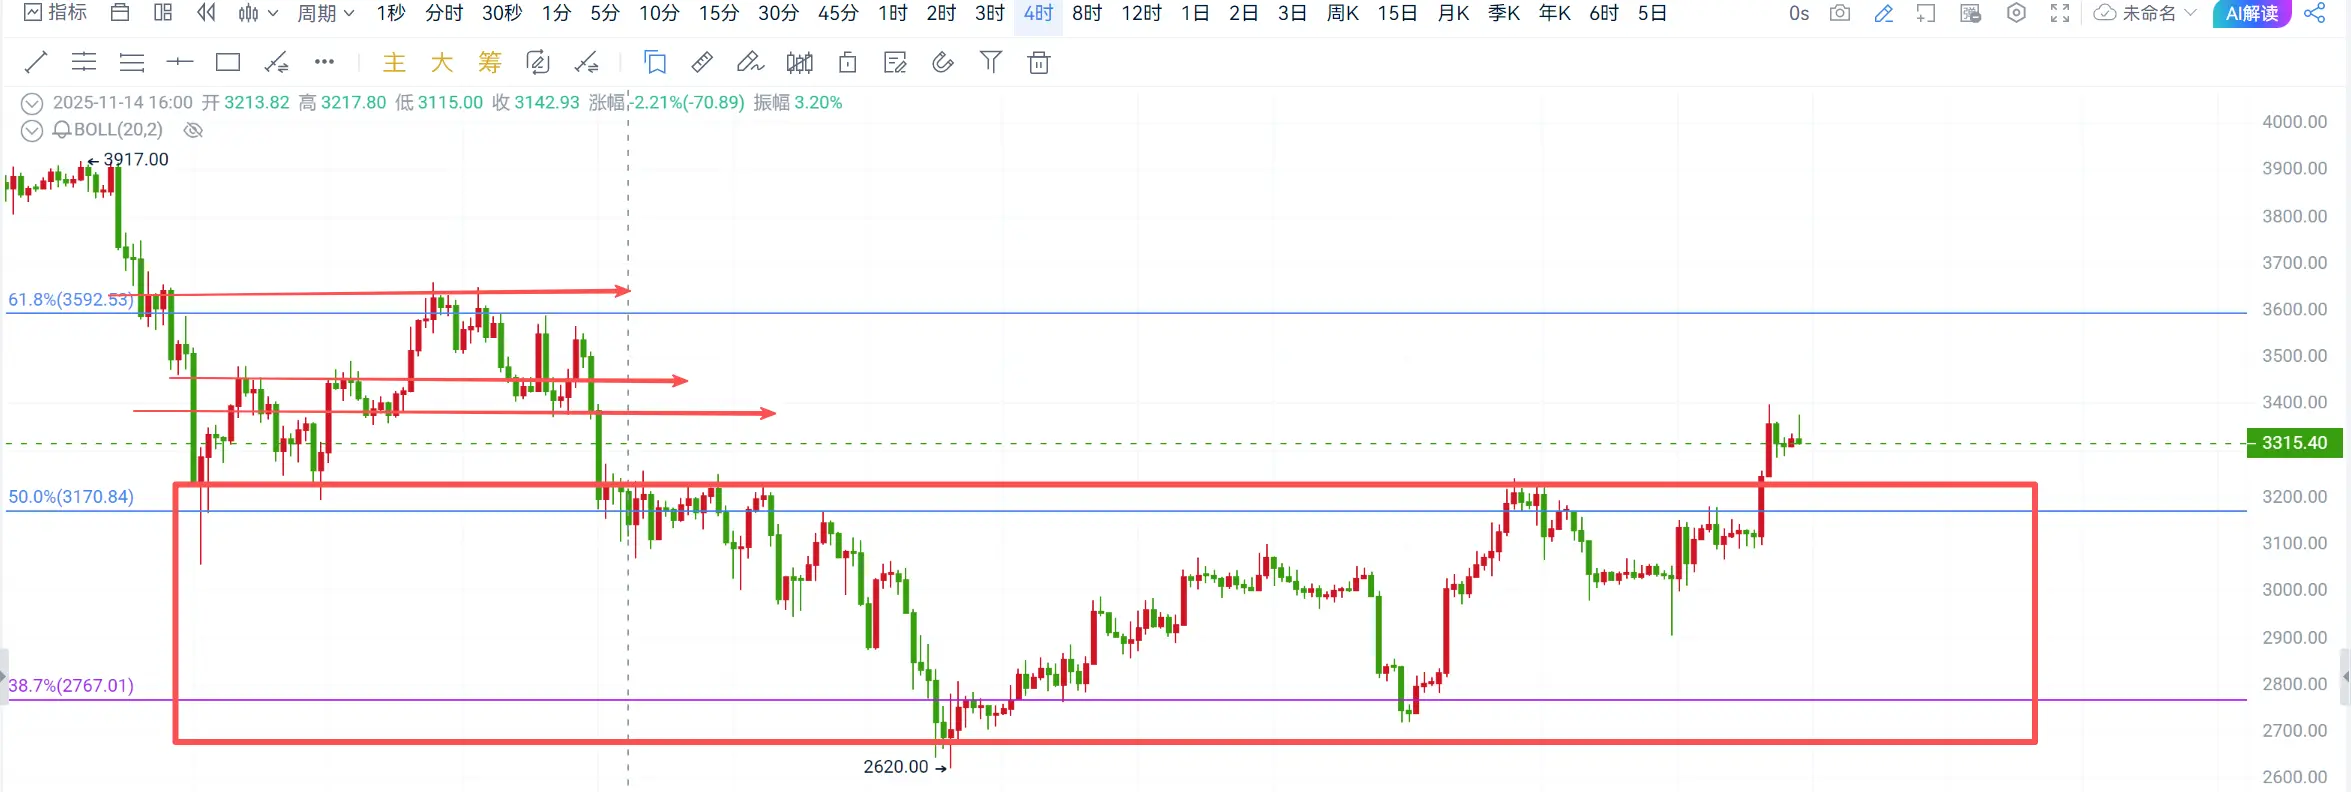
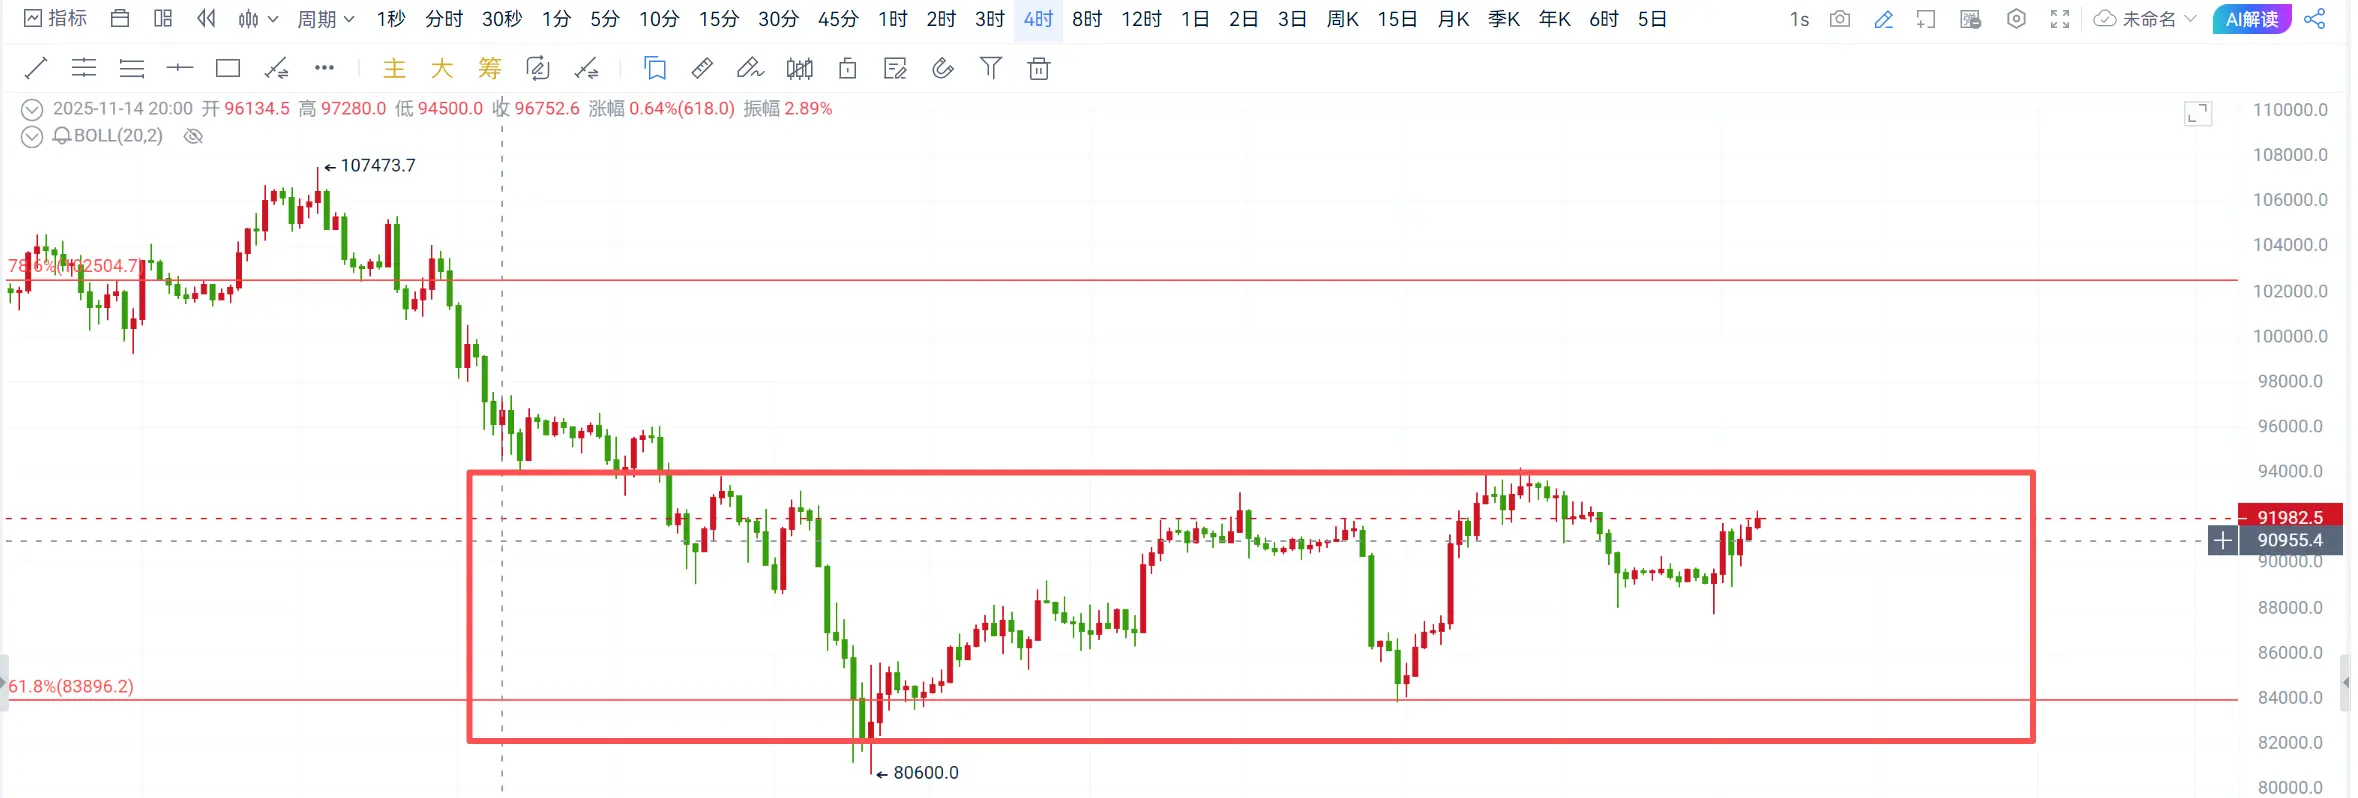
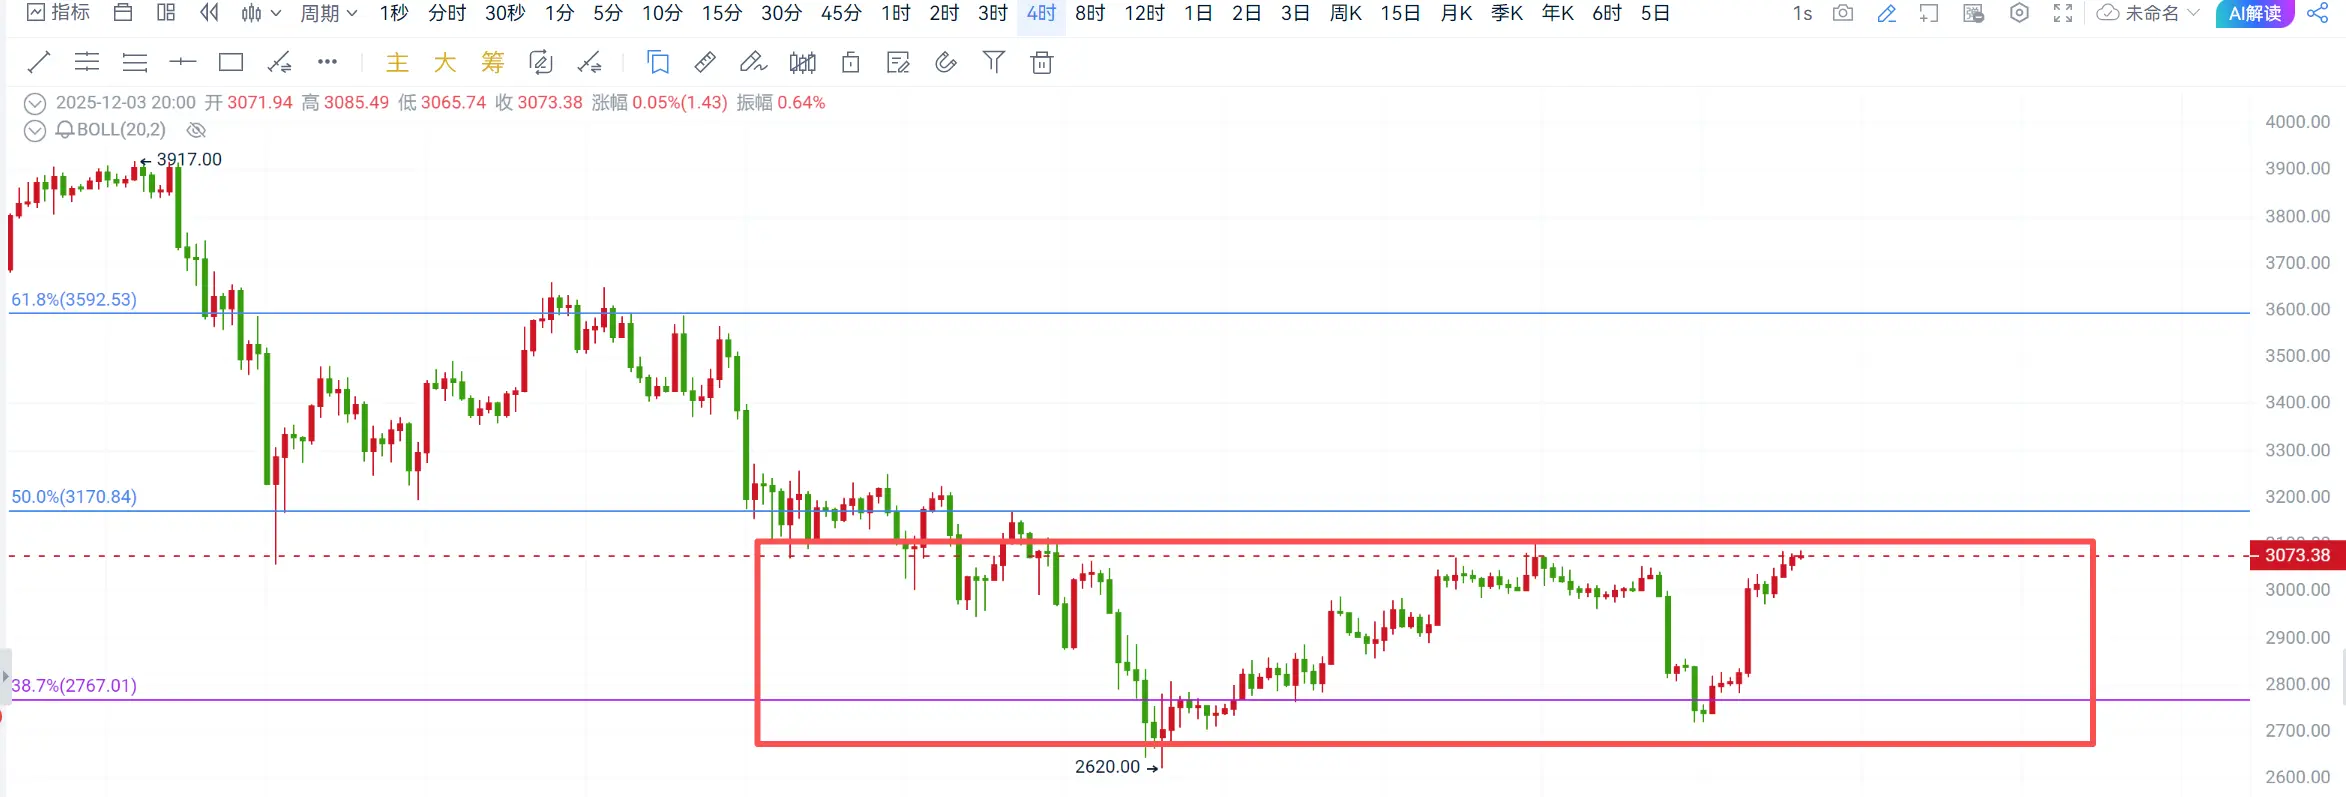
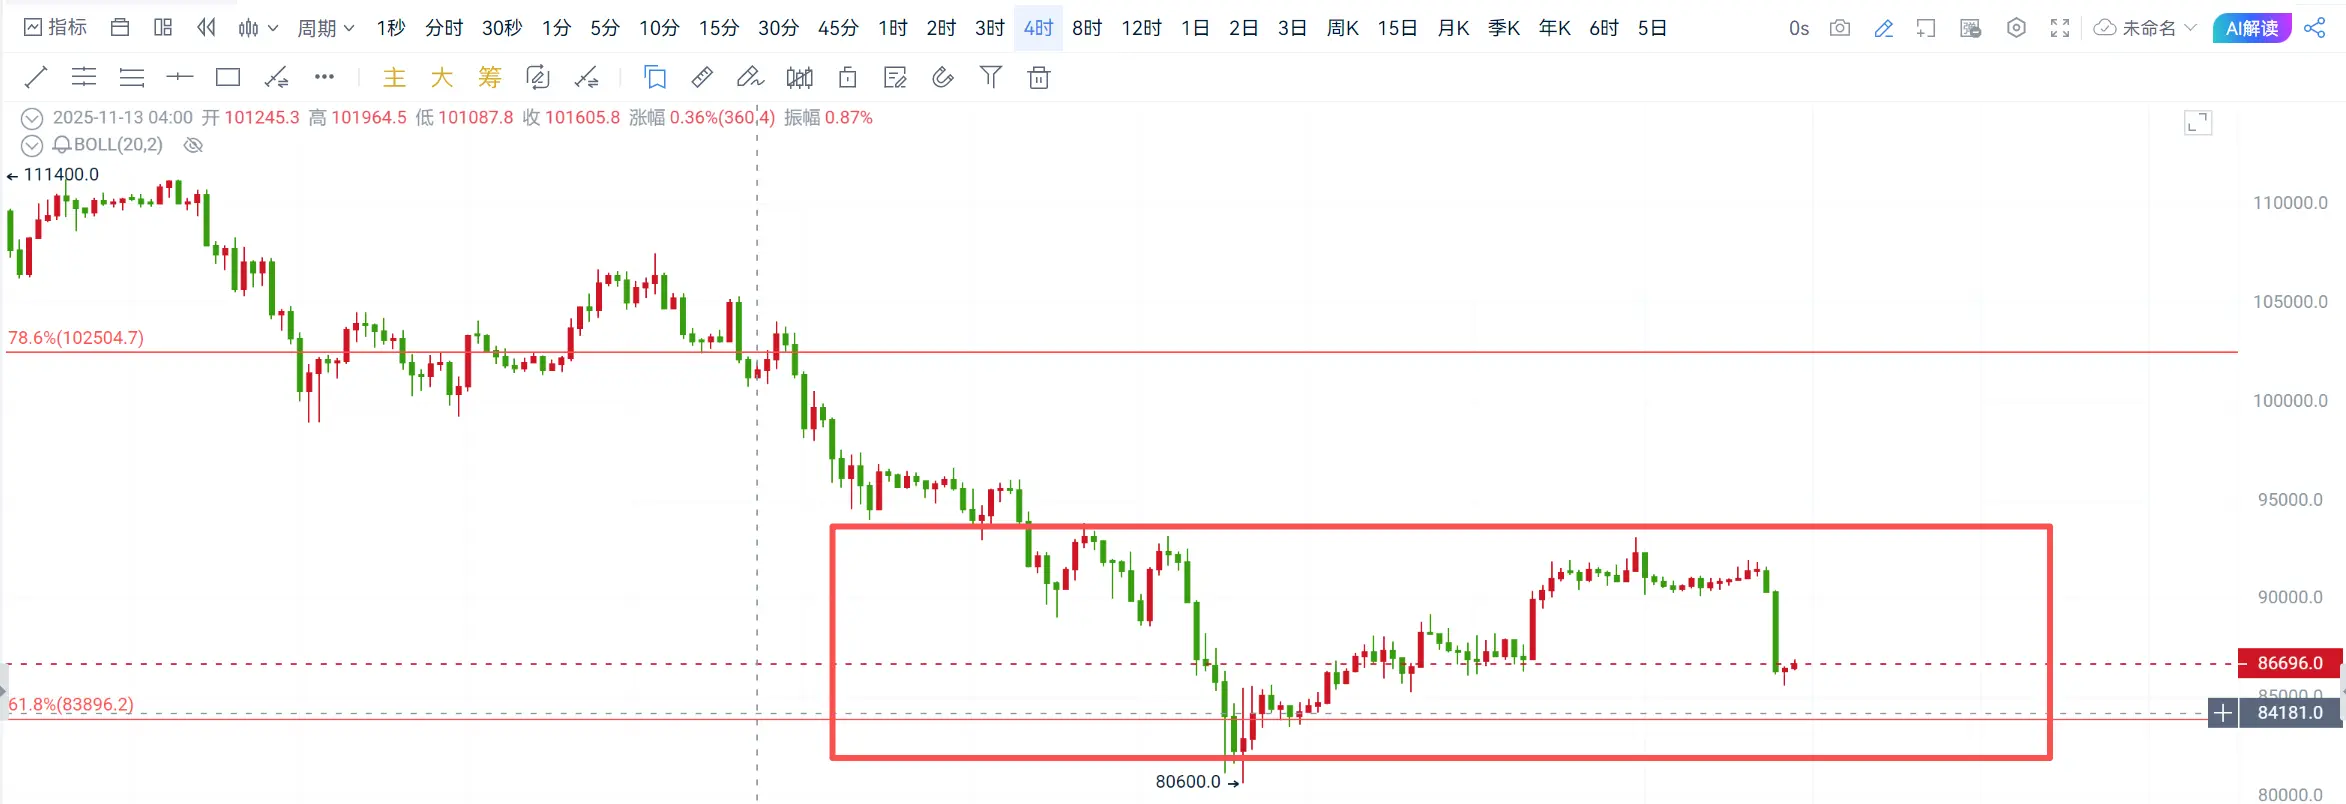
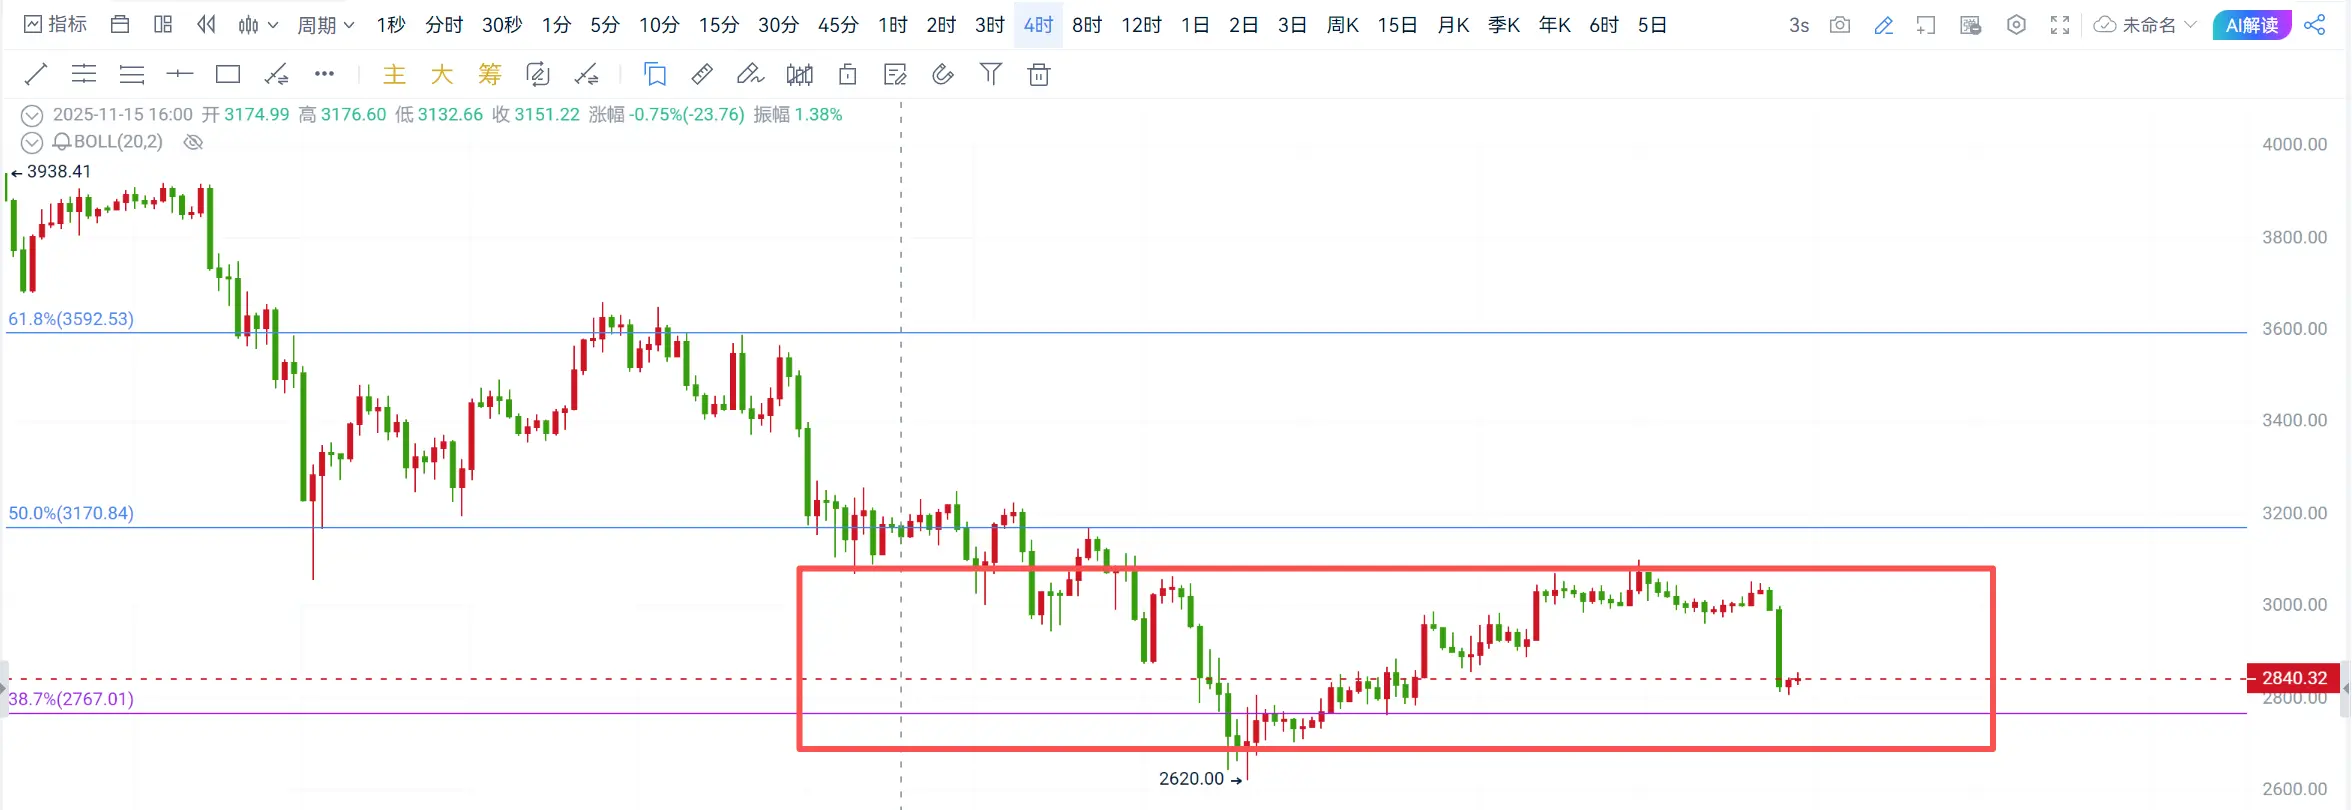
On the 4-hour chart, Bitcoin appears to be approaching the top of the box structure. As mentioned yesterday, breaking the intermediate resistance at 90,000 could target 94,500. Currently, 90,000 can be converted into support. Yesterday’s long positions were successfully entered and exited profitably. Ethereum also performed as expected, breaking above the resistance at 3,030 but facing brief resistance between 3,170-3,230. Based on the breakout situation, the target can be gradually extended to 3,320-3,420!
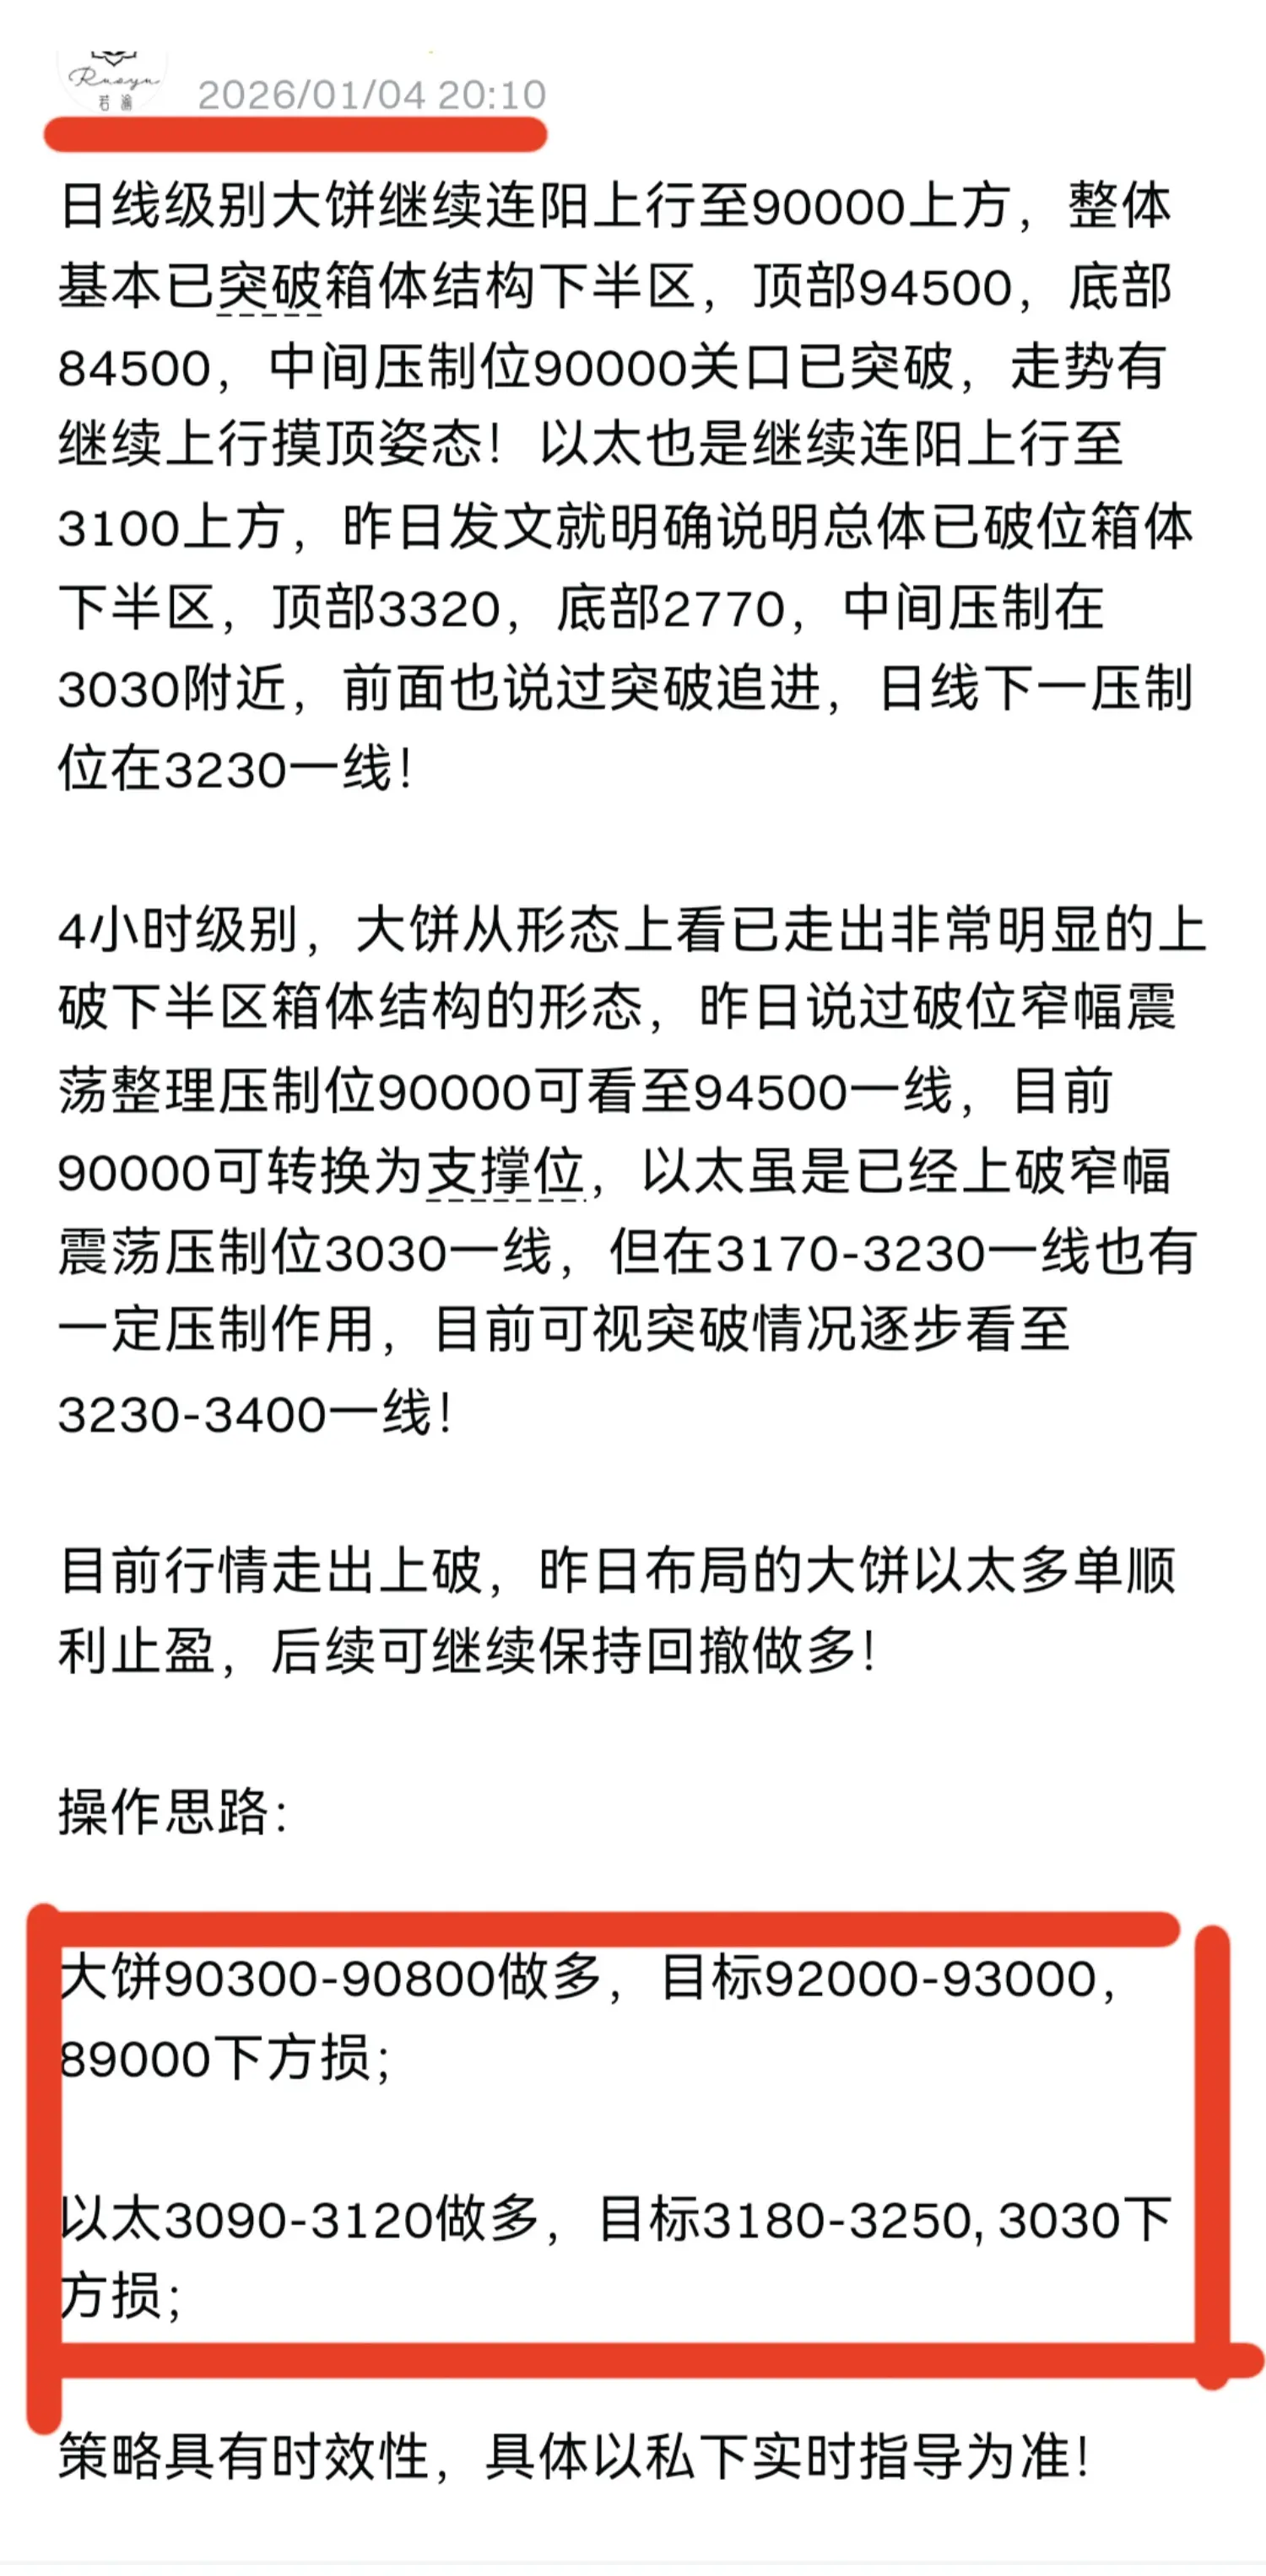
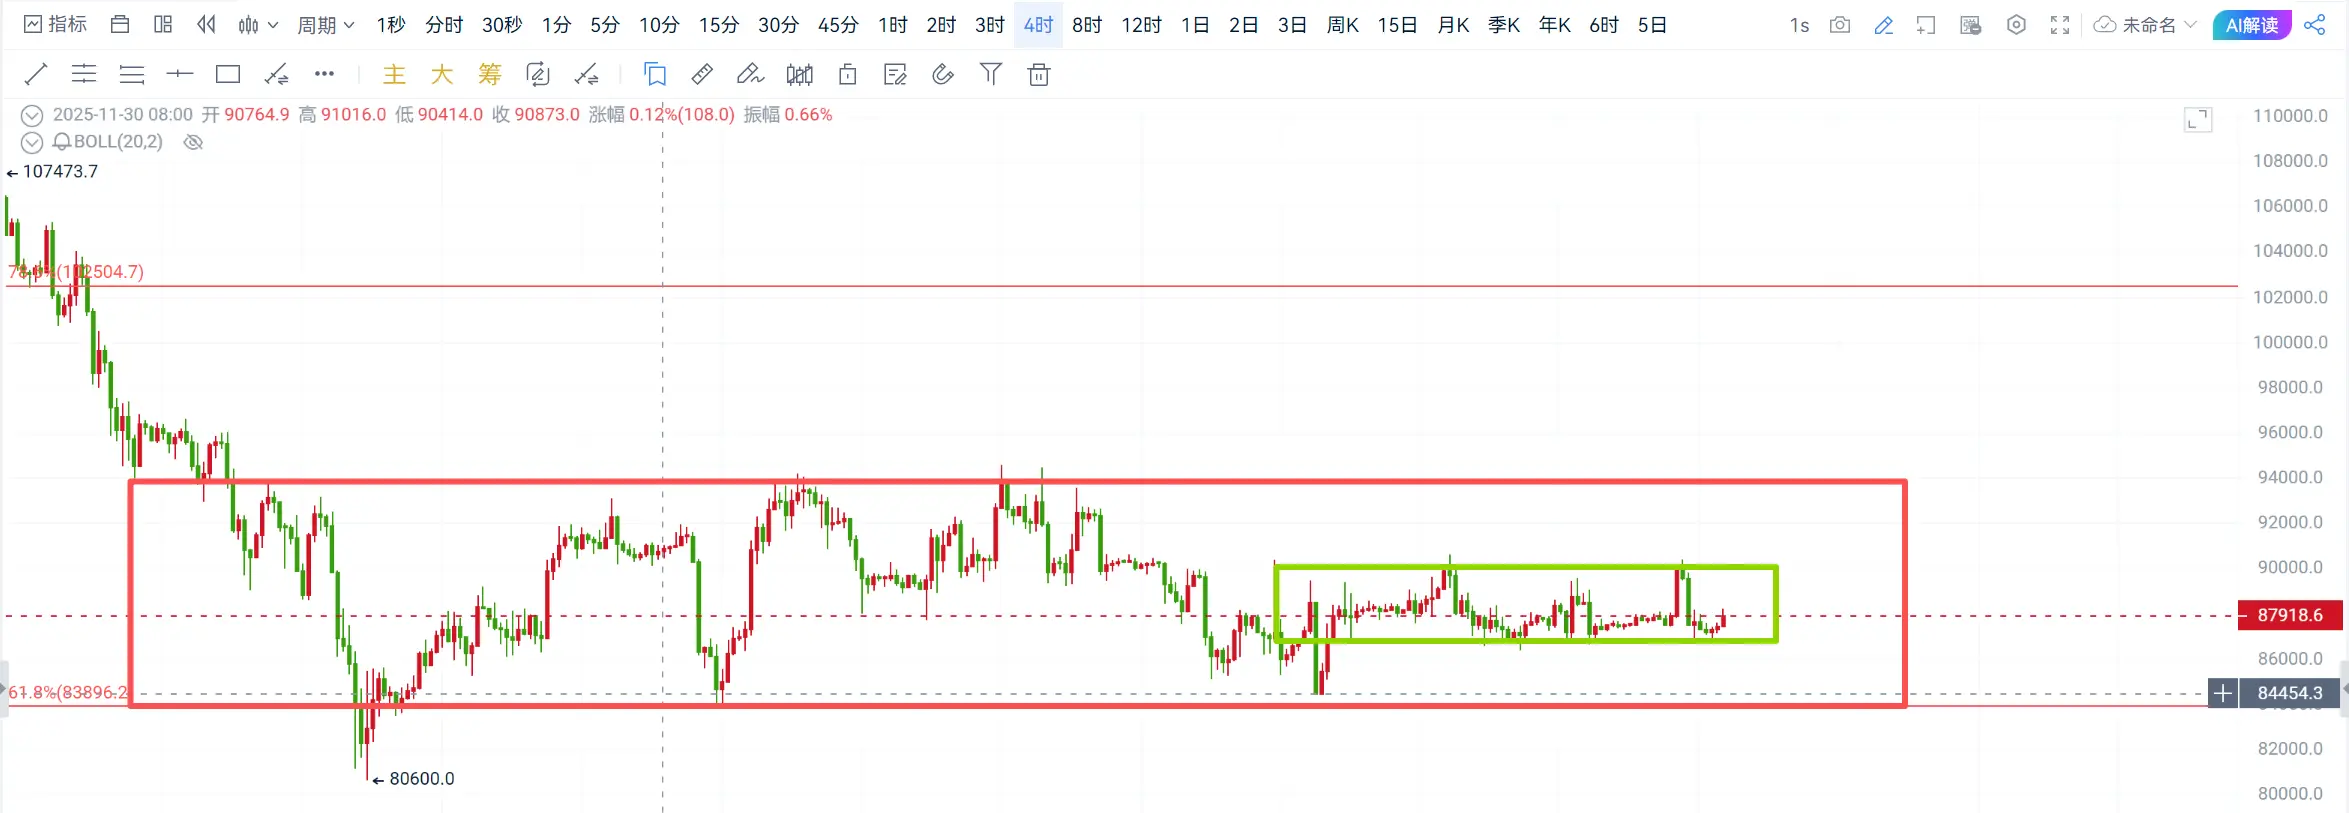
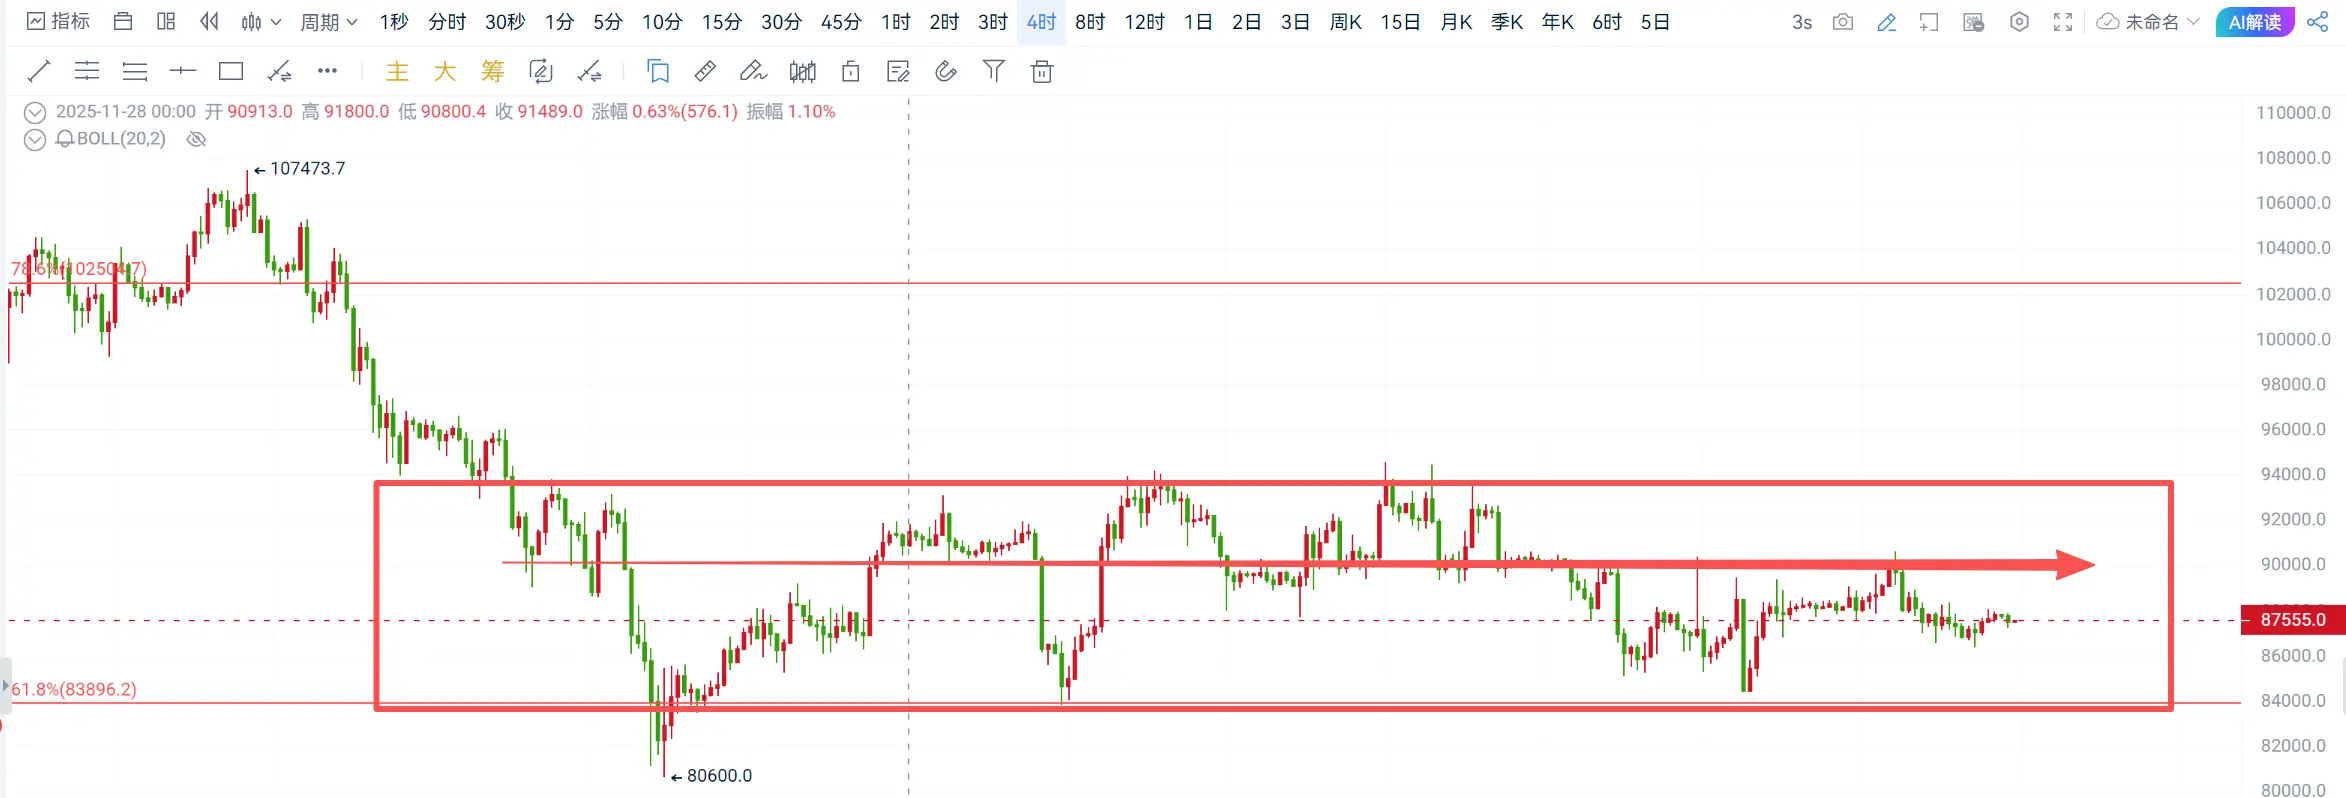
The market is currently showing a breakout but has not yet reached the top of the box. Yesterday’s long positions on Bitcoin and Ethereum were successfully closed with profits. You can continue to look for pullbacks to go long!
Trading strategy:
Buy Bitcoin at 91,500-92,000, targeting 93,000-94,000, with a stop below 90,500;
Buy Ethereum at 3,100-3,130, targeting 3,220-3,320, with a stop below 3,050;
Strategies are time-sensitive; specific guidance will be provided privately in real-time!
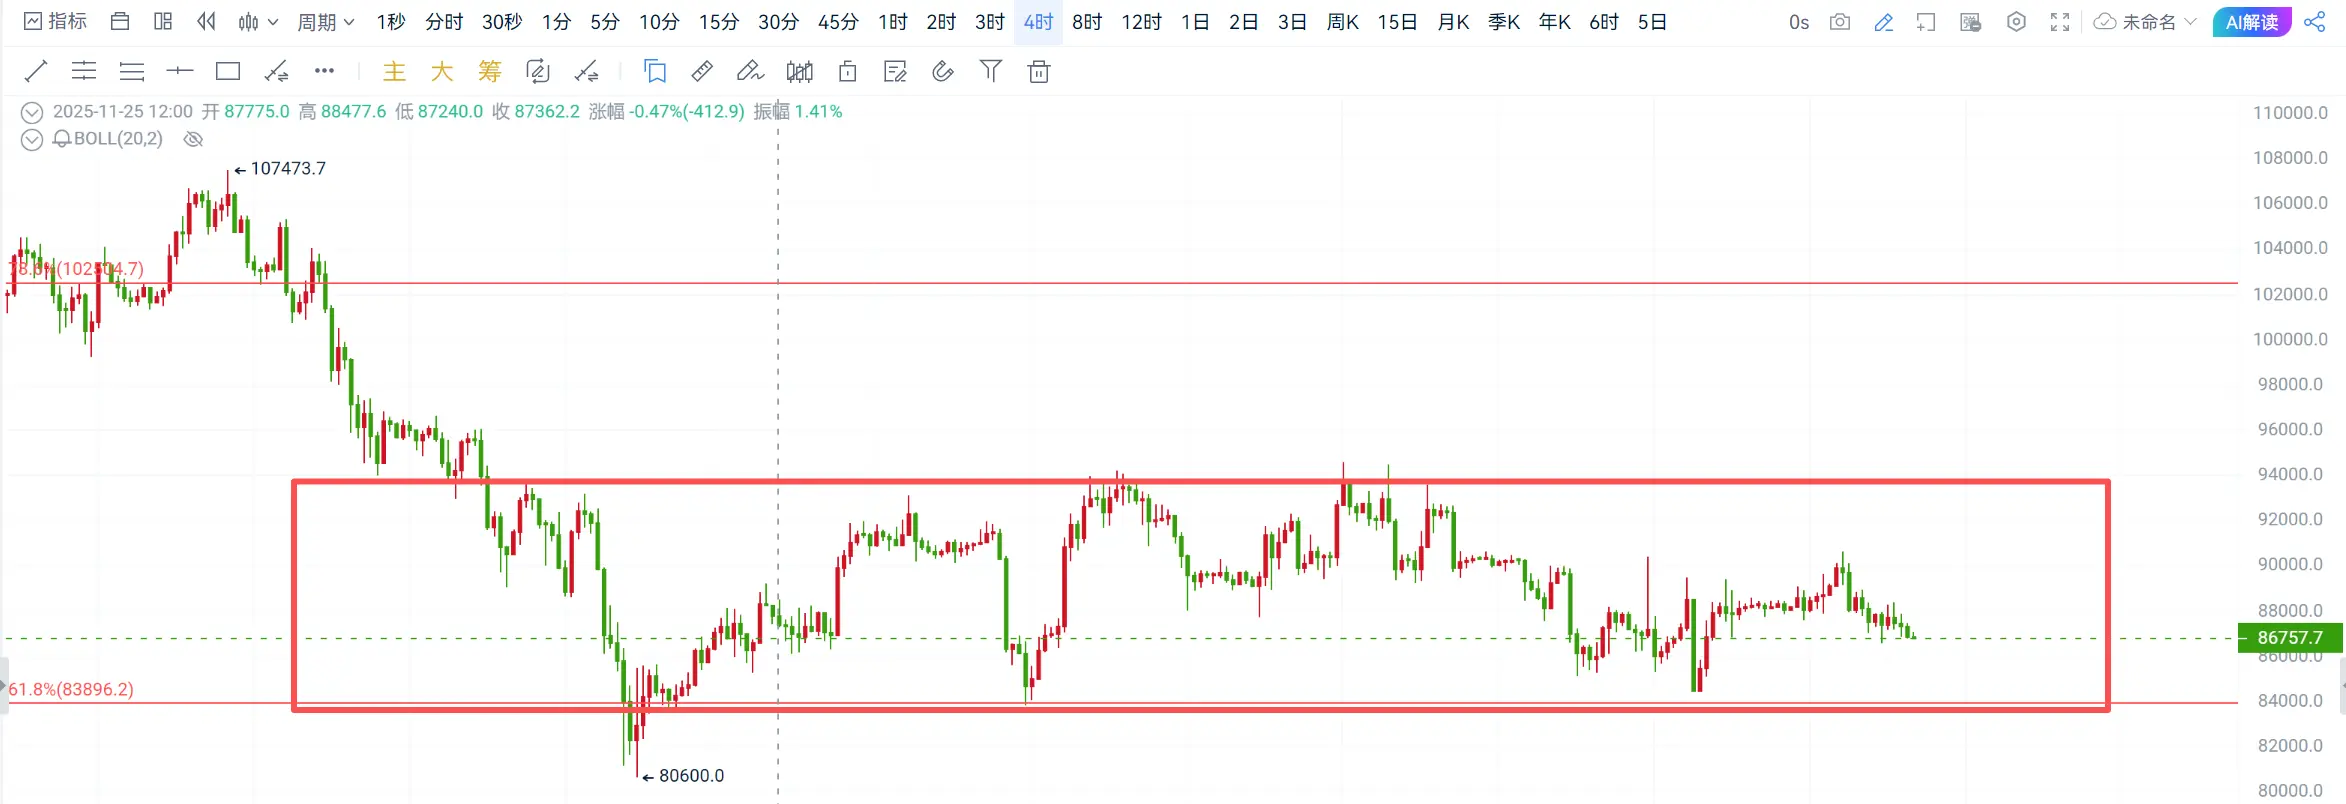
On the 4-hour chart, Bitcoin appears to be approaching the top of the box structure. As mentioned yesterday, breaking the intermediate resistance at 90,000 could target 94,500. Currently, 90,000 can be converted into support. Yesterday’s long positions were successfully entered and exited profitably. Ethereum also performed as expected, breaking above the resistance at 3,030 but facing brief resistance between 3,170-3,230. Based on the breakout situation, the target can be gradually extended to 3,320-3,420!
The market is currently showing a breakout but has not yet reached the top of the box. Yesterday’s long positions on Bitcoin and Ethereum were successfully closed with profits. You can continue to look for pullbacks to go long!
Trading strategy:
Buy Bitcoin at 91,500-92,000, targeting 93,000-94,000, with a stop below 90,500;
Buy Ethereum at 3,100-3,130, targeting 3,220-3,320, with a stop below 3,050;
Strategies are time-sensitive; specific guidance will be provided privately in real-time!