51QuantitativeStrategy
vip
Age 8.1 Yıl
Peak Tier 3
Quant Trader
No content yet
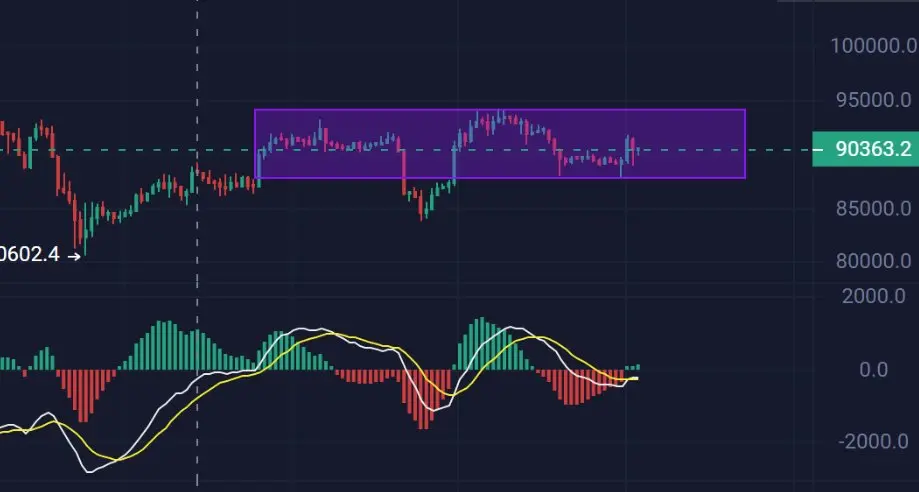
December 19, 2025 $BTC The current market is in a clear downtrend. Brief rebound attempts have been suppressed by the bears, and technical indicators (MACD, RSI) along with price structure all support a downward trend.
Resistance levels (need to break through to ease downward pressure):
1. Recent high resistance: $88,533 (highest point of the 197th K-line). This is the starting point of the recent strong sell-off and a key resistance.
2. Moving average resistance/psychological level: $87,200 - $87,900 area (near the slow EMA and previous small platform).
3. Strong resistance: $89,
BTC-0.99%
View Original
  • Reward
  • Comment
  • Repost
  • Share
December 18, 2025 $SOL 4-hour timeframe is in a downtrend, but in the short term, it may enter a consolidation phase with oscillations during the decline.
Key Level Analysis:
Resistance Levels (Key Pressure):
1. Recent oscillation upper boundary: 128.00–130.00 zone. This is the recent rebound high point (December 16), and also where the fast EMA line and previous small platform are located. A volume breakout above this zone would ease short-term downward pressure.
2. Strong resistance zone: 135.00–137.00. This is the dense trading area formed on December 11–12 and the previous rebou
SOL-2.18%
View Original
  • Reward
  • Comment
  • Repost
  • Share
December 18, 2025 $ETH The 4-hour timeframe is in a major downtrend, but due to severe short-term overselling, it has entered a weak consolidation phase with oscillations.
Key level analysis:
Resistance levels above (from strong to weak):
1. EMA moving average band (~2908 2975): This is the most recent and direct technical resistance zone. Any rebound will first face strong selling pressure in this area.
2. Previous low turned resistance ~2945-2965: The lower boundary of the consolidation platform formed on December 16-17, which becomes resistance after being broken.
3. Psy
ETH-0.25%
View Original
  • Reward
  • Comment
  • Repost
  • Share
December 17, 2025 $BTC Comprehensive Trend Judgment: Weak rebound/oscillation within a downtrend
The 4-hour timeframe remains clearly in a downtrend. The current rebound (86000 -> 88000) lacks volume support and is constrained by key moving averages and price levels, and should be viewed as a technical rebound or low-level oscillation within a downtrend, rather than a trend reversal.
Key Level Analysis
Resistance levels above (must focus on and break through to reverse the short-term decline):
1. First resistance: 88500 - 89000 area. This is where the ema_slow moving average (currently
BTC-0.99%
View Original
  • Reward
  • Comment
  • Repost
  • Share
December 16, 2025 $BTC is in a clear 4-hour downtrend. All major technical indicators (EMA bearish alignment, MACD weakening below zero, RSI entering oversold territory) support this assessment. Although short-term indicators show oversold conditions that may trigger a technical rebound, the trend remains bearish until the price effectively breaks above key resistance levels (such as 89,500).
Operational advice: Trend traders should mainly consider shorting on rallies or staying on the sidelines. If aiming for a rebound, closely monitor resistance levels above and set strict stop-loss orders.
BTC-0.99%
View Original
  • Reward
  • Comment
  • Repost
  • Share
2025/12/15 $SOL Key Observation Points:
Bearish: If the price fails to stay above $130 and breaks below $129 with increased volume, the downward trend will continue, with the next target potentially at $127 or lower.
Bullish: If the price can sustain support in the $129-$130 region and shows divergence signals in StochRSI and RSI, along with a volume breakout above $134-$135, a substantial rebound may occur, with targets around $138-$140.
SOL-2.18%
View Original
  • Reward
  • Comment
  • Repost
  • Share
2025/12/15 $BTC BTC is currently in a clear downtrend, and momentum is strengthening.
Key observation points:
Bearish signals: If the price effectively breaks below 87,500 with increased volume, the downtrend will continue, with the next target in the 85,000-86,000 range.
Bullish/Rebound signals: The price needs to rebound strongly and hold above 90,500 (slow EMA), and the MACD histogram must start contracting and turn positive, to initially ease the downward pressure.
BTC-0.99%
View Original
  • Reward
  • Comment
  • Repost
  • Share
December 15, 2025 $SOL 4-hour timeframe is currently in a clear downtrend, but recent signs of stabilization and rebound at lower levels have appeared. Overall, it can be defined as a weak rebound or consolidation within a downtrend, and a reversal has not yet formed.
Key observation points:
Bearish scenario: If the price fails to stay above $130 and breaks below $129 with increased volume, the downtrend will continue, with the next target possibly around $127 or lower.
Bullish/Rebound scenario: If the price can sustain support in the $129-130 region and shows bullish diverge
SOL-2.18%
View Original
  • Reward
  • Comment
  • Repost
  • Share
2025/12/15 Currently, $ETH the 4-hour timeframe is in a weak oscillation pattern dominated by a bearish trend. In terms of operation, it is recommended to remain cautious within the 3050-3130 range and wait for the market to choose a direction. A breakout above 3130 can be considered as a light long position with a target of 3180; a breakdown below 3050 may lead to further downside, so risk prevention is necessary. Until the direction is clear, heavy positions should be avoided. #BTC # ETH #SOL
ETH-0.25%
BTC-0.99%
SOL-2.18%
View Original
  • Reward
  • Comment
  • Repost
  • Share
2025/12/12 $ETH The 4-hour timeframe is in a healthy upward correction phase, with technical indicators well recovered, and the bulls are in control. Traders should focus on the breakthroughs of the 3180 support and 3280 resistance levels, which will determine the main direction in the next phase.
#BTC #ETH #SOL
ETH-0.25%
View Original
  • Reward
  • Comment
  • Repost
  • Share
December 12, 2025 $ETH The 4-hour level is in a healthy consolidation phase after a rally, with technical indicators well-repaired, and the bulls are in control. Traders should focus on the breakout of the 3180 support and 3280 resistance, as this will determine the main direction in the next phase.
Operational suggestions (for reference only)
Bullish Strategy: If the price volume-breaks above 3280, it can be seen as a signal that the consolidation has ended and the rally has restarted. Consider following in, with targets at 3330 and 3435. Stop-loss can be set below the low of the breako
ETH-0.25%
View Original
  • Reward
  • Comment
  • Repost
  • Share
December 12, 2025 $BTC Currently in a high-level oscillation pattern, it is recommended to sell high and buy low within the 91,500-94,000 range, and closely monitor the breakout direction of this range. A breakout above 94,500 indicates a bullish trend, while a break below 91,500 warrants caution for further deepening of the correction. Due to the recent extreme shrinking of K-line volume, indicating an imminent directional choice, please pay close attention to subsequent K-line volume expansion.
Key resistance levels:
Resistance 1: 93,800 94,000: Recent rebound highs forming a pressur
BTC-0.99%
View Original
  • Reward
  • Comment
  • Repost
  • Share
December 12, 2025 $BTC Currently in a high-level oscillation pattern
It is recommended to buy low and sell high within the 91,500-94,000 range, and closely monitor the breakout direction of the range.
A breakout above 94,500 indicates a bullish trend, while a breakdown below 91,500 warrants caution for a deeper correction. Due to the latest K-line volume shrinking drastically, it suggests an imminent directional choice. Please stay tuned for subsequent K-line volume developments. #BTC # ETH #SOL
BTC-0.99%
View Original
  • Reward
  • Comment
  • Repost
  • Share
$BTC The market is most likely to continue fluctuating within the broad range of 89,000-94,500.
It is recommended to closely monitor the price reaction at key support/resistance levels, as well as whether the MACD can form a bullish crossover above the zero line or if the RSI enters the oversold area and shows divergence to signal the next trend direction. Currently, the main strategy is to wait and see or to buy low and sell high within the range (with light positions and stop-losses set).
#BTC #ETH
BTC-0.99%
ETH-0.25%
View Original
  • Reward
  • Comment
  • Repost
  • Share
$SOL 4-hour timeframe is in a high-level consolidation pattern. Traders should focus on the wide range between $132 and $146; within this range, consider selling high and buying low, but set strict stop-losses. A breakout on either side of the range will indicate the next clear direction. Currently, market sentiment is leaning towards wait-and-see, awaiting a new catalyst. #SOL
SOL-2.18%
View Original
  • Reward
  • Comment
  • Repost
  • Share
#ETH is in a healthy pullback/consolidation phase within an uptrend. In terms of strategy, pay attention to the performance of the 3250-3280 support area. If it holds steady with increased trading volume, it would be a good opportunity for long entries or adding to existing positions. Stop-loss can be set below the 3180-3200 support zone. On the upside, closely watch the breakout of the 3360-3400 resistance area; if it breaks through, the next target can be set at $3500. If the price breaks below $3100 with high volume, the trend needs to be reassessed.
ETH-0.25%
View Original
  • Reward
  • Comment
  • Repost
  • Share
$BTC is at a critical juncture for choosing a direction. The recent improvement in the short-term MACD offers hope for a rebound, but a price breakout above the 91,500-92,000 resistance zone with increased volume is needed to confirm a renewed uptrend. Conversely, if the price falls below the 89,300-89,600 support, it may seek support again at the lower end of the range. Until a clear breakout in either direction occurs, it is advisable to adopt a buy-low, sell-high range-trading strategy and closely monitor changes in trading volume.
#BTC #ETH #SOL
BTC-0.99%
View Original
  • Reward
  • Comment
  • Repost
  • Share
$SOL In the current volatile market, it is suitable to go long near support levels and go short near resistance levels, with strict stop-loss settings.
Key resistance levels:
1. 144: EMA convergence area.
2. 146.91: The recent upswing high.
Key support levels:
1. 138: The area of multiple recent rebounds.
2. 135-136: Important bullish defense line.
3. 130.00 (psychological barrier)
SOL-2.18%
View Original
  • Reward
  • Comment
  • Repost
  • Share
#ETH is currently in a high-level consolidation trend. After a strong rebound, the market's upward momentum has weakened and entered a consolidation phase. Close attention should be paid to the breakout situations of the $3060-$3080 support zone and the $3220-$3250 resistance zone.
If there is a significant drop below $3060, a deeper correction may begin.
If there is a breakout above $3250 with volume, the upward trend may resume.
Within the range, consider selling high and buying low, but be sure to strictly control your position size.
ETH-0.25%
View Original
  • Reward
  • Comment
  • Repost
  • Share
2025/12/08 $BTC 4-hour timeframe is at a key stage of long-short battle, with short-term leaning towards consolidation. Bulls should watch for a breakout and hold above $92,500; bears should watch for effective breakdown of the $89,000 support accompanied by increased trading volume. #BTC # ETH #SOL
BTC-0.99%
View Original
post-image
post-image
  • Reward
  • Comment
  • Repost
  • Share
  • Trending TopicsView More
  • Pin
Trade Crypto Anywhere Anytime
qrCode
Scan to download Gate App
Community
  • 简体中文
  • English
  • Tiếng Việt
  • 繁體中文
  • Español
  • Русский
  • Français (Afrique)
  • Português (Portugal)
  • Bahasa Indonesia
  • 日本語
  • بالعربية
  • Українська
  • Português (Brasil)