# 2025 INTR Price Prediction: Expert Analysis and Market Forecast
This comprehensive report delivers in-depth INTR price forecasts spanning 2026-2031, integrating historical market analysis, supply-demand dynamics, and ecosystem development trends. The article addresses critical investment questions for cryptocurrency participants: current INTR market positioning, price trajectory projections, and actionable trading strategies. Designed for beginners, experienced traders, and institutional investors, this analysis examines INTR's cross-chain interoperability value proposition while identifying key risks including liquidity constraints and regulatory uncertainties. The report combines technical analysis, risk management frameworks, and expert recommendations through Gate.com trading insights, enabling readers to make informed investment decisions in this emerging DeFi infrastructure asset.
Introduction: Market Position and Investment Value of INTR
Interlay (INTR) is a decentralized network dedicated to connecting cryptocurrencies such as Bitcoin with DeFi platforms such as Polkadot and Ethereum. As of January 3, 2026, INTR has achieved a market capitalization of $531,100, with a circulating supply of approximately 229.99 million tokens, trading at around $0.0005311. This innovative asset, serving as a bridge protocol across multiple blockchain ecosystems, is playing an increasingly critical role in the cross-chain DeFi landscape.
The INTR token functions across multiple dimensions: governance, where token holders vote on protocol proposals; staking, enabling participants to earn rewards; transaction fee payments; and bridge security enhancement, providing additional value to token holders.
This article will provide a comprehensive analysis of INTR's price trajectory from 2026 to 2031, integrating historical market patterns, supply-demand dynamics, ecosystem development, and macroeconomic factors to deliver professional price forecasts and actionable investment strategies for market participants.
Interlay (INTR) Market Analysis Report
I. INTR Price History Review and Current Market Status
INTR Historical Price Trajectory
-
July 2022: INTR reached its all-time high of $0.200574 on July 19, 2022, marking the peak of its price performance during the bull market cycle.
-
2022-2025: Extended bear market period, with the token experiencing a significant decline from its peak, losing approximately 95.17% of its value over the one-year period.
-
December 2025: INTR touched its all-time low of $0.00030003 on December 6, 2025, representing the lowest price point in the token's trading history.
INTR Current Market Status
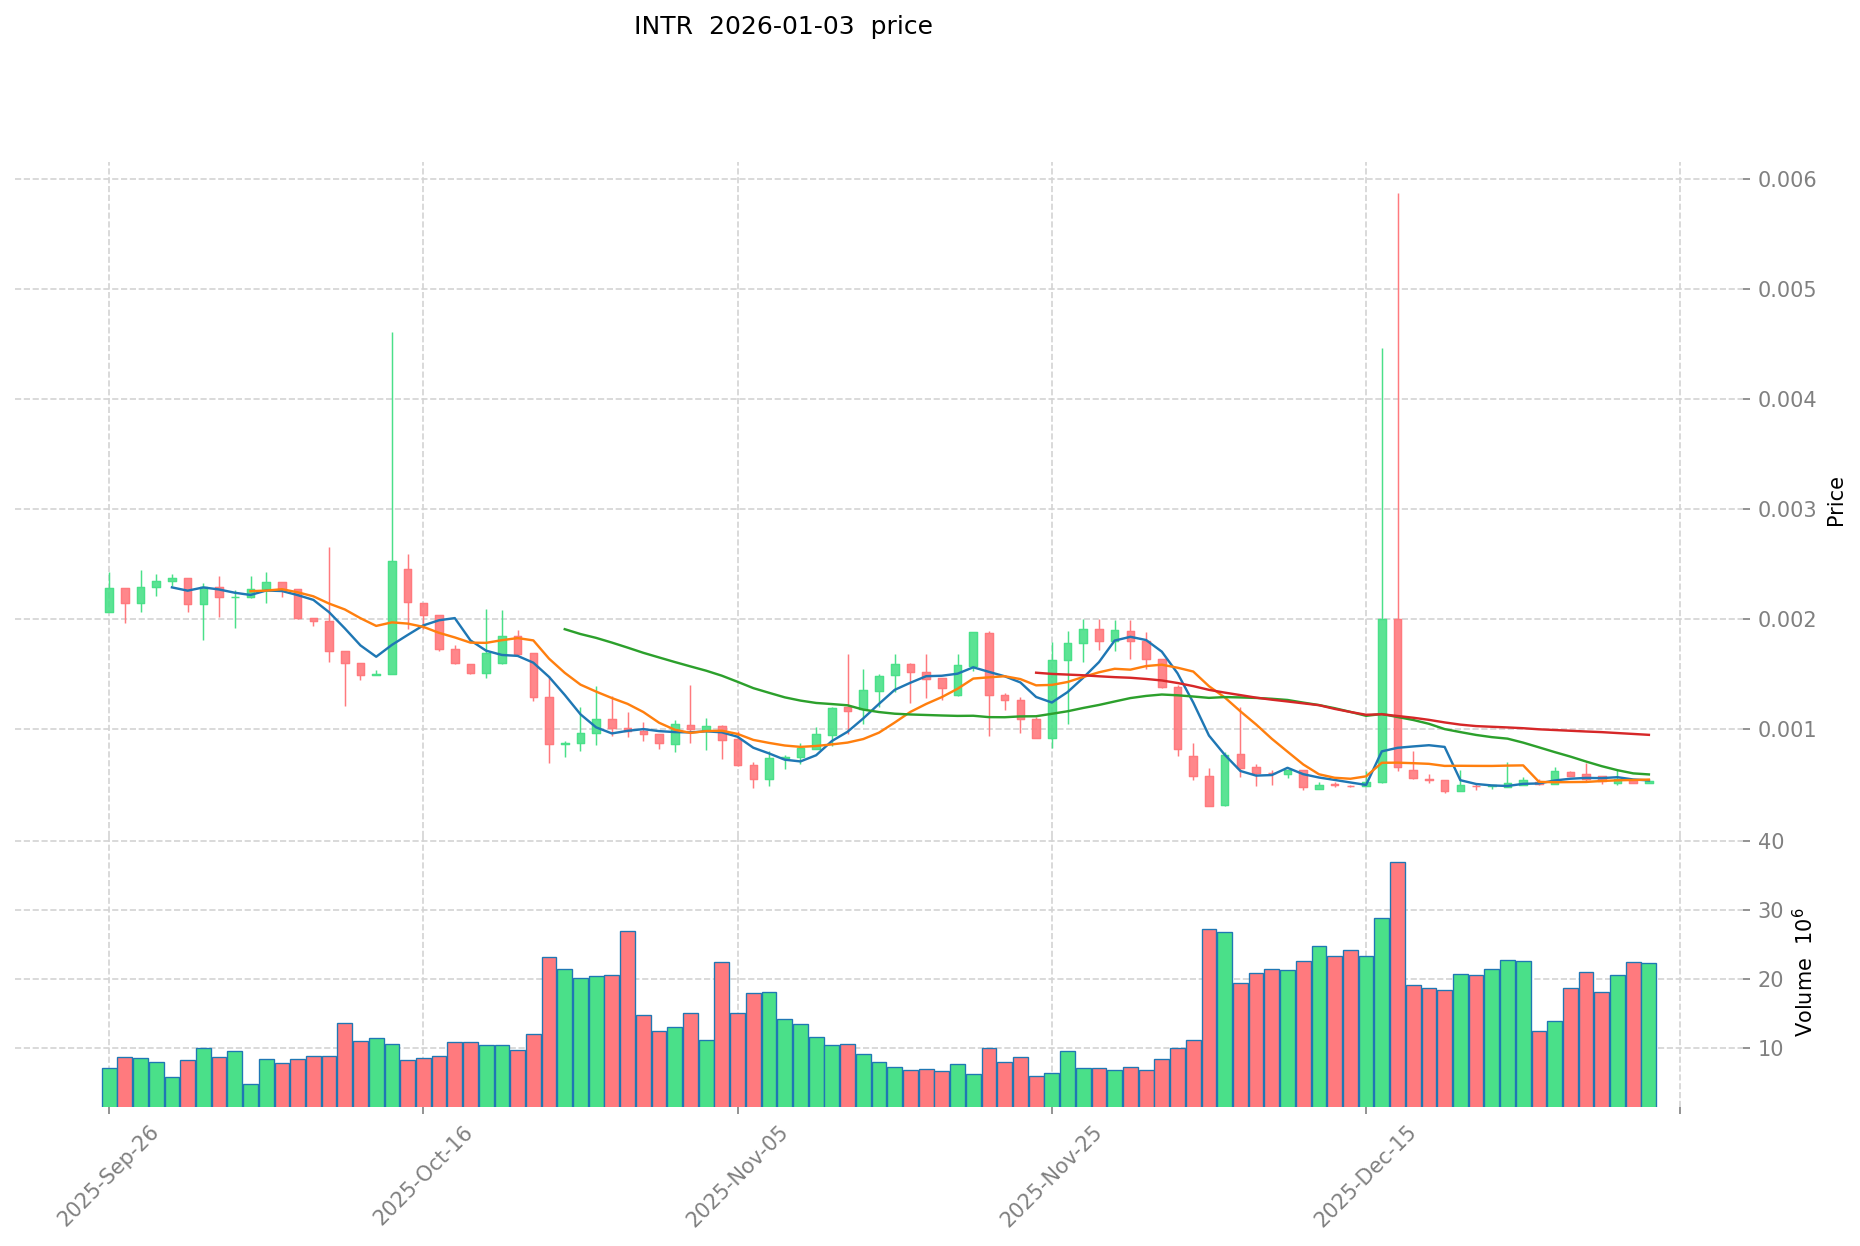
As of January 3, 2026, INTR is trading at $0.0005311. The token demonstrates modest short-term positive momentum, with a 24-hour price increase of 3.1% and a 7-day gain of 4.97%. However, the 30-day performance shows a significant decline of -29.89%, indicating substantial downward pressure in the medium term. The most severe deterioration is evident in the 1-year performance, which reflects a devastating -95.17% loss.
The 24-hour trading volume stands at $11,659.47, with price range oscillations between $0.0005113 and $0.0005387. The total market capitalization is approximately $122,147.54, with a fully diluted valuation of $531,100. The circulating supply comprises 229,989,711.19 INTR tokens out of a total supply of 1 billion tokens, representing a circulating ratio of approximately 23%.
With a market dominance of 0.000016%, INTR maintains an extremely small presence in the overall cryptocurrency market. The market sentiment indicator signals fear, reflecting cautious investor outlook toward the asset.
Click to view current INTR market price
INTR Market Sentiment Index
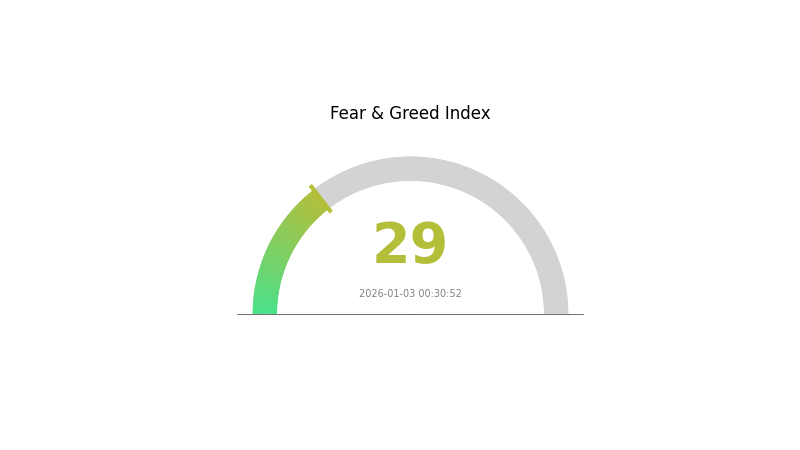
2026-01-03 Fear and Greed Index: 29 (Fear)
Click to view current Fear & Greed Index
The crypto market is currently displaying strong fear sentiment with an index reading of 29, indicating heightened market anxiety and risk aversion. This level suggests investors are becoming increasingly cautious, potentially creating both challenges and opportunities. During periods of extreme fear, long-term investors often find attractive entry points, while traders should exercise careful risk management. Monitor market conditions closely on Gate.com as sentiment shifts could signal important turning points in market cycles. Consider your investment strategy carefully in this uncertain environment.
INTR Holdings Distribution
Unable to provide a comprehensive holdings distribution analysis at this time due to incomplete data in the provided table. The address holdings dataset appears to be empty, with no specific wallet addresses or their corresponding token quantities available for evaluation.
To conduct a thorough analysis of INTR's on-chain concentration characteristics, the following information would be required: individual address holdings, percentage allocations, and distribution patterns across the holder base. Without this data, it is not possible to assess whether token concentration presents centralization risks, evaluate market structure implications, or determine the decentralization status of the network.
Once complete holdings data is made available, such analysis would typically examine key metrics including the distribution Gini coefficient, the percentage of tokens held by top addresses, wealth concentration curves, and holder fragmentation patterns. These indicators collectively reveal whether the token distribution supports a resilient, decentralized market structure or exhibits vulnerability to potential price manipulation through large holder coordination.
Click to view current INTR Holdings Distribution

| Top |
Address |
Holding Qty |
Holding (%) |
II. Core Factors Influencing INTR's Future Price
Supply Mechanism
- Token Economics: INTR's price trajectory is influenced by supply and demand dynamics within the Interlay ecosystem. The project's tokenomics structure affects validator incentives and network participation.
- Current Impact: Market demand for interoperability solutions and the adoption rate of the cross-chain protocol directly influence INTR token demand and pricing pressure.
Technology Development and Ecosystem Building
- Cross-Chain Interoperability: Interlay's core technology enables seamless asset transfer between different blockchain networks. The robustness and reliability of this bridging infrastructure are critical to ecosystem growth and token utility expansion.
- Protocol Security: Bridge security and uptime are paramount factors affecting token value. Any technical vulnerabilities or prolonged outages could reduce network utilization and staking rewards for validators, potentially causing reputational damage and independent price pressure separate from broader market trends.
- Ecosystem Applications: The growth of DApps and projects built on Interlay's cross-chain infrastructure determines the platform's real-world utility and long-term demand for INTR tokens.
Market Acceptance and Project Execution
- Team Performance: The project team's ability to execute on its roadmap and deliver technological improvements directly impacts market confidence and investor sentiment toward INTR.
- Industry Competition: Investors should monitor competitive developments in the cross-chain interoperability sector and how Interlay differentiates itself from alternative solutions.
Three、2026-2031 Year INTR Price Forecast
2026 Outlook
- Conservative Forecast: $0.0004 - $0.00052
- Neutral Forecast: $0.00052
- Bearish Forecast: $0.00071 (requires market recovery momentum)
2027-2029 Medium-term Outlook
- Market Stage Expectation: Gradual recovery and growth consolidation phase, with increasing institutional adoption and ecosystem expansion
- Price Range Forecast:
- 2027: $0.00047 - $0.00073
- 2028: $0.00047 - $0.00077
- 2029: $0.00048 - $0.00085
- Key Catalysts: Enhanced protocol functionality, growing developer ecosystem participation, strategic partnerships, and increased market liquidity on platforms like Gate.com
2030-2031 Long-term Outlook
- Base Scenario: $0.00052 - $0.00097 (assumes stable market conditions and steady adoption curve)
- Optimistic Scenario: $0.00079 - $0.00119 (assumes accelerated enterprise adoption and significant ecosystem maturation)
- Transformational Scenario: $0.00119+ (extreme favorable conditions including major regulatory clarity, institutional mainstream adoption, and breakthrough technological innovations)
- 2031-12-31: INTR anticipated at $0.00119 (bull market consolidation phase)
| 年份 |
预测最高价 |
预测平均价格 |
预测最低价 |
涨跌幅 |
| 2026 |
0.00071 |
0.00052 |
0.0004 |
-2 |
| 2027 |
0.00073 |
0.00061 |
0.00047 |
15 |
| 2028 |
0.00077 |
0.00067 |
0.00047 |
26 |
| 2029 |
0.00085 |
0.00072 |
0.00048 |
35 |
| 2030 |
0.00097 |
0.00079 |
0.00052 |
47 |
| 2031 |
0.00119 |
0.00088 |
0.00062 |
65 |
Interlay (INTR) Professional Investment Report
IV. INTR Professional Investment Strategy and Risk Management
INTR Investment Methodology
(1) Long-term Holding Strategy
- Target Investors: Cryptocurrency enthusiasts interested in cross-chain interoperability, DeFi infrastructure participants, and risk-tolerant investors with extended time horizons
- Operational Recommendations:
- Accumulate INTR during market downturns, particularly given the token's 95.17% year-over-year decline, which may represent an accumulation opportunity for conviction holders
- Participate in governance voting to actively engage with the protocol and understand its development trajectory
- Consider dollar-cost averaging (DCA) to reduce timing risk over a 12-24 month period
(2) Active Trading Strategy
INTR Risk Management Framework
(1) Asset Allocation Principles
- Conservative Investors: 0-2% of total cryptocurrency portfolio
- Active Investors: 2-5% of total cryptocurrency portfolio
- Professional Investors: 5-10% of total cryptocurrency portfolio allocation with tactical rebalancing
(2) Risk Mitigation Strategies
- Diversification: Limit INTR exposure to prevent concentration risk, particularly given the project's early-stage development and market volatility
- Position Sizing: Implement strict position-sizing protocols to ensure no single trade exceeds acceptable loss thresholds
(3) Secure Storage Options
- Custodial Solution: Gate Web3 wallet provides institutional-grade security for INTR holdings with seamless integration for governance participation and staking operations
- Non-Custodial Approach: Self-custody through blockchain wallets accessible via the Interlay network, with direct control over private keys
- Security Considerations: Enable multi-signature authentication, maintain offline backup of recovery phrases, utilize hardware wallet integration where available, and regularly audit wallet access logs
V. Potential Risks and Challenges for INTR
Market Risks
- Price Volatility Exposure: INTR has declined 95.17% over the past 12 months, demonstrating extreme price sensitivity. The token trades significantly below its all-time high of $0.200574 (reached on July 19, 2022), creating substantial downside risk for new investors
- Low Liquidity Environment: With 24-hour trading volume of only 11,659.47 and limited exchange presence, INTR faces liquidity constraints that could result in substantial slippage during large trades
- Market Capitalization Constraints: The fully-diluted valuation of $531,100 with only 23% of maximum supply in circulation indicates potential dilution risks upon future token releases
Regulatory Risks
- Cross-Chain Protocol Uncertainty: Regulatory frameworks governing cross-chain bridging mechanisms remain underdeveloped globally, creating potential compliance challenges as regulators establish clearer guidelines
- Multi-Chain Exposure: Operating across Polkadot, Ethereum, and Cosmos networks exposes the protocol to varying regulatory interpretations in each ecosystem, creating operational uncertainty
Technical Risks
- Interoperability Complexity: Managing secure asset transfers across multiple blockchain networks introduces significant smart contract and bridge security vulnerabilities
- Reliance on Ecosystem Partners: The protocol's success depends on continued support from Polkadot, Ethereum, and other integrated networks; changes to these ecosystems could impact Interlay functionality
- Smart Contract Risk: As an early-stage cross-chain protocol, Interlay remains exposed to undiscovered vulnerabilities in bridge mechanisms and protocol logic
VI. Conclusion and Action Recommendations
INTR Investment Value Assessment
Interlay represents a niche infrastructure play focused on cross-chain interoperability within the DeFi ecosystem. The project's core value proposition—enabling seamless asset movement between major blockchain networks—addresses a genuine market need. However, investors must acknowledge the project's early development stage, exemplified by its 95.17% annual price decline and limited market capitalization. The token's primary utility centers on governance participation and transaction fee payment within the Interlay network, with future security benefits promised through bridge integration. Given the current market dynamics and technical execution risks, INTR should be evaluated as a speculative, high-risk infrastructure investment rather than a core portfolio holding.
INTR Investment Recommendations
✅ Beginners: Start with minimal allocation (0.5-1% of crypto portfolio) through dollar-cost averaging on Gate.com to gain exposure while limiting downside risk. Prioritize understanding governance mechanisms before participation.
✅ Experienced Investors: Consider tactical accumulation during extreme weakness, implement disciplined position-sizing protocols, and maintain strict stop-loss discipline. Monitor technical developments and ecosystem partnerships closely to evaluate mid-term viability.
✅ Institutional Investors: Evaluate Interlay's competitive positioning against established cross-chain protocols, conduct thorough due diligence on security audits and bridge architecture, and assess governance participation opportunities. Consider allocating through strategic venture positions rather than speculative trading.
INTR Trading and Participation Methods
- Exchange Trading: Purchase INTR on Gate.com with immediate liquidity for tactical positions and index-based portfolio adjustments
- Governance Participation: Stake INTR tokens to participate in protocol governance proposals and earn staking rewards, enabling active engagement with project development
- Long-term Accumulation: Utilize systematic accumulation strategies through periodic purchases to establish positions at lower average costs during market cycles
Cryptocurrency investing carries extreme risk. This report does not constitute investment advice. Investors must conduct independent research and consult qualified financial advisors before committing capital. Never invest more than you can afford to lose completely.
FAQ
What is the INTR token? What are its uses and application scenarios?
INTR is a governance token enabling project participation and voting rights. It serves as a utility token for paying on-chain transaction fees within the Interlay DeFi ecosystem and can be used as collateral for DeFi protocols.
What are the main factors affecting INTR price?
INTR price is primarily influenced by supply scarcity, market demand, technological developments, institutional adoption, macroeconomic conditions, and ecosystem growth. These factors collectively drive price movements and long-term value potential.
How to predict and analyze the future price of INTR?
Analyze INTR price through technical analysis, historical data patterns, and market sentiment indicators. Monitor trading volume trends, on-chain metrics, and industry developments. Expert forecasts and community analysis provide additional reference for price direction assessment.
INTR has experienced significant price decline from its all-time high, currently trading well below historical peaks. Based on predictive models, INTR is projected to reach $0.002520 by 2026, representing substantial recovery potential from current depressed levels.
What are the main risks of investing in INTR tokens?
INTR faces risks including small market cap, limited liquidity causing high volatility, and lower market attention. Price fluctuations may be significant due to these factors.
What are the advantages or disadvantages of INTR compared to similar tokens?
INTR offers efficient transaction processing speed and lower transaction fees. However, it faces challenges including technical complexity and relatively low market recognition compared to established competitors in the space.
* The information is not intended to be and does not constitute financial advice or any other recommendation of any sort offered or endorsed by Gate.