MAVIA vs GMX: Comprehensive Comparison of Two Leading Decentralized Derivatives Trading Platforms


Introduction: MAVIA vs GMX Investment Comparison
In the cryptocurrency market, comparisons between MAVIA and GMX have become an important topic for investors. The two assets not only show significant differences in market capitalization ranking, application scenarios, and price performance, but also represent distinct positioning within the crypto asset landscape.
MAVIA (Heroes of Mavia): A Web3 mobile base-builder strategy game inspired by "Clash of Clans," MAVIA integrates blockchain technology to enable true ownership of in-game assets and governance participation. With a current market cap of $12.46 million and a ranking of 1,467, it represents the emerging gaming and entertainment segment of Web3.
GMX: A decentralized perpetual exchange, GMX functions as both a utility and governance token, capturing 30% of platform-generated fees. With a significantly larger market cap of $84.2 million and a ranking of 372, it represents the established infrastructure and trading segments of decentralized finance.
This article will conduct a comprehensive analysis of the investment value comparison between MAVIA and GMX across historical price trends, supply mechanisms, market positioning, and ecosystem dynamics, while addressing the key question investors are asking:
"Which offers better investment potential in the current market environment?"
Comparative Analysis Report: Heroes of Mavia (MAVIA) vs GMX
I. Historical Price Comparison and Current Market Status
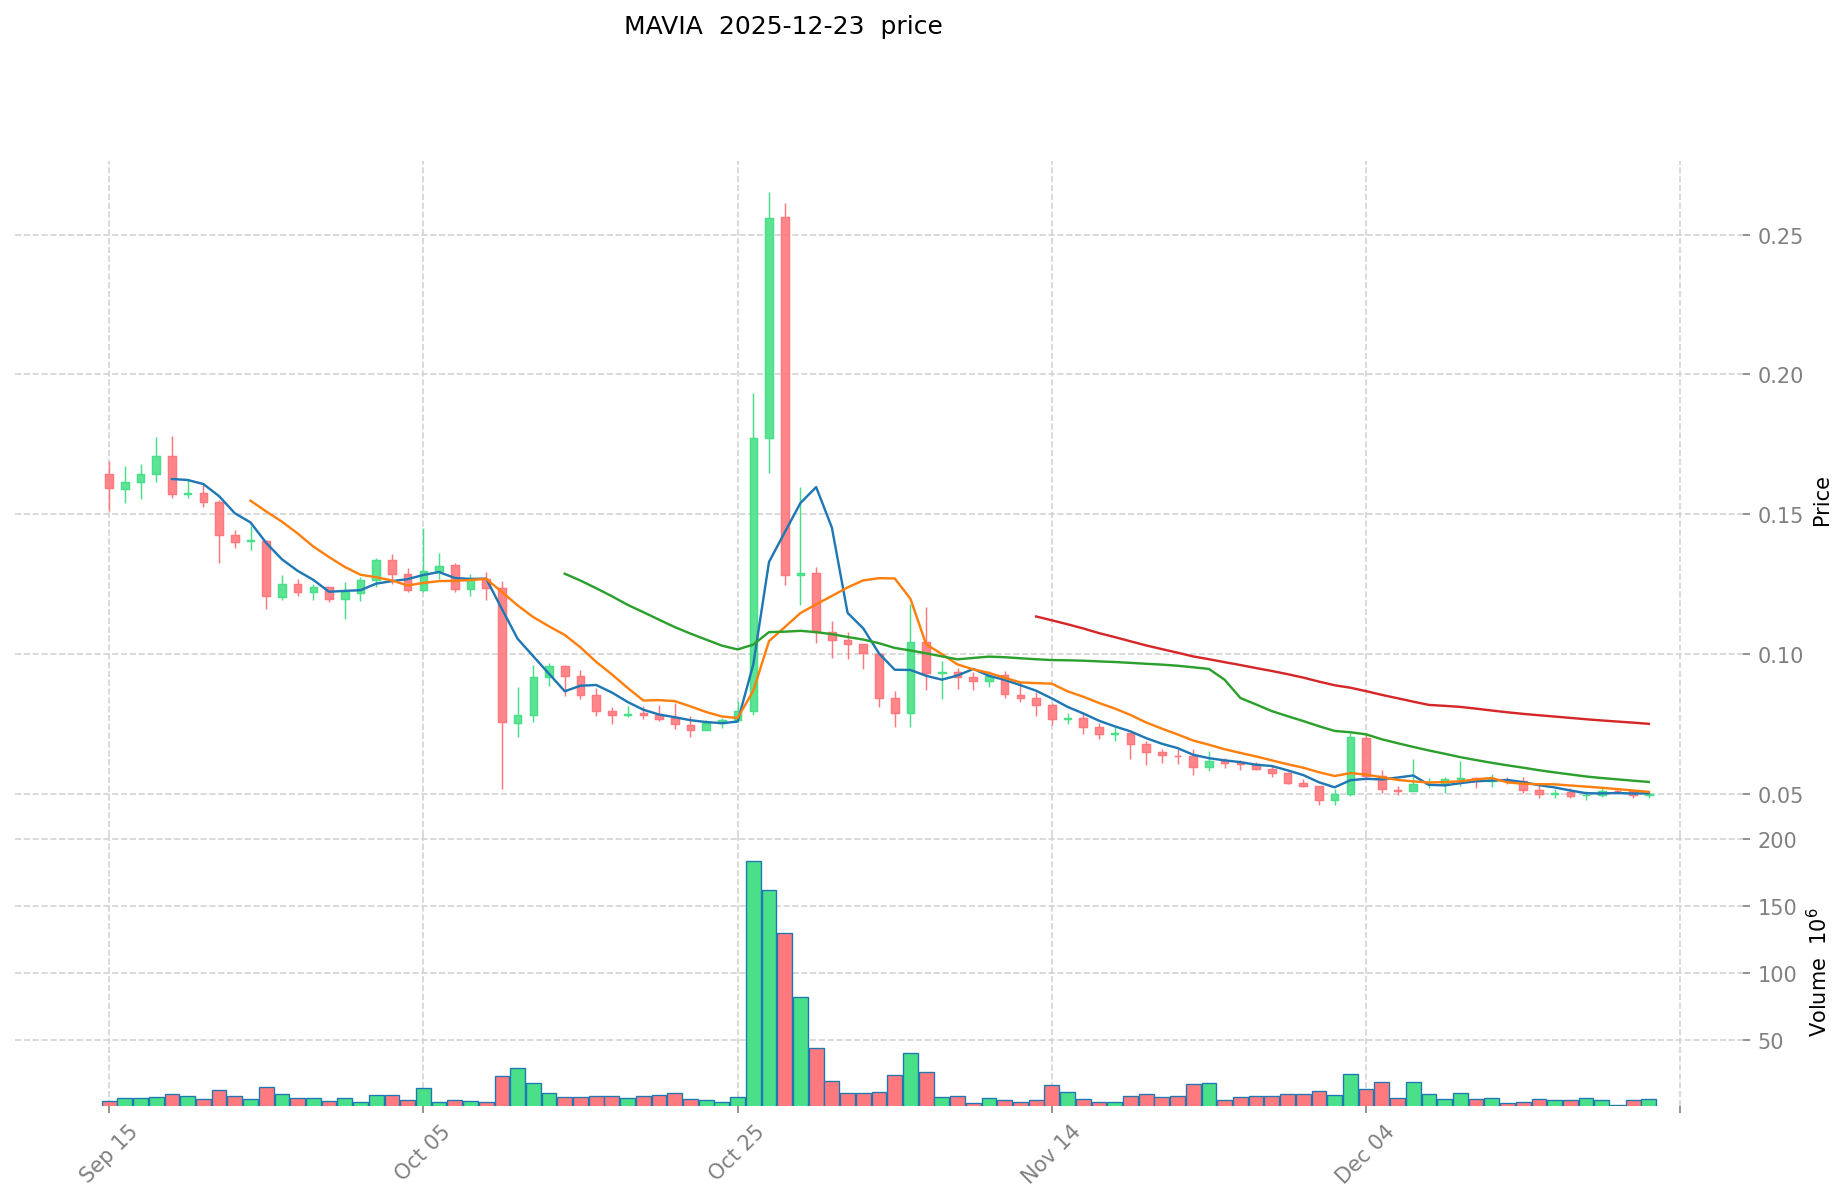
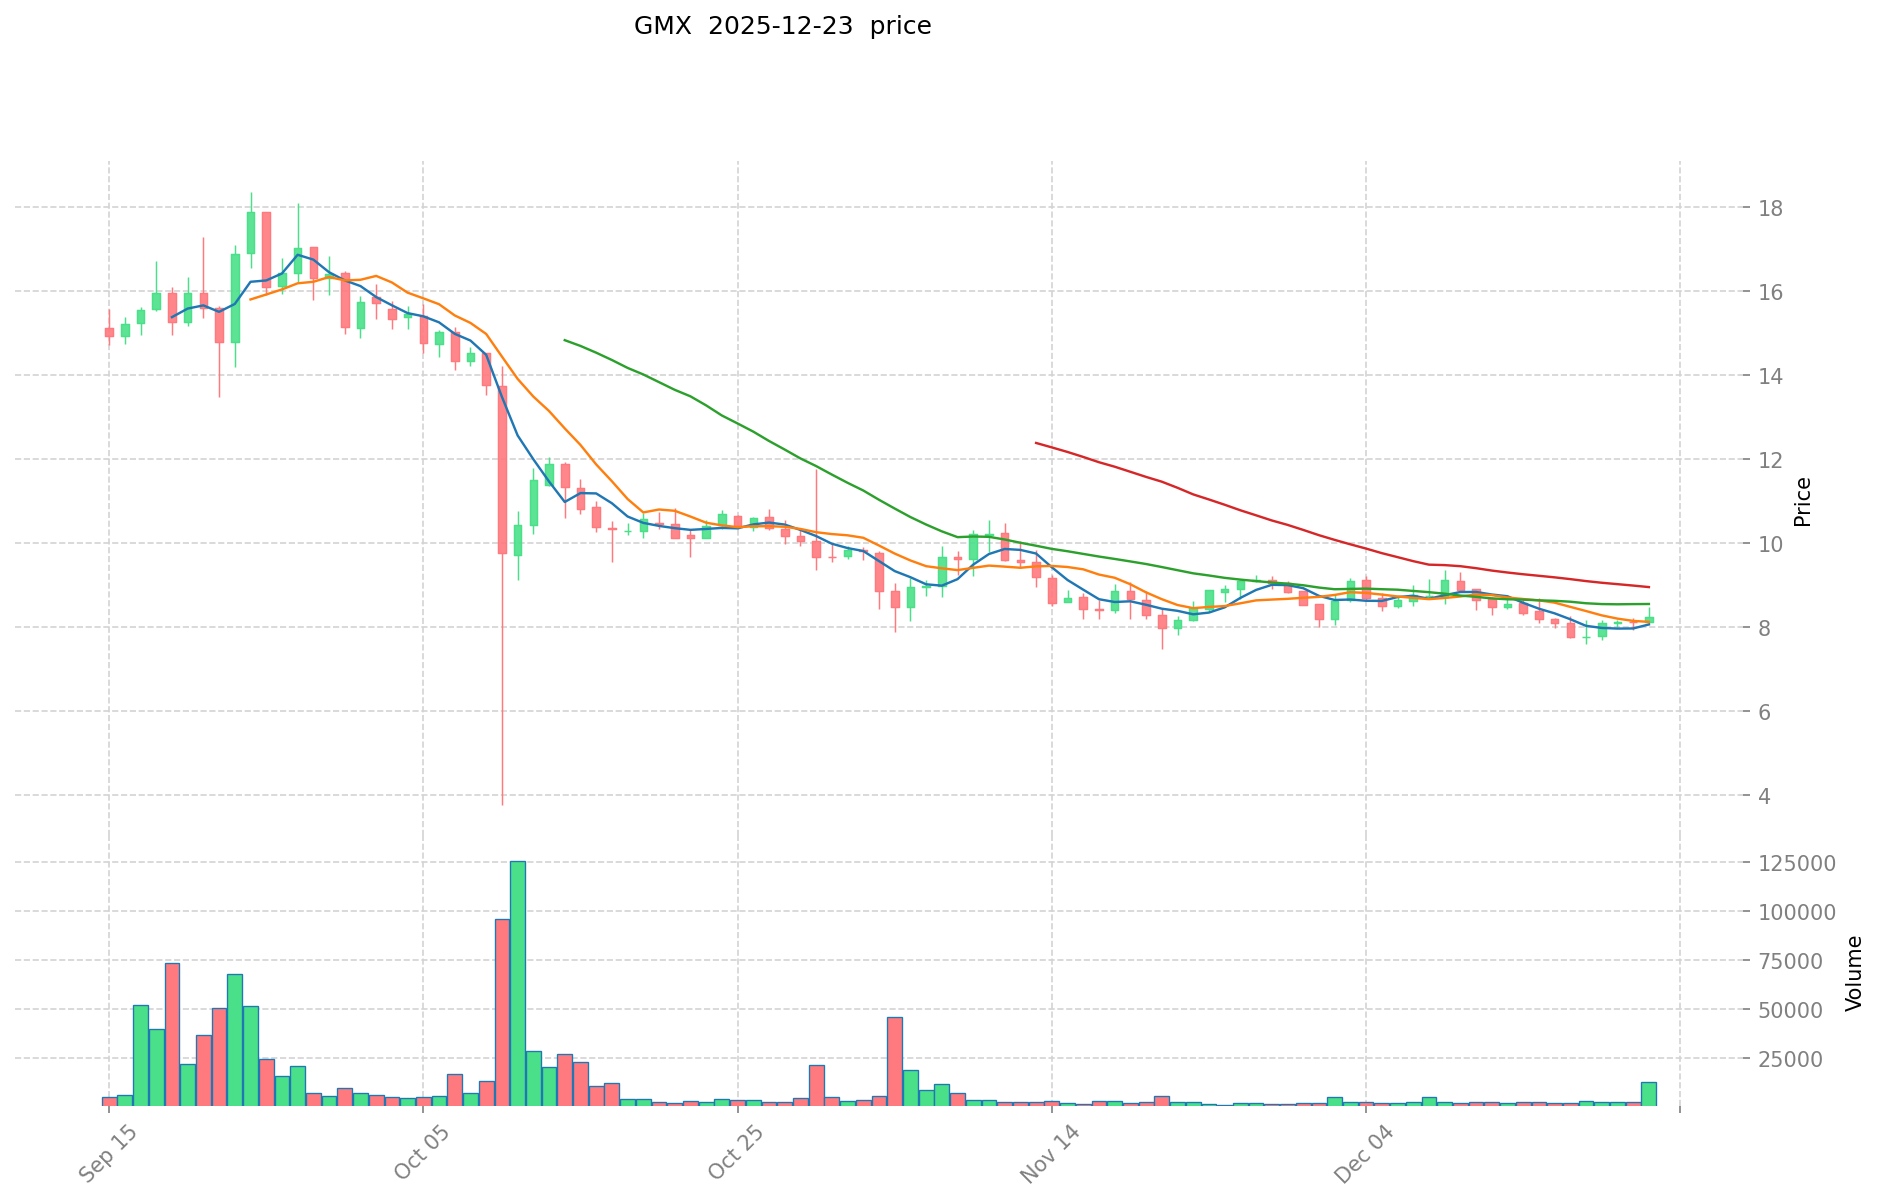
Price Trajectories of MAVIA and GMX
MAVIA (Heroes of Mavia):
- All-Time High (ATH): $10.83 (February 18, 2024)
- All-Time Low (ATL): $0.04581 (December 2, 2025)
- Price Decline from ATH to ATL: -99.58%
GMX:
- All-Time High (ATH): $91.07 (April 18, 2023)
- All-Time Low (ATL): $6.92 (October 11, 2025)
- Price Decline from ATH to ATL: -92.41%
Comparative Analysis: Both tokens have experienced severe drawdowns from their historical peaks. MAVIA reached its ATH more recently (February 2024) and has seen a sharper percentage decline, while GMX peaked earlier (April 2023). Over their respective market cycles, MAVIA has lost approximately 99.58% from its peak, whereas GMX has declined by 92.41%, indicating that MAVIA has faced more pronounced downward pressure in the current market environment.
Current Market Status (December 23, 2025)
Price Data:
- MAVIA current price: $0.04984
- GMX current price: $8.125
24-Hour Trading Metrics:
- MAVIA 24-hour volume: $244,295.40
- GMX 24-hour volume: $117,295.93
Market Capitalization:
- MAVIA market cap: $5,578,647.32
- GMX market cap: $84,198,134.88
Market Sentiment Index (Fear & Greed Index): 24 (Extreme Fear)
View Real-Time Prices:
II. Price Performance Analysis
Short-Term Price Movement (Last 7 Days and 30 Days)
MAVIA:
- 1-hour change: +0.6%
- 24-hour change: +0.74%
- 7-day change: +0.48%
- 30-day change: -22.05%
- 1-year change: -95.44%
GMX:
- 1-hour change: -0.05%
- 24-hour change: -0.19%
- 7-day change: +0.35%
- 30-day change: -0.92%
- 1-year change: -70.19%
Analysis: MAVIA demonstrates marginally positive short-term momentum with gains over the past hour, day, and week. However, the 30-day performance reveals a significant correction of -22.05%, suggesting weakness in medium-term price dynamics. GMX exhibits relative stability with minimal daily volatility and a modest weekly gain, though the one-year performance indicates substantial long-term depreciation across both assets.
III. Market Fundamentals and Token Economics
MAVIA Token Metrics
| Metric | Value |
|---|---|
| Circulating Supply | 111,931,126 |
| Total Supply | 250,000,000 |
| Maximum Supply | 250,000,000 |
| Circulating Supply Ratio | 44.77% |
| Total Market Cap | $12,460,000 |
| Number of Holders | 27,763 |
| Market Ranking | #1,467 |
Project Overview: Heroes of Mavia is a Web3 mobile base-builder strategy game inspired by "Clash of Clans." The project aims to integrate blockchain technology to enable true ownership of in-game assets and provide governance participation, facilitating mass adoption from Web2 to Web3 while maintaining compliance with major platform requirements (Apple and Google).
GMX Token Metrics
| Metric | Value |
|---|---|
| Circulating Supply | 10,362,847.37 |
| Total Supply | 10,362,847.37 |
| Maximum Supply | 13,250,000 |
| Circulating Supply Ratio | 78.21% |
| Fully Diluted Valuation | $84,198,134.88 |
| Number of Holders | 300,914 |
| Market Ranking | #372 |
Project Overview: GMX is a decentralized perpetual exchange. The GMX token functions as both a utility and governance token, and holders receive 30% of platform-generated fees, creating a direct economic incentive for token ownership.
IV. Market Distribution and Liquidity
MAVIA:
- Market Dominance: 0.00039%
- Exchange Listings: 22 exchanges
- Network: Available on Ethereum (ETH) and Base (Base EVM)
- Market Cap to FDV Ratio: 44.77%
GMX:
- Market Dominance: 0.0026%
- Exchange Listings: 32 exchanges
- Network: Deployed on Arbitrum (ARB EVM)
- Market Cap to FDV Ratio: 78.21%
V. Comparative Assessment
Market Position: GMX maintains a significantly stronger market position with a ranking of #372 compared to MAVIA's #1,467. GMX's market capitalization of $84.2 million substantially exceeds MAVIA's $5.6 million, reflecting broader market recognition and adoption.
Token Distribution: GMX demonstrates more advanced tokenomics with a higher circulating supply ratio (78.21% vs 44.77%), indicating greater token maturity and circulation. The substantially larger holder base for GMX (300,914 vs 27,763) suggests more distributed ownership and broader market participation.
Volatility and Risk: MAVIA exhibits greater price volatility with more pronounced short-term fluctuations, while GMX displays relatively stable trading patterns. The extreme fear market sentiment (index: 24) indicates heightened risk perception across the broader market.
Liquidity: While MAVIA shows comparable 24-hour trading volume relative to its market cap, GMX benefits from listings on 32 exchanges with established liquidity infrastructure, providing greater accessibility and price stability.
VI. Risk Considerations
- Both assets remain in early-stage market cycles with significant valuation uncertainty
- MAVIA's higher percentage decline from ATH reflects intensified selling pressure
- GMX's one-year decline of -70.19% indicates sustained downward market sentiment
- Current market environment characterized by "Extreme Fear" suggests heightened volatility risk for both assets
- MAVIA's lower holder count and limited exchange listings may result in liquidity constraints
Report Generated: December 23, 2025
Data Source: Gate, Real-time cryptocurrency market data
Disclaimer: This report presents factual market data and comparative analysis. It does not constitute financial advice or investment recommendations. Cryptocurrency markets carry substantial risk.
Investment Value Analysis: MAVIA vs GMX
I. Executive Summary
MAVIA and GMX represent two distinct segments within the crypto asset ecosystem. GMX has established itself as a pioneering decentralized derivatives trading platform with an innovative Peer-to-Pool model and fee-sharing mechanisms, while MAVIA operates within the gaming sector. Both projects demonstrate promising adoption trends and growth potential, though they serve fundamentally different market niches.
II. Core Factors Influencing MAVIA vs GMX Investment Value
Financial Model and Revenue Mechanisms
GMX: Peer-to-Pool Model
- GMX pioneered the Peer-to-Pool trading model among early decentralized derivatives platforms
- The platform implements a user fee-sharing mechanism where trading fee revenues are distributed to token holders and liquidity providers in the form of major cryptocurrencies and native GMX tokens
- This model creates a direct economic incentive structure linking user activity to token holder returns
MAVIA: Gaming Sector Positioning
- MAVIA's investment thesis centers on gaming sector potential and market adoption within blockchain-based gaming applications
- The project's value proposition derives from its application and user adoption within gaming ecosystems rather than from a direct fee-sharing mechanism
Market Partnership and Ecosystem Integration
GMX Ecosystem Development
- GMX Rush incentive program allocated $350,000 in incentives to DeltaPrime to support GM pool growth on Avalanche
- This demonstrates active ecosystem expansion and integration with layer-2 solutions
- DeltaPrime leverages GMX V2 infrastructure on Avalanche, indicating strong product-market fit and developer adoption
MAVIA Market Position
- Limited specific ecosystem partnership data available in reference materials
- Gaming sector positioning suggests potential for integration with gaming platforms and blockchain gaming infrastructure
Protocol Adoption and Market Traction
GMX Market Activity
- The platform has established itself as a mature DeFi protocol with measurable trading volumes and liquidity pools
- Multiple integration partnerships indicate growing adoption across different blockchain networks and protocols
- The fee-sharing mechanism provides transparent revenue metrics linked to platform usage
MAVIA Adoption Trends
- Reference materials indicate promising growth and adoption trends within gaming applications
- Specific quantitative adoption metrics are not detailed in available sources
III. Technical Architecture and Ecosystem Positioning
DeFi Infrastructure Development
The DeFi sector demonstrates standardization at the base protocol layer with increasing concentration and commercialization. GMX's Peer-to-Pool model represents an established infrastructure layer within this ecosystem, while MAVIA operates in a distinct vertical (gaming) with separate technological and adoption considerations.
Cross-Chain Deployment
GMX demonstrates multi-chain deployment capability with active presence on Avalanche and integration with various layer-2 solutions, supporting broader accessibility and liquidity distribution across ecosystems.
IV. Risk Considerations and Market Dynamics
The core value proposition of both assets should be evaluated based on solving actual financial and functional problems rather than speculative narratives. GMX's established protocol infrastructure addresses decentralized derivatives trading needs, while MAVIA's gaming-sector positioning addresses blockchain gaming adoption and tokenization requirements.
Differentiation Factors:
- GMX benefits from established market infrastructure, measurable fee revenues, and institutionalized partnerships
- MAVIA's value depends on gaming ecosystem growth rates and user adoption within blockchain gaming applications
- Both projects operate in distinct market segments with different risk profiles and adoption drivers
V. Conclusion
The investment value of MAVIA and GMX hinges on distinct operational models and market segments. GMX's Peer-to-Pool mechanism and active ecosystem incentives provide transparent revenue metrics and established market adoption. MAVIA's gaming sector positioning offers exposure to blockchain gaming growth but operates within a nascent vertical with different adoption dynamics. Investment evaluation should prioritize understanding each protocol's specific problem-solving capabilities and user adoption metrics rather than comparative analysis across different market segments.
III. 2025-2030 Year Price Forecast: MAVIA vs GMX
Short-term Forecast (2025)
- MAVIA: Conservative $0.0384846-$0.04998 | Optimistic $0.04998-$0.0564774
- GMX: Conservative $6.28397-$8.161 | Optimistic $8.161-$10.36447
Mid-term Forecast (2027-2028)
- MAVIA may enter consolidation phase with price appreciation, projected range $0.047-$0.0764
- GMX may enter growth acceleration phase, projected range $8.31-$16.07
- Key drivers: Institutional capital inflows, ETF approvals, ecosystem expansion and development
Long-term Forecast (2029-2030)
- MAVIA: Base case $0.0646-$0.0695 | Optimistic scenario $0.0855-$0.0868
- GMX: Base case $11.65-$14.04 | Optimistic scenario $20.08-$25.07
Disclaimer: This analysis is based on historical data and market models. Price predictions are subject to significant uncertainty and should not be considered investment advice. Cryptocurrency markets are highly volatile, and actual prices may deviate substantially from forecasts. Investors should conduct independent research and consult with financial advisors before making investment decisions.
MAVIA:
| 年份 | 预测最高价 | 预测平均价格 | 预测最低价 | 涨跌幅 |
|---|---|---|---|---|
| 2025 | 0.0564774 | 0.04998 | 0.0384846 | 0 |
| 2026 | 0.064406727 | 0.0532287 | 0.04258296 | 6 |
| 2027 | 0.066464016255 | 0.0588177135 | 0.0470541708 | 18 |
| 2028 | 0.07642185515055 | 0.0626408648775 | 0.038210927575275 | 25 |
| 2029 | 0.08552357281725 | 0.069531360014025 | 0.064664164813043 | 39 |
| 2030 | 0.086830762385514 | 0.077527466415637 | 0.054269226490946 | 55 |
GMX:
| 年份 | 预测最高价 | 预测平均价格 | 预测最低价 | 涨跌幅 |
|---|---|---|---|---|
| 2025 | 10.36447 | 8.161 | 6.28397 | 0 |
| 2026 | 12.5973196 | 9.262735 | 8.42908885 | 14 |
| 2027 | 16.067140131 | 10.9300273 | 8.306820748 | 34 |
| 2028 | 14.57847041274 | 13.4985837155 | 10.123937786625 | 66 |
| 2029 | 20.0750937016916 | 14.03852706412 | 11.6519774632196 | 72 |
| 2030 | 25.073511262871526 | 17.0568103829058 | 10.404654333572538 | 109 |
Comparative Investment Strategy Report: MAVIA vs GMX
IV. Investment Strategy Comparison: MAVIA vs GMX
Long-term vs Short-term Investment Strategy
MAVIA:
- Suitable for investors focused on gaming sector exposure and blockchain gaming ecosystem growth potential
- Short-term strategy: Monitor price consolidation and gaming adoption metrics; entry points during extreme fear sentiment periods
- Long-term strategy: Position for potential gaming sector maturation; value proposition dependent on sustained user adoption and gaming platform integration
GMX:
- Suitable for investors seeking exposure to established DeFi infrastructure and fee-bearing protocol mechanisms
- Short-term strategy: Capitalize on relative stability and established liquidity infrastructure; benefit from protocol fee distributions
- Long-term strategy: Potential appreciation linked to decentralized derivatives market expansion and ecosystem ecosystem integration across multiple blockchains
Risk Management and Asset Allocation
Conservative Investor Profile:
- MAVIA: 5-10% allocation (speculative gaming sector exposure)
- GMX: 15-20% allocation (established DeFi infrastructure)
- Stablecoin buffer: 70-80% (risk mitigation given extreme fear market sentiment)
Aggressive Investor Profile:
- MAVIA: 20-30% allocation (gaming sector upside potential)
- GMX: 30-40% allocation (core DeFi position)
- Hedging instruments: Cross-exchange spreads, stablecoin pairing strategies for volatility management
Hedging Tools:
- Stablecoin allocation for downside protection during market stress
- Multi-asset correlation analysis between MAVIA and GMX (limited direct correlation due to distinct market segments)
- Layer-2 and cross-chain deployment strategies to reduce single-point-of-failure risk
V. Comparative Risk Analysis
Market Risk
MAVIA:
- Extreme price volatility with -99.58% decline from ATH, indicating heightened liquidation risk
- Limited exchange listing coverage (22 exchanges) constrains liquidity availability during market dislocations
- Gaming sector exposure introduces cyclical demand risk tied to user engagement and retention metrics
- Lower holder concentration (27,763 holders) presents elevated potential for rapid price movements during sentiment shifts
GMX:
- Sustained one-year depreciation of -70.19% indicates persistent downward market pressure
- Concentrated deployment on Arbitrum presents network-specific risk exposure
- Decentralized derivatives protocol subject to smart contract and operational risks
- Peer-to-Pool model dependent on continuous liquidity provider participation and fee generation
Technology Risk
MAVIA:
- Mobile-first architecture introduces platform dependency risks (Apple App Store, Google Play Store compliance requirements)
- Web3 gaming infrastructure remains in early technical maturity stage with unproven scalability at mass adoption scale
- Cross-chain bridging requirements (Ethereum and Base EVM) introduce smart contract execution risks
GMX:
- Protocol architecture established but operates in competitive decentralized derivatives market with evolving technical standards
- Liquidity pool concentration risks if insufficient capital dispersal across pools
- Arbitrum network dependency creates potential exposure to layer-2 consensus vulnerabilities
Regulatory Risk
Global Regulatory Environment:
- Gaming sector regulation remains uncertain across major jurisdictions, creating potential compliance barriers for MAVIA
- DeFi derivative trading faces increasing regulatory scrutiny globally, potentially impacting GMX operational parameters
- Jurisdiction-specific restrictions on derivatives trading may limit GMX market accessibility in certain regions
- Token classification risk applicable to both assets depending on regulatory framework evolution
VI. Conclusion: Which Is the Better Buy?
📌 Investment Value Summary
MAVIA Advantages:
- Exposure to high-growth gaming sector with untapped Web3 adoption potential
- Lower market capitalization provides potential for substantial percentage appreciation in favorable market conditions
- Differentiated positioning within emerging blockchain gaming vertical
GMX Advantages:
- Established decentralized finance infrastructure with proven protocol-market fit
- Transparent fee-sharing mechanism directly linking token value to platform activity
- Broader market recognition (ranking #372) with superior liquidity infrastructure across 32 exchange listings
- Higher holder count (300,914) indicates more distributed risk profile
- Active ecosystem development partnerships demonstrating sustained protocol evolution
✅ Investment Recommendations
Beginner Investors:
- Recommend GMX as primary allocation due to established market infrastructure, transparent revenue mechanisms, and greater liquidity accessibility
- MAVIA allocation should be limited to 5-10% speculative gaming sector exposure only after core portfolio establishment
- Maintain 75-80% stablecoin allocation given extreme fear market sentiment (index: 24)
Experienced Investors:
- Develop sector-specific thesis: allocate to GMX for DeFi infrastructure exposure; consider MAVIA allocation contingent upon gaming ecosystem validation metrics
- Implement dollar-cost averaging into both positions over 6-12 month periods to mitigate timing risk
- Monitor GMX fee distribution metrics and MAVIA user adoption data as primary valuation drivers
- Execute stop-loss positions at -15% to -20% from entry points given elevated market volatility
Institutional Investors:
- GMX represents suitable infrastructure-layer investment with measurable fee economics and cross-chain deployment potential
- MAVIA remains pre-institutional stage; recommend monitoring for protocol security audits and significant user adoption milestones before substantial allocation
- Structure positions through multiple exchange listings to optimize execution and minimize slippage
- Consider protocol governance participation mechanisms for GMX to enhance portfolio engagement and information access
⚠️ Risk Disclaimer: Cryptocurrency markets demonstrate extreme volatility with substantial depreciation observed across both assets. MAVIA has declined -99.58% from all-time high; GMX has declined -92.41%. Current market sentiment reflects extreme fear conditions (index: 24), indicating elevated systemic risk. This analysis presents comparative factual data and assessment frameworks; it does not constitute financial advice, investment recommendations, or trading guidance. Investors must conduct independent research, assess personal risk tolerance, and consult qualified financial advisors before executing investment decisions. Cryptocurrency investments carry substantial risk of total capital loss.
Report Generated: December 23, 2025
Data Source: Gate, Real-time cryptocurrency market data
Sentiment Index Reference: Fear & Greed Index (24 = Extreme Fear)
None
MAVIA vs GMX: Frequently Asked Questions (FAQ)
I. Price and Market Performance
Q1: Why has MAVIA experienced a more severe price decline compared to GMX?
A: MAVIA has declined 99.58% from its all-time high of $10.83 (February 18, 2024), while GMX has declined 92.41% from its peak of $91.07 (April 23, 2023). MAVIA's sharper decline reflects several factors: (1) its more recent market entry into the gaming sector, which remains in early adoption phases; (2) lower market capitalization ($5.6 million vs. $84.2 million) making it more susceptible to volatility; (3) limited exchange listings (22 vs. 32) constraining liquidity; and (4) a smaller holder base (27,763 vs. 300,914), which can amplify price movements during sentiment shifts. Additionally, MAVIA reached its peak more recently during a different market cycle, exposing it to more concentrated selling pressure.
Q2: What is the current market status and trading activity for both tokens?
A: As of December 23, 2025, MAVIA trades at $0.04984 with a market capitalization of $5.58 million and 24-hour trading volume of $244,295.40. GMX trades at $8.125 with a market capitalization of $84.2 million and 24-hour volume of $117,295.93. Despite MAVIA's lower market cap, it demonstrates higher relative trading volume, suggesting active retail participation. The broader market sentiment remains at "Extreme Fear" (index: 24), indicating elevated volatility risk for both assets.
II. Fundamental Analysis and Tokenomics
Q3: How do the tokenomics and supply mechanisms differ between MAVIA and GMX?
A: MAVIA has a circulating supply of 111.9 million tokens (44.77% of maximum supply of 250 million), with 27,763 holders. GMX has a circulating supply of 10.36 million tokens (78.21% of maximum supply of 13.25 million), with 300,914 holders. GMX demonstrates more advanced tokenomics with higher circulating supply ratio and significantly broader distribution, indicating greater token maturity. GMX's Peer-to-Pool model generates direct fee revenue for token holders (30% of platform fees), creating measurable economic incentives. MAVIA's value derives from gaming ecosystem adoption rather than direct fee mechanisms.
Q4: What are the primary differences in business models between MAVIA and GMX?
A: GMX operates as a decentralized perpetual exchange with a proven Peer-to-Pool trading model and transparent fee-sharing mechanism where token holders receive 30% of platform-generated fees. This creates direct economic incentives linked to platform activity. MAVIA functions as a Web3 mobile base-builder strategy game inspired by "Clash of Clans," enabling true ownership of in-game assets and governance participation. GMX's model produces measurable, quantifiable revenue metrics, while MAVIA's value proposition depends on user adoption within blockchain gaming ecosystems and sustained engagement metrics.
III. Market Position and Ecosystem
Q5: How does market positioning and ecosystem development differ between the two projects?
A: GMX maintains a stronger market position with ranking #372 versus MAVIA's #1,467, listing on 32 exchanges compared to 22, and deployed across multiple blockchain networks including Arbitrum with active ecosystem partnerships (such as the $350,000 GMX Rush incentive program supporting DeltaPrime integration). This demonstrates sustained protocol development and cross-chain expansion. MAVIA operates within the gaming vertical with limited partnership data available in current sources, reflecting its earlier development stage. GMX's multi-chain deployment provides broader accessibility and liquidity distribution, while MAVIA's mobile-first approach introduces platform dependency risks related to Apple and Google compliance requirements.
IV. Risk Assessment and Investment Suitability
Q6: What are the primary risk factors for each asset, and which is more suitable for conservative investors?
A: MAVIA presents higher risk profile: -99.58% decline from ATH, limited exchange coverage constraining liquidity, gaming sector cyclical demand risk, and lower holder concentration enabling rapid price movements. GMX presents moderate risk: -92.41% decline from ATH, concentrated Arbitrum network deployment, and dependency on sustained liquidity provider participation. For conservative investors, GMX is more suitable due to established market infrastructure, transparent fee economics, broader holder distribution, and greater liquidity accessibility. MAVIA allocation should be limited to 5-10% speculative gaming sector exposure only after building core GMX positions. Conservative portfolios should maintain 75-80% stablecoin allocation given current extreme fear market sentiment.
Q7: What price forecasts are projected for 2025-2030, and how reliable are these predictions?
A: Projected 2025 conservative ranges: MAVIA $0.0385-$0.05000, GMX $6.28-$8.16. By 2030, base case scenarios project MAVIA $0.0646-$0.0695 and GMX $11.65-$14.04, with optimistic scenarios reaching MAVIA $0.0855-$0.0868 and GMX $20.08-$25.07. These forecasts are based on historical data and market modeling but carry substantial uncertainty. Cryptocurrency markets are highly volatile, and actual prices may deviate significantly from projections. Predictions should not be considered investment advice; investors must conduct independent research, assess personal risk tolerance, and consult qualified financial advisors. Price forecasts should be evaluated alongside fundamental adoption metrics, regulatory developments, and broader market sentiment shifts.
V. Investment Strategy and Recommendations
Q8: Which asset offers better investment potential in the current market environment?
A: GMX presents superior investment value for most investor profiles due to: (1) established decentralized finance infrastructure with proven market-fit; (2) transparent fee-sharing mechanism directly linking token value to platform activity; (3) broader market recognition (#372 ranking); (4) superior liquidity across 32 exchange listings; (5) higher holder distribution (300,914) reducing concentration risk; and (6) active ecosystem development partnerships. MAVIA offers exposure to high-growth gaming sector with substantial upside potential if blockchain gaming achieves mass adoption, but remains speculative. For dollar-cost averaging strategy over 6-12 months, allocate 30-40% to GMX as core DeFi infrastructure position and 20-30% to MAVIA as gaming sector speculation, with 40-50% stablecoin buffer. Beginner investors should prioritize GMX; experienced investors should develop sector-specific thesis evaluating GMX fee distribution metrics and MAVIA user adoption data as primary valuation drivers.
Report Generated: December 23, 2025
Data Source: Gate, Real-time cryptocurrency market data
Disclaimer: This FAQ presents factual market data and comparative analysis. It does not constitute financial advice, investment recommendations, or trading guidance. Cryptocurrency investments carry substantial risk of total capital loss.
Share
Content
Introduction: MAVIA vs GMX Investment Comparison
I. Historical Price Comparison and Current Market Status
II. Price Performance Analysis
III. Market Fundamentals and Token Economics
IV. Market Distribution and Liquidity
V. Comparative Assessment
VI. Risk Considerations
I. Executive Summary
II. Core Factors Influencing MAVIA vs GMX Investment Value
III. Technical Architecture and Ecosystem Positioning
IV. Risk Considerations and Market Dynamics
V. Conclusion
III. 2025-2030 Year Price Forecast: MAVIA vs GMX
IV. Investment Strategy Comparison: MAVIA vs GMX
V. Comparative Risk Analysis
VI. Conclusion: Which Is the Better Buy?
I. Price and Market Performance
II. Fundamental Analysis and Tokenomics
III. Market Position and Ecosystem
IV. Risk Assessment and Investment Suitability
V. Investment Strategy and Recommendations
How to Buy Cryptocurrency


Trending Cryptocurrencies


2025 READY Price Prediction: Analyzing Market Trends and Potential Growth Factors for the Digital Asset

MYX Token Price and Market Analysis on Gate.com in 2025

2025 1INCH Price Prediction: Analyzing Growth Potential and Market Trends for the DeFi Aggregator Token

2025 KAVA Price Prediction: Analyzing Market Trends, Technical Indicators, and Growth Potential in the DeFi Landscape
2025 VVSPrice Prediction: Market Analysis and Future Outlook for Crypto Investors

2025 MLNPrice Prediction: Analyzing Key Factors That Will Drive MLN Valuation in the Coming Market Cycle

What is ZKP token price volatility: Why has ZKP surged 61% with 0.19 USDT and resistance at 0.25-0.40 USDT?

How does Federal Reserve policy and inflation data impact crypto macroeconomic correlation with 0.89 coefficient?
What Does On-Chain Data Analysis Reveal About Active Addresses and Whale Movement in Crypto Markets?

How does FARTCOIN's $25 million holdings impact exchange fund flows and market liquidity?

What Are the Major Cryptocurrency Security and Risk Events: Smart Contract Vulnerabilities, Network Attacks, and Exchange Custody Risks?