This article offers a detailed analysis of Stellar (XLM) vs Ethereum Classic (ETC), evaluating aspects like historical price trends, technical foundations, market performance, and investment strategies. It addresses the central question of which asset is the better buy, providing insights into long-term versus short-term strategies and risk management. The discussion will aid investors in understanding the distinct market dynamics driving XLM's decentralized payment adoption and ETC's speculative sentiment. Ideal for investors seeking clarity on asset fundamentals, trading activity, and institutional influence. Key real-time updates can be found on Gate.
Introduction: XLM vs ETC Investment Comparison
In the cryptocurrency market, comparisons between Stellar (XLM) and Ethereum Classic (ETC) remain a key consideration for investors. The two assets demonstrate significant differences in market ranking, use cases, and price performance, representing distinct positions within the crypto asset landscape.
Stellar (XLM): Launched in 2014, it has gained market recognition through its focus on enabling fast, stable, and low-cost transfer of digital assets among banks, payment institutions, and individuals via a decentralized gateway.
Ethereum Classic (ETC): Since its emergence in 2015, it has been positioned as a decentralized platform for executing smart contracts, upholding the "code is law" principle and enabling uncensorable, programmable financial applications.
This article will conduct a comprehensive analysis of the investment value comparison between XLM and ETC across historical price trends, supply mechanisms, market adoption, technical ecosystems, and future outlooks, addressing the key question investors want answered:
"Which is the better buy right now?"
Comparative Market Analysis: Stellar (XLM) vs. Ethereum Classic (ETC)
I. Historical Price Comparison and Current Market Status
Stellar (XLM) and Ethereum Classic (ETC) Historical Price Trends
Stellar (XLM):
- All-time high: $0.875563 (January 3, 2018)
- All-time low: $0.00047612 (March 5, 2015)
- Price decline over 1 year: -45.76%
- Price decline over 30 days: -12.65%
- Price decline over 7 days: -6.32%
Ethereum Classic (ETC):
- All-time high: $167.09 (May 7, 2021)
- All-time low: $0.615038 (July 25, 2016)
- Price decline over 1 year: -59.69%
- Price decline over 30 days: -15.12%
- Price decline over 7 days: -2.56%
Comparative Analysis:
Both assets have experienced significant downward pressure over the past year. ETC has declined more sharply (-59.69%) compared to XLM (-45.76%), indicating greater recent bearish pressure on the Ethereum Classic network. However, XLM's performance over the 7-day and 30-day periods shows relatively steeper declines, suggesting more volatile short-term trading activity.
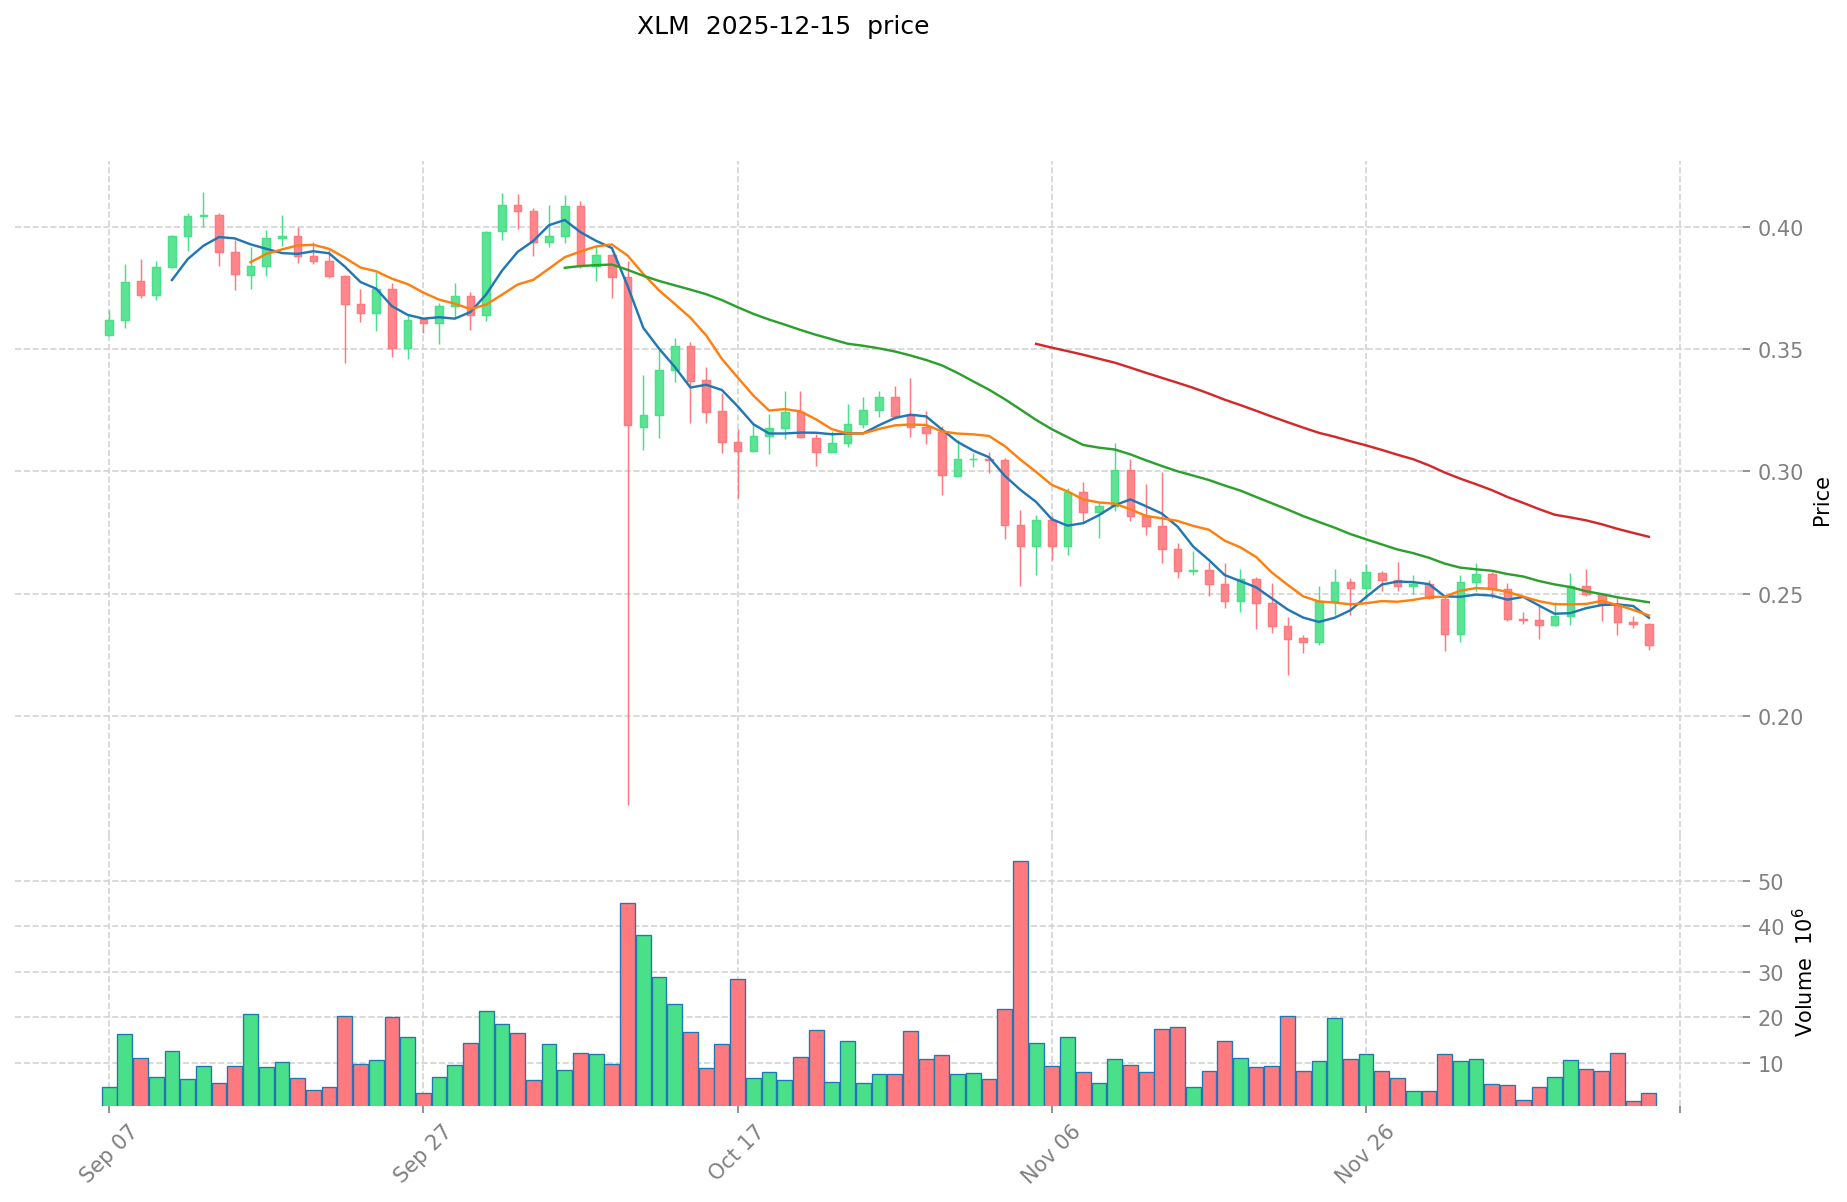
Current Market Status (December 15, 2025)
Stellar (XLM):
- Current price: $0.23012
- 24-hour change: -1.8%
- Market capitalization: $11,506,411,199.59
- Circulating supply: 32,352,838,015.76 XLM
- 24-hour trading volume: $1,368,446.48
- Market dominance: 0.35%
- Market rank: 24
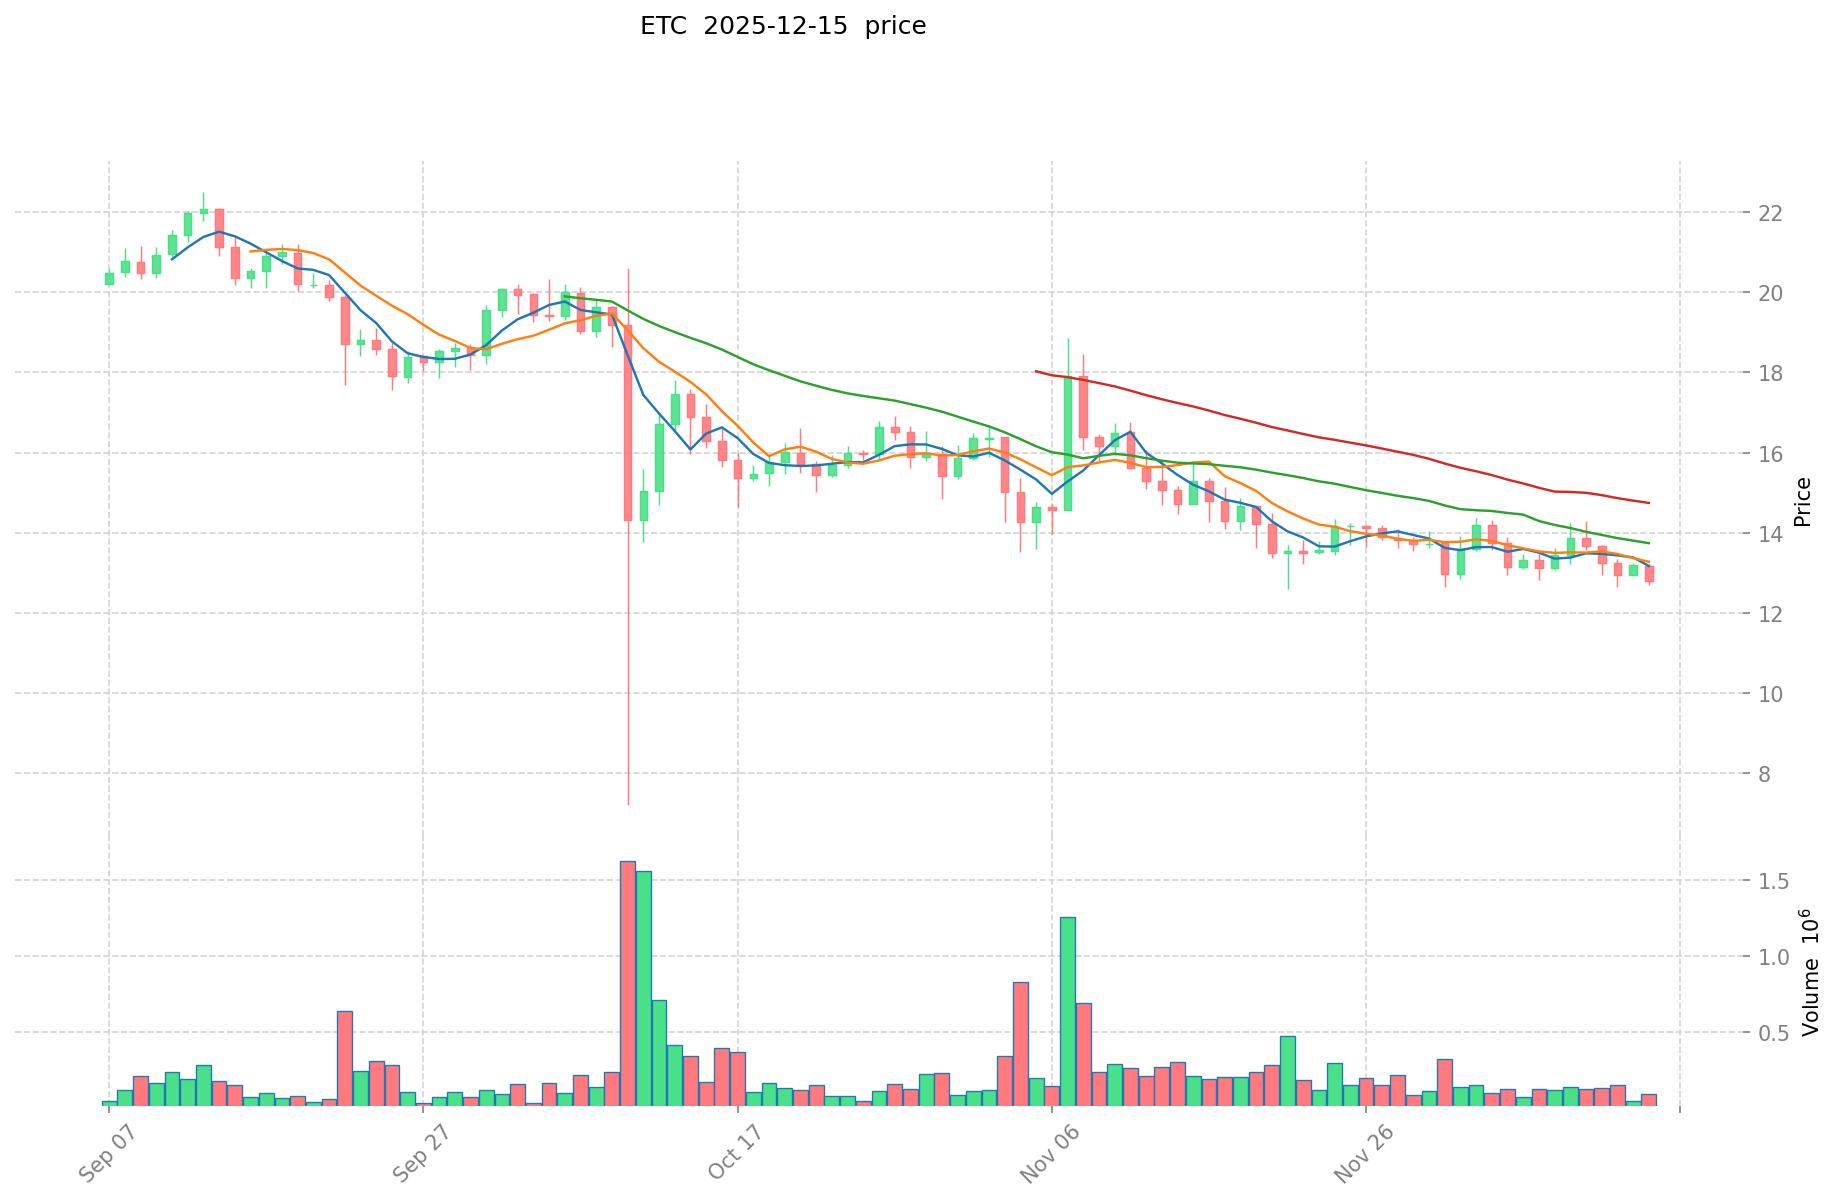
Ethereum Classic (ETC):
- Current price: $13.126
- 24-hour change: +1.49%
- Market capitalization: $2,030,930,270.29
- Circulating supply: 154,725,755.77 ETC
- 24-hour trading volume: $1,649,091.94
- Market dominance: 0.062%
- Market rank: 50
Market Sentiment Index (Fear & Greed Index): 16 (Extreme Fear)
The extreme fear sentiment reflects widespread market pessimism, characterized by significant downward pressure across the cryptocurrency sector. XLM trades with negative momentum, while ETC shows modest positive movement despite the bearish broader market conditions.
View real-time prices:
II. Project Overview and Technical Foundation
Stellar (XLM)
Stellar is a blockchain project initiated by Jed McCaleb, one of the former co-founders of Ripple. The network operates as a decentralized gateway enabling fast, stable, and extremely low-cost transfer of digital assets among banks, payment institutions, and individuals.
Core Technology:
- Consensus Mechanism: Stellar Consensus Protocol (SCP), based on the Federated Byzantine Agreement (FBA) model
- Transaction speed: Confirmation typically completes within 2-5 seconds
- Network throughput: Supports rapid transaction processing with strong network capacity
- Consensus model: Does not rely on mining or staking; instead depends on consensus among trusted validator nodes
Supply Metrics:
- Total supply: 50,001,786,892 XLM (fixed maximum)
- Circulating supply: 32,352,838,015.76 XLM (64.70% of total)
- Initial publish price: $0.002
Ethereum Classic (ETC)
Ethereum Classic is a decentralized platform supporting smart contract execution, representing the continuation of the original Ethereum chain. It adheres to the principle of "code is law" and operates as an independent blockchain network.
Core Technology:
- Consensus Mechanism: Proof of Work (PoW)
- Platform type: Smart contract platform for decentralized applications (DApps)
- Supply cap: 210,700,000 ETC (established via the Gotham update in December 2017)
- Block reward reduction: Every 5 million blocks, block rewards decrease by 20%
Supply Metrics:
- Total supply: 154,725,755.77 ETC (circulating supply equals total supply)
- Circulating supply ratio: 73.43%
- Initial publish price: $0.7523
Price Movement Analysis
24-Hour Performance:
- XLM: -1.8% (down $0.004218)
- ETC: +1.49% (up $0.192706)
Multi-Period Performance:
| Time Period |
XLM Change |
ETC Change |
| 1 Hour |
-0.29% |
+0.25% |
| 24 Hours |
-1.8% |
+1.49% |
| 7 Days |
-6.32% |
-2.56% |
| 30 Days |
-12.65% |
-15.12% |
| 1 Year |
-45.76% |
-59.69% |
Trading Volume:
- XLM 24-hour volume: $1,368,446.48
- ETC 24-hour volume: $1,649,091.94
- ETC demonstrates higher absolute trading activity, reflecting greater market liquidity
Market Capitalization and Valuation
- XLM market cap: $11.51 billion (rank #24)
- ETC market cap: $2.03 billion (rank #50)
- XLM's market capitalization is approximately 5.7 times larger than ETC's, indicating greater overall market recognition
IV. Exchange Listings and Accessibility
Stellar (XLM):
- Listed on 64 exchanges
- Available on major platforms including Binance, Kraken, Coinbase, and OKX
Ethereum Classic (ETC):
- Listed on 49 exchanges
- Available on major platforms including Binance, Kraken, Coinbase, and OKX
Both assets maintain robust exchange availability, facilitating accessibility for retail and institutional participants.
V. Key Community and Development Resources
Stellar (XLM)
- Official website: https://www.stellar.org/
- Community channels: Medium, Reddit, Twitter, Facebook, Forum (Galactictalk)
- Development repositories: Multiple GitHub repositories including stellar-core, js-stellar-sdk, go, and stellar-protocol
- Block explorer: https://stellarchain.io/
Ethereum Classic (ETC)
- Official website: http://ethereumclassic.org
- Community channels: Twitter, Reddit, Facebook, Forum
- Development repositories: Multiple GitHub repositories including ethereumclassic, multi-geth, openethereum, hyperledger besu, core-geth, and ECIPs
- Block explorer: https://gastracker.io/
VI. Summary and Observations
Both Stellar and Ethereum Classic operate within the extreme fear market conditions reflected by the current Fear & Greed Index of 16. XLM maintains a significantly larger market capitalization despite similar historical volatility patterns, while ETC's recent positive 24-hour movement contrasts with XLM's continuing downward pressure. The long-term performance metrics reveal sustained bearish trends for both assets over the past year, with ETC experiencing more severe declines. Trading volumes remain comparable, indicating sustained but cautious market participation in both assets during this period of market pessimism.
Investment Value Analysis Report: XLM vs ETC
I. Executive Summary
Based on available market research, this report examines the investment value drivers of Stellar Lumens (XLM) and Ethereum Classic (ETC). The analysis reveals that XLM and ETC respond to distinct market dynamics, with XLM primarily driven by decentralized payment network adoption and ETC subject to speculative market sentiment and institutional positioning shifts.
II. Core Factors Impacting XLM vs ETC Investment Value
Market Sentiment and Speculative Dynamics
XLM Valuation Drivers:
- Decentralized payment framework facilitating remittance and micropayment functionality
- Increasing adoption in emerging markets for cross-border transactions
- Historical price reference: USD 0.12 as of September 2023
- Experienced significant volatility, with recorded losses exceeding 50% within 90-day periods during certain market conditions
ETC Valuation Drivers:
- Price movements driven substantially by speculative buying pressure and fear of missing out (FOMO) from short-term traders
- Institutional positioning through products such as Grayscale's single-asset trusts influences market dynamics
- Platform listing announcements and exchange integrations historically trigger price volatility
Institutional Adoption and Portfolio Positioning
Institutional Exposure:
- Both XLM and ETC are included in Grayscale's single-asset trust fund portfolio, alongside ETH, BCH, LTC, ZEC, ZEN, SOL, and BAT
- Grayscale's institutional-focused positioning reflects conservative investment preferences concentrated on mainstream digital assets
- Institutional fund flows, particularly from Grayscale, represent significant market impact factors, with potential outflow pressure affecting price trajectories
Historical Volatility:
- XLM has demonstrated significant price volatility alongside other altcoins, experiencing 50%+ losses during bearish periods
- Market performance is sensitive to broader cryptocurrency sentiment cycles and investor risk appetite shifts
- Micropayment use case adoption and emerging market penetration remain key differentiation factors for XLM fundamentals
ETC Market Characteristics:
- Price appreciation frequently correlates with exchange listing expectations and speculative positioning rather than fundamental network development
- Market behavior reflects sentiment-driven trading patterns typical of lower-conviction assets
III. Key Investment Considerations
Risk Disclosure: Both assets exhibit substantial volatility. Investment decisions should account for individual risk tolerance and not exceed capital one can afford to lose. Exercise caution regarding unrealistic return promises or speculative schemes.
XLM Strengths:
- Established decentralized payment network with real-world remittance and micropayment applications
- Demonstrated use cases in developing economies
- Technical infrastructure specifically optimized for transaction settlement
ETC Market Context:
- Exposure through established institutional vehicles (Grayscale trusts)
- Liquidity and trading availability across major platforms
- Subject to platform listing catalysts and institutional positioning shifts
IV. Conclusion
Investment value in XLM centers on decentralized payment network adoption trajectories and emerging market penetration, while ETC valuations remain sensitive to speculative market sentiment and institutional fund flows. Current market trends and investor sentiment constitute primary short-term drivers for both assets, though XLM maintains differentiated fundamental value propositions tied to cross-border transaction infrastructure.
Report Date: December 15, 2025
Data Currency: Information compiled from market sources through early 2024
III. 2025-2030 Price Forecast: XLM vs ETC
Short-term Forecast (2025)
- XLM: Conservative $0.138078-$0.23013 | Optimistic $0.23013-$0.3175794
- ETC: Conservative $9.32372-$13.132 | Optimistic $13.132-$13.91992
Mid-term Forecast (2027-2028)
- XLM may enter consolidation and recovery phase, with predicted price range of $0.16710614-$0.47125478
- ETC may experience moderate growth phase, with predicted price range of $11.056120-$23.151845
- Key drivers: Institutional capital inflows, ETF adoption, ecosystem development
Long-term Forecast (2029-2030)
- XLM: Base scenario $0.412790-$0.456133 | Optimistic scenario $0.499477-$0.547361
- ETC: Base scenario $21.064383-$23.170822 | Optimistic scenario $25.277260-$25.719612
View detailed price predictions for XLM and ETC
Disclaimer: These forecasts are based on historical data analysis and should not be considered as investment advice. Cryptocurrency markets are highly volatile and subject to rapid changes. Past performance does not guarantee future results. Investors should conduct their own research and consult with financial professionals before making investment decisions.
XLM:
| 年份 |
预测最高价 |
预测平均价格 |
预测最低价 |
涨跌幅 |
| 2025 |
0.3175794 |
0.23013 |
0.138078 |
0 |
| 2026 |
0.345056922 |
0.2738547 |
0.167051367 |
19 |
| 2027 |
0.39919799619 |
0.309455811 |
0.16710613794 |
34 |
| 2028 |
0.47125478178135 |
0.354326903595 |
0.2622019086603 |
54 |
| 2029 |
0.499476919652691 |
0.412790842688175 |
0.247674505612905 |
79 |
| 2030 |
0.54736065740452 |
0.456133881170433 |
0.310171039195894 |
98 |
ETC:
| 年份 |
预测最高价 |
预测平均价格 |
预测最低价 |
涨跌幅 |
| 2025 |
13.91992 |
13.132 |
9.32372 |
0 |
| 2026 |
19.4773824 |
13.52596 |
9.468172 |
3 |
| 2027 |
21.45217256 |
16.5016712 |
11.056119704 |
25 |
| 2028 |
23.1518446936 |
18.97692188 |
17.079229692 |
44 |
| 2029 |
25.27725994416 |
21.0643832868 |
12.849273804948 |
60 |
| 2030 |
25.7196119931828 |
23.17082161548 |
13.902492969288 |
76 |
Investment Strategy Comparison Report: XLM vs ETC
I. Investment Strategy Comparison: Stellar (XLM) vs Ethereum Classic (ETC)
Long-term vs Short-term Investment Strategy
Stellar (XLM):
- Suitable for investors focused on decentralized payment infrastructure adoption and emerging market cross-border transaction use cases
- Long-term thesis centers on increasing institutional adoption in remittance corridors and micropayment ecosystems
- Short-term trading requires caution given 45.76% annual decline and sensitivity to broader cryptocurrency sentiment cycles
Ethereum Classic (ETC):
- Suitable for investors seeking exposure to smart contract platforms with institutional infrastructure support through Grayscale trusts
- Long-term positioning benefits from platform stability and "code is law" principle adherence
- Short-term trading subject to speculative dynamics and exchange listing catalysts
Risk Management and Asset Allocation
Conservative Investor Profile:
- XLM: 35% allocation
- ETC: 25% allocation
- Remaining 40% allocated to stablecoins and lower-volatility assets for portfolio stabilization
Aggressive Investor Profile:
- XLM: 50% allocation
- ETC: 40% allocation
- Remaining 10% reserved for tactical rebalancing based on market sentiment indicators
Hedging Instruments:
- Stablecoin reserves (minimum 30% of portfolio value) to capitalize on market downturns during extreme fear conditions
- Cross-asset diversification through Bitcoin and Ethereum exposure to reduce concentration risk
- Dollar-cost averaging strategy over 6-12 month periods to mitigate entry-point timing risk
II. Potential Risk Comparison
Market Risk
Stellar (XLM):
- Significant price volatility with 45.76% annual decline despite functional payment network
- Adoption rate dependency on emerging market regulatory frameworks and banking sector partnerships
- Circulating supply concentration at 64.70% may create liquidity pressure if large holders liquidate positions
Ethereum Classic (ETC):
- Steeper annual decline of -59.69% indicates heightened vulnerability to market sentiment shifts
- Speculative trading dynamics create sharp intraday volatility unrelated to fundamental developments
- Lower market capitalization ($2.03 billion) relative to XLM increases susceptibility to capital flight during bear markets
Technical Risk
Stellar (XLM):
- Federated Byzantine Agreement (FBA) consensus model depends on validator node selection and trust assumptions
- Network throughput scaling remains limited compared to newer layer-2 solutions
- Technology stack maturity established but faces competition from emerging payment protocols
Ethereum Classic (ETC):
- Proof of Work consensus mechanism subjects network to 51% attack risks amid declining mining profitability
- Smaller hashrate compared to Bitcoin creates potential security vulnerabilities during market downturns
- Smart contract platform functionality remains secondary to original Ethereum ecosystem development priorities
Regulatory Risk
- Both assets operate within uncertain global regulatory frameworks for digital asset classification
- Emerging market regulatory developments may impact XLM's remittance use case adoption timelines
- Institutional custody and trading regulations continue to evolve, affecting both platform availability and market liquidity
- Securities classification risk presents potential pressure on exchange listings and institutional fund flows
III. Conclusion: Which Is the Better Buy?
📌 Investment Value Summary:
Stellar (XLM) Advantages:
- Established decentralized payment network with demonstrated real-world remittance and micropayment applications
- Larger market capitalization ($11.51 billion) provides greater liquidity and institutional accessibility
- Technical infrastructure specifically optimized for transaction settlement speeds (2-5 seconds)
- Differentiated fundamental value proposition tied to cross-border transaction infrastructure
Ethereum Classic (ETC) Advantages:
- Institutional exposure through Grayscale single-asset trust vehicles
- Smart contract platform functionality enables broader decentralized application development
- Established security model with historical network stability
- Trading availability across major exchange platforms
✅ Investment Recommendations:
Beginner Investors:
- Focus on XLM for clearer use case clarity and payment infrastructure fundamentals
- Allocate 60% to XLM and 40% to stablecoin reserves during current extreme fear market conditions
- Implement dollar-cost averaging over 6-month periods rather than lump-sum purchases
Experienced Investors:
- Consider tactical allocation shifts based on Fear & Greed Index readings below 25 (extreme fear conditions)
- XLM position emphasis recommended for emerging market payment adoption thesis with 40-50% portfolio allocation
- ETC exposure suitable as speculative satellite position (15-20%) for potential institutional capital inflows
- Monitor Grayscale institutional flow data as leading indicator for ETC price movements
Institutional Investors:
- XLM presents structured opportunity within emerging market fintech infrastructure thesis with verifiable partnership pipeline
- ETC positioning through Grayscale single-asset trust vehicles offers established custody and regulatory frameworks
- Both assets require hedging through Bitcoin exposure (40-50% of portfolio) to manage concentrated altcoin risk
- Recommend quarterly rebalancing protocols triggered by Fear & Greed Index extremes
⚠️ Risk Disclosure: Cryptocurrency markets exhibit extreme volatility with potential for 50%+ losses within short timeframes. Both XLM and ETC displayed significant annual declines despite distinct technical and market positioning. Current market conditions reflect extreme fear sentiment (Fear & Greed Index: 16), which typically precedes high-volatility price movements in either direction. Investment decisions should not exceed capital one can afford to lose completely. Past performance does not guarantee future results. This analysis does not constitute investment advice; consult qualified financial professionals before committing capital.
None
Stellar (XLM) vs Ethereum Classic (ETC): Frequently Asked Questions
FAQ
Q1: What are the key differences between Stellar (XLM) and Ethereum Classic (ETC) in terms of use cases?
A: Stellar (XLM) functions as a decentralized payment network optimized for fast, low-cost cross-border transfers and remittances, with transaction confirmation typically completed within 2-5 seconds. It serves banks, payment institutions, and individuals through a federated consensus model. Ethereum Classic (ETC), conversely, operates as a smart contract platform enabling decentralized applications (DApps) and programmable financial services based on the "code is law" principle, utilizing Proof of Work consensus.
Q2: Which asset demonstrates better current market performance as of December 15, 2025?
A: ETC shows modest positive momentum with a +1.49% 24-hour change, while XLM is declining with -1.8% 24-hour movement. However, XLM maintains significantly larger market capitalization ($11.51 billion versus $2.03 billion for ETC), indicating greater overall market recognition and liquidity. Both assets have experienced substantial annual declines within the current extreme fear market environment (Fear & Greed Index: 16).
Q3: How does the supply structure differ between XLM and ETC?
A: Stellar (XLM) has a fixed maximum total supply of 50,001,786,892 XLM, with 64.70% currently in circulation (32,352,838,015.76 XLM). Ethereum Classic (ETC) has a capped supply of 210,700,000 ETC with 73.43% in circulation. XLM's consensus mechanism relies on federated Byzantine Agreement without mining or staking, whereas ETC employs Proof of Work mining with block rewards decreasing by 20% every 5 million blocks.
Q4: Which asset is better suited for long-term investment?
A: XLM is recommended for investors focused on decentralized payment infrastructure adoption in emerging markets, with clearer fundamental use cases for remittances and micropayments. ETC suits investors seeking smart contract platform exposure with institutional infrastructure support through Grayscale trusts. XLM's larger market capitalization and established payment network provide greater stability, while ETC remains more speculative with higher sensitivity to institutional positioning shifts.
Q5: What price forecasts exist for XLM and ETC through 2030?
A: For 2025, XLM is projected within a range of $0.138078-$0.3175794, while ETC is forecasted at $9.32372-$13.91992. By 2030, XLM is expected to reach $0.310171-$0.54736065 in base scenarios, and ETC $13.902493-$25.7196120. These forecasts represent potential growth trajectories dependent on institutional adoption, ecosystem development, and regulatory clarity, but should not be considered guaranteed predictions.
Q6: What are the primary risks associated with investing in XLM and ETC?
A: Both assets exhibit substantial volatility with XLM declining 45.76% annually and ETC declining 59.69% year-over-year. Technical risks include XLM's dependency on validator node selection within the FBA model and ETC's vulnerability to 51% attacks given its smaller hashrate compared to Bitcoin. Regulatory uncertainty surrounding digital asset classification and emerging market frameworks presents additional risk for XLM's remittance use case development.
Q7: How should investors allocate between XLM and ETC within a diversified portfolio?
A: Conservative investors should allocate 35% to XLM and 25% to ETC, reserving 40% for stablecoins and lower-volatility assets. Aggressive investors may allocate 50% to XLM and 40% to ETC with 10% reserved for tactical rebalancing. Beginners are recommended to focus 60% on XLM with 40% stablecoin reserves during extreme fear conditions, while experienced investors should employ dollar-cost averaging and monitor Fear & Greed Index readings below 25 to identify optimal entry points.
Q8: What indicators suggest institutional adoption differences between XLM and ETC?
A: Both assets are included within Grayscale's single-asset trust fund portfolios, indicating institutional recognition. However, XLM demonstrates differentiated institutional interest through documented partnerships with banking and payment institutions for cross-border transaction infrastructure. ETC's institutional positioning depends primarily on Grayscale fund flows and speculative positioning rather than fundamental network development, making ETC more susceptible to institutional capital outflows during bear market periods.
Disclaimer: These answers are based on historical market data and analysis current as of December 15, 2025. Cryptocurrency markets remain highly volatile and subject to rapid changes. Past performance does not guarantee future results. This information does not constitute investment advice. Investors should conduct comprehensive research and consult qualified financial professionals before making investment decisions. Do not invest capital you cannot afford to lose entirely.
* The information is not intended to be and does not constitute financial advice or any other recommendation of any sort offered or endorsed by Gate.