#ETH
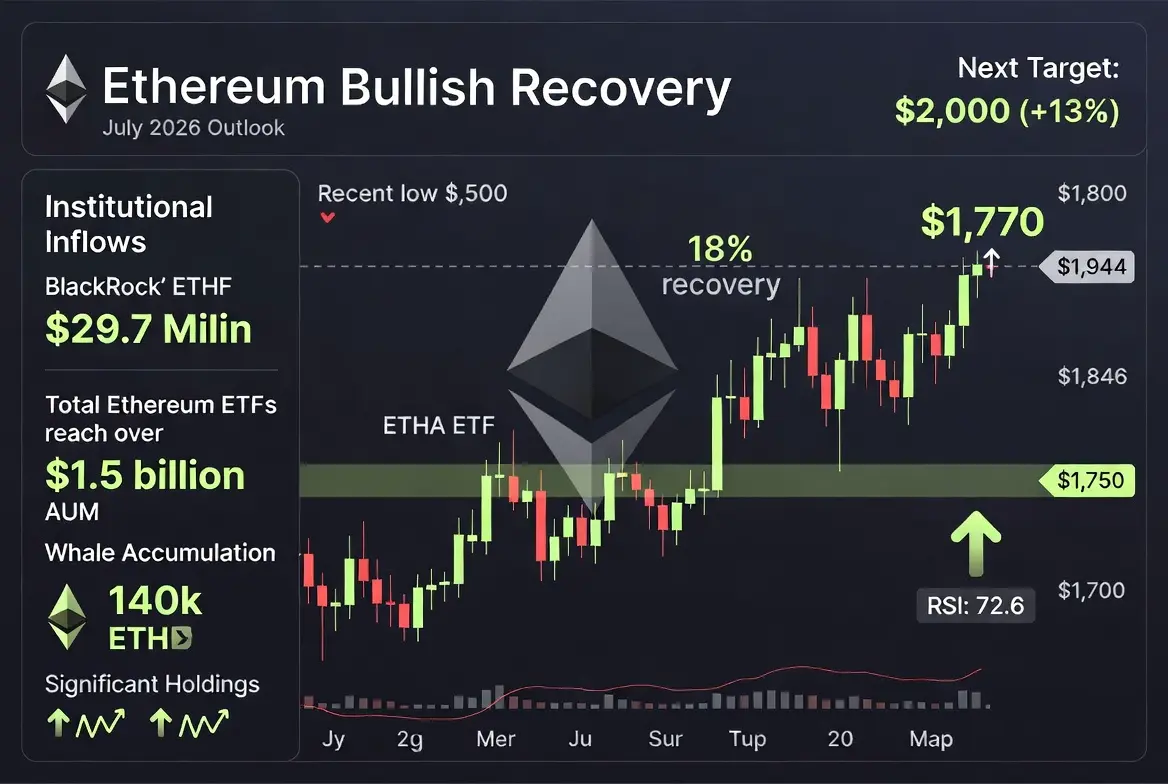
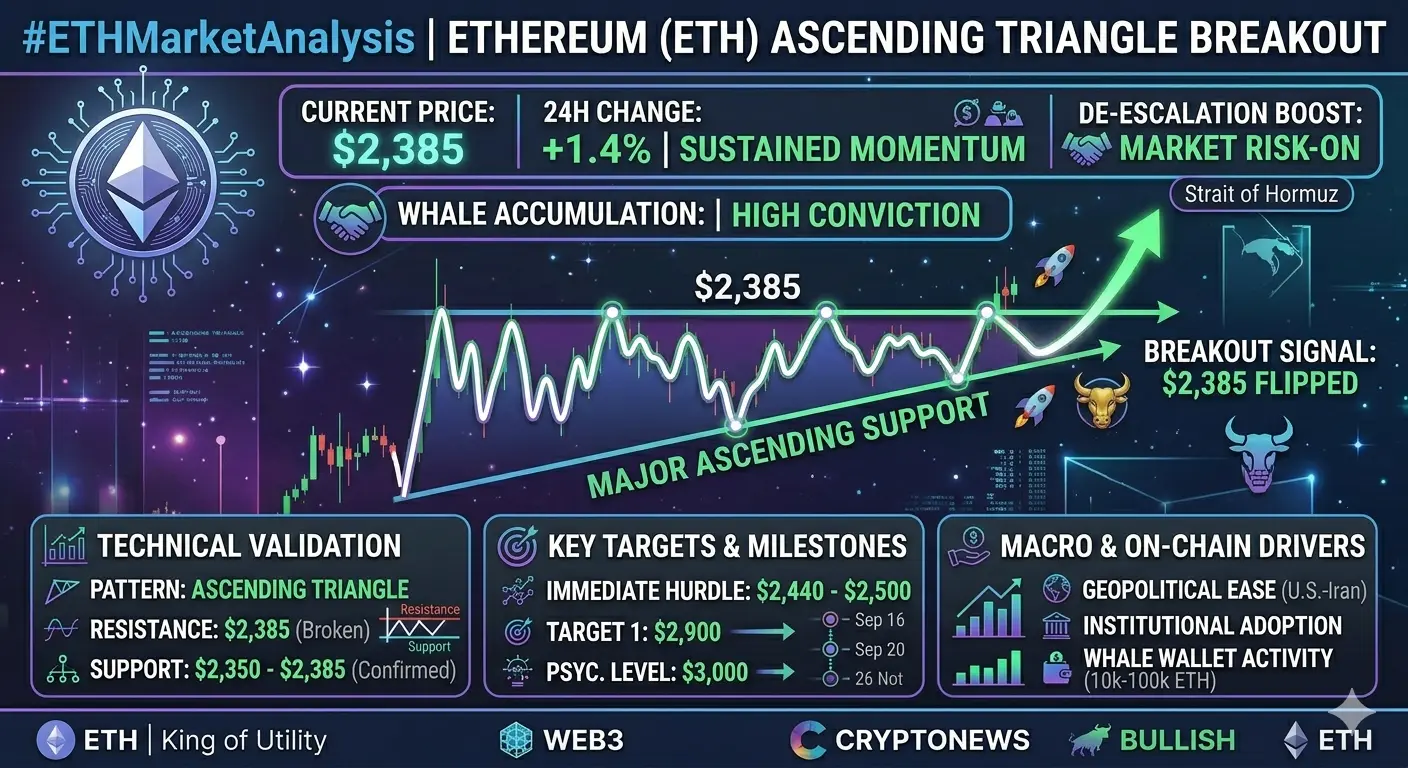
Ethereum is currently trading at approximately 1,770 dollars, representing a remarkable recovery of 18 percent from its recent low of 1,500 dollars observed just five days ago. This substantial price appreciation of 270 dollars within a compressed timeframe signals renewed bullish momentum and growing investor confidence across retail and institutional segments. The current market structure suggests Ethereum is positioned at a critical decision zone where sustained momentum could propel prices toward the psychologically significant 2,000 dollar threshold.
Technical Analysis and Price Structure
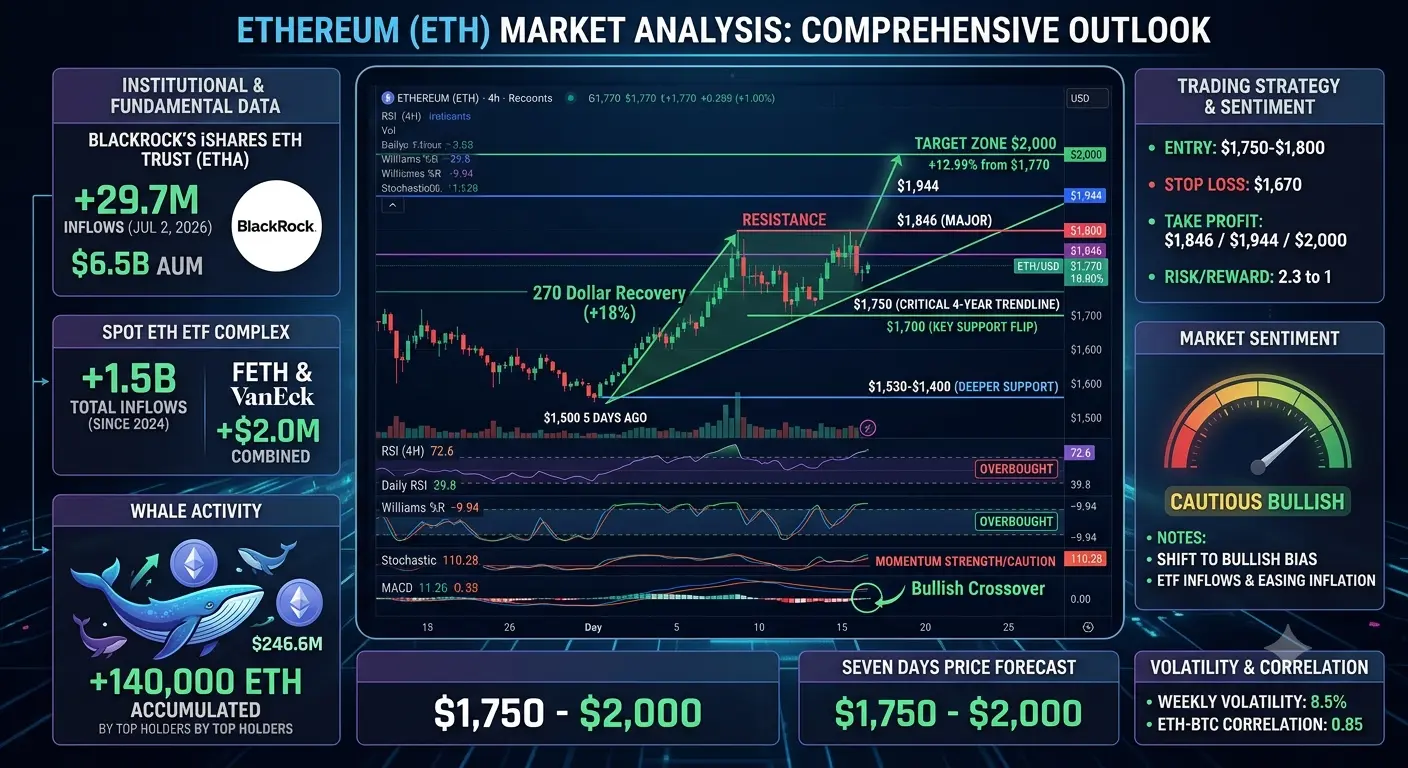
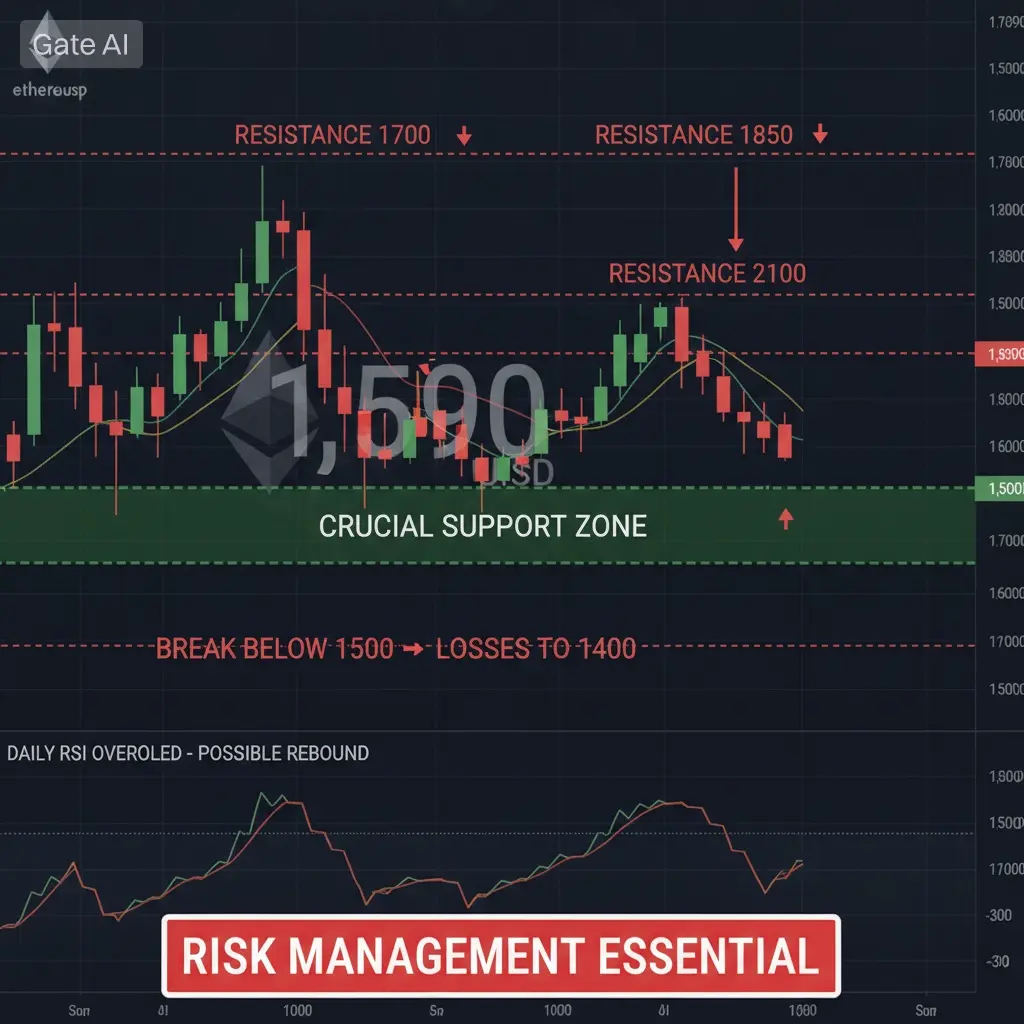
From a technical perspective, Ethereum has successfully reclaimed multiple key demand zones that were previously lost during the broader market correction. The price action demonstrates a clear breakout above the 1,700 dollar support level, which has now flipped into a dynamic support zone. Current technical indicators present a mixed but cautiously optimistic outlook. The Relative Strength Index on the 4-hour timeframe registers approximately 72.6, placing Ethereum in technically overbought territory and suggesting potential short-term consolidation or pullback before the next leg higher. However, the daily RSI shows a more moderate reading around 39.8, indicating substantial room for further upside before reaching overextended conditions.
The Williams Percent Range indicator currently reads negative 9.94, which confirms the overbought conditions on shorter timeframes. The daily Stochastic oscillator shows values near 110.28, demonstrating momentum strength but also highlighting the need for caution as these elevated readings often precede temporary corrections. The Moving Average Convergence Divergence indicator on multiple timeframes has generated bullish crossovers, with the MACD line positioned above the signal line, supporting the continuation of the current uptrend.
Key Support and Resistance Levels
Critical support levels for Ethereum are established at 1,750 dollars, 1,700 dollars, and the deeper support zone between 1,400 and 1,530 dollars. The 1,750 dollar level represents the 4-year trendline support that has been tested multiple times throughout 2026, making it a crucial line in the sand for bulls. A sustained break below this level would invalidate the current bullish structure and open the path toward the 1,400 dollar support zone.
On the resistance side, immediate resistance is encountered at 1,800 dollars, followed by the major psychological barrier at 1,846 dollars. Beyond this level, the 1,944 dollar mark represents a significant technical resistance where previous selling pressure emerged. The ultimate target for this bullish phase remains the 2,000 dollar level, which coincides with the weekly Fast Moving Average line and represents a 12.99 percent gain from current prices. More ambitious projections from technical analysts suggest potential extensions toward 2,200 dollars to 2,350 dollars if momentum sustains, representing an additional 24.29 percent to 32.77 percent appreciation from present levels.
Institutional Accumulation and Whale Activity
The fundamental backdrop supporting Ethereum's recovery has strengthened considerably through substantial institutional buying and whale accumulation. BlackRock's iShares Ethereum Trust ETF, ticker symbol ETHA, has emerged as the dominant force in institutional Ethereum adoption. Recent data indicates that ETHA captured 29.7 million dollars in inflows on July 2, 2026, representing the second consecutive day of positive flows across the entire Ethereum ETF complex. BlackRock's Ethereum ETF has accumulated approximately 6.5 billion dollars in assets under management, establishing it as the undisputed heavyweight among Ethereum spot ETFs.
Fidelity's Ethereum Fund, designated FETH, contributed an additional 0.8 million dollars in inflows on the same day, while VanEck added 1.2 million dollars. The cumulative net inflows across all nine Ethereum spot ETFs have surpassed 1.5 billion dollars since their July 2024 launch, demonstrating sustained institutional appetite for regulated Ethereum exposure. This institutional participation represents a fundamental shift in how traditional finance accesses cryptocurrency markets, providing a regulated gateway for conventional investors seeking Ethereum exposure without direct custody requirements.
On-chain data reveals significant whale accumulation activity, with addresses holding more than 10,000 Ethereum purchasing over 140,000 Ethereum within recent days. This accumulation of approximately 246.6 million dollars worth of Ethereum by large holders signals strong conviction among sophisticated market participants regarding Ethereum's long-term value proposition. The whale accumulation trend has been particularly pronounced near key support areas, suggesting that large holders view current price levels as attractive entry points for long-term positioning.
Trading Strategy and Risk Management
For active traders, the current Ethereum setup presents both opportunity and risk that requires careful position management. The optimal trading strategy involves monitoring the 1,750 to 1,800 dollar range for directional confirmation. A weekly close above 1,800 dollars would trigger a high-probability move toward the 2,000 dollar target, representing a 12.99 percent upside from current levels. Traders should establish long positions with stop-loss orders placed below 1,670 dollars, which represents the invalidation point for the current bullish setup.
Risk management parameters should account for the overbought conditions on shorter timeframes. The 4-hour RSI reading of 72.6 suggests that a pullback toward the 1,750 dollar support zone is probable before the next leg higher. Traders can utilize this potential retracement as an opportunity to scale into positions at more favorable risk-reward ratios. The risk-reward profile for Ethereum longs remains attractive, with potential upside of 230 dollars to 2,000 dollars versus downside risk of approximately 100 dollars to the invalidation level.
Short-term price targets include 1,846 dollars as the first take-profit level, representing a 4.29 percent gain from current prices. The second target at 1,944 dollars offers 9.83 percent upside, while the third target at 2,050 dollars represents 15.82 percent appreciation. These targets align with historical resistance levels and Fibonacci retracement zones that have previously acted as price magnets during bullish phases.
Market Sentiment and Trader Consensus
Trader sentiment across social media platforms and professional analysis channels has shifted decisively toward cautious bullishness. Multiple professional traders describe the current price action as a strong trend reversal with bullish shift building momentum. The refusal of Ethereum to make new lows, combined with every dip being bought aggressively, supports the narrative of underlying demand strength. The sentiment analysis indicates that traders are positioning for a push toward the 2,000 dollar target next week if Ethereum secures the 1,750 to 1,800 dollar range.
ETF inflows, which increased nearly 12 percent this week according to available data, combined with easing inflationary fears and shifting Federal Reserve policy expectations, are cited as primary tailwinds supporting a reversion to the 2,000 dollar level in the coming weeks. Regulatory concerns continue to cap the upside sentiment to some extent, but overall market chatter targets 2,000 dollars and beyond with potential extensions to 2,200 dollars to 2,350 dollars according to optimistic analyst projections.
Percentage Calculations and Mathematical Analysis
The recovery from 1,500 dollars to 1,770 dollars represents a gain of 270 dollars, which translates to exactly 18 percent appreciation over five trading days. This calculates to an average daily gain of 3.6 percent during the recovery phase. The distance from current prices at 1,770 dollars to the 2,000 dollar target is 230 dollars, representing a required gain of 12.99 percent. If Ethereum achieves the 2,000 dollar target, the total recovery from the 1,500 dollar low would amount to 500 dollars, representing a 33.33 percent gain.
The risk-reward ratio for a long position from current levels with a stop at 1,670 dollars and target at 2,000 dollars calculates to 2.3 to 1, meaning traders risk 100 dollars to potentially gain 230 dollars. This represents a favorable asymmetric opportunity for disciplined traders. The probability-weighted expected value of this trade, assuming a 60 percent probability of reaching target and 40 percent probability of hitting stop-loss, yields a positive expected return of 98 dollars per unit of Ethereum traded.
Weekly price volatility has averaged approximately 8.5 percent over the past month, suggesting that the 12.99 percent move required to reach 2,000 dollars is within normal market parameters and achievable within a one to two week timeframe if momentum sustains. The correlation between Ethereum and Bitcoin price movements remains elevated at approximately 0.85, meaning Ethereum will likely follow any significant Bitcoin directional moves with amplified volatility.
Next Seven Days Price Forecast
The seven-day outlook for Ethereum remains constructive with a bias toward the upside, contingent upon maintaining support above the 1,750 dollar level. The most probable scenario involves Ethereum consolidating in the 1,750 to 1,850 dollar range for the first two to three days of the week, allowing overbought technical indicators to normalize while building a base for the next advance. Following this consolidation period, a push toward the 1,900 to 1,950 dollar zone becomes likely, with the 2,000 dollar psychological level representing the primary target for the week ending July 12, 2026.
Alternative scenarios include a deeper retracement toward 1,700 dollars if the 1,750 dollar support fails to hold, which would delay the 2,000 dollar target but potentially create an even more attractive entry point for long-term investors. The bearish scenario, with probability estimated at 25 percent, involves a break below 1,670 dollars that would invalidate the current bullish structure and open the path toward 1,550 dollars.
Conclusion and Strategic Recommendations
Ethereum stands at a critical juncture where technical recovery aligns with fundamental institutional support to create a favorable risk-reward environment for long positions. The combination of whale accumulation exceeding 140,000 Ethereum, institutional ETF inflows surpassing 29 million dollars in recent sessions, and improving technical momentum supports the case for continued appreciation toward the 2,000 dollar target. Traders should maintain disciplined risk management with stop-loss orders below 1,670 dollars while targeting 1,846 dollars, 1,944 dollars, and ultimately 2,000 dollars as take-profit levels. The 18 percent recovery from 1,500 dollars demonstrates the resilience of Ethereum demand, and the path toward 2,000 dollars represents an additional 12.99 percent opportunity for participants who maintain proper position sizing and risk controls.
#ETHMarketAnalysis #ETHBreaks1700 @Gate_Square
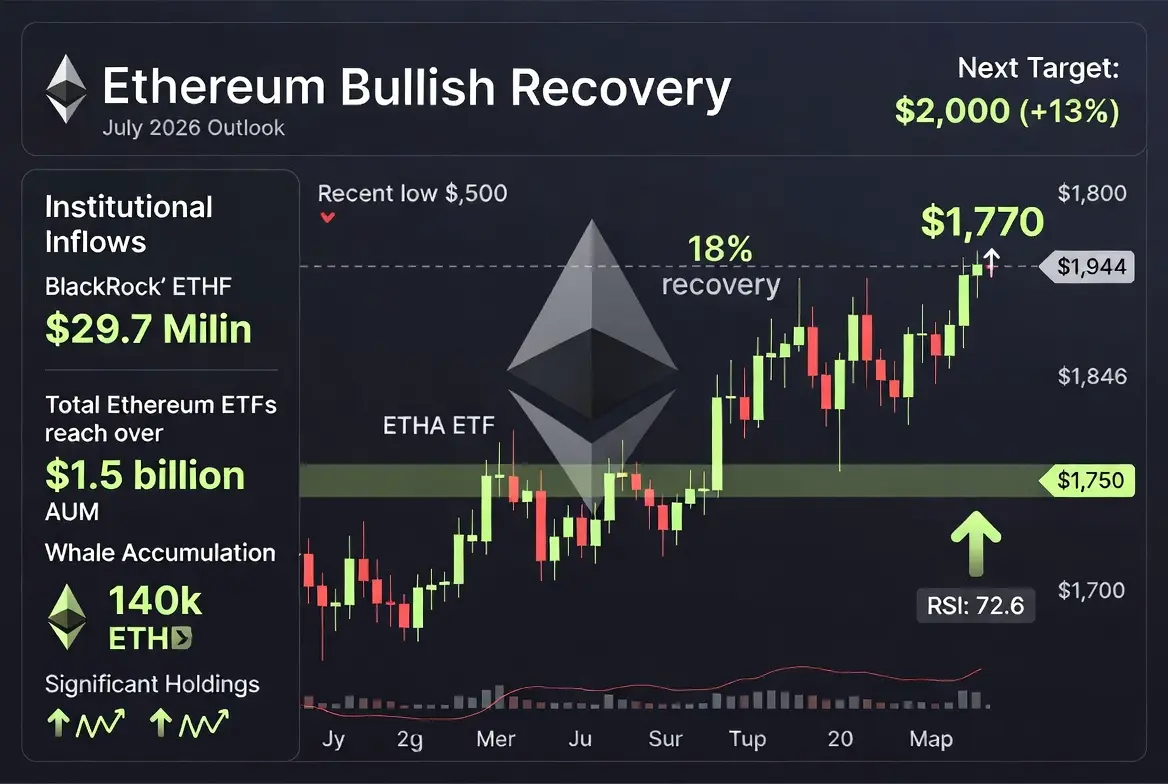
Ethereum is currently trading at approximately 1,770 dollars, representing a remarkable recovery of 18 percent from its recent low of 1,500 dollars observed just five days ago. This substantial price appreciation of 270 dollars within a compressed timeframe signals renewed bullish momentum and growing investor confidence across retail and institutional segments. The current market structure suggests Ethereum is positioned at a critical decision zone where sustained momentum could propel prices toward the psychologically significant 2,000 dollar threshold.
Technical Analysis and Price Structure
From a technical perspective, Ethereum has successfully reclaimed multiple key demand zones that were previously lost during the broader market correction. The price action demonstrates a clear breakout above the 1,700 dollar support level, which has now flipped into a dynamic support zone. Current technical indicators present a mixed but cautiously optimistic outlook. The Relative Strength Index on the 4-hour timeframe registers approximately 72.6, placing Ethereum in technically overbought territory and suggesting potential short-term consolidation or pullback before the next leg higher. However, the daily RSI shows a more moderate reading around 39.8, indicating substantial room for further upside before reaching overextended conditions.
The Williams Percent Range indicator currently reads negative 9.94, which confirms the overbought conditions on shorter timeframes. The daily Stochastic oscillator shows values near 110.28, demonstrating momentum strength but also highlighting the need for caution as these elevated readings often precede temporary corrections. The Moving Average Convergence Divergence indicator on multiple timeframes has generated bullish crossovers, with the MACD line positioned above the signal line, supporting the continuation of the current uptrend.
Key Support and Resistance Levels
Critical support levels for Ethereum are established at 1,750 dollars, 1,700 dollars, and the deeper support zone between 1,400 and 1,530 dollars. The 1,750 dollar level represents the 4-year trendline support that has been tested multiple times throughout 2026, making it a crucial line in the sand for bulls. A sustained break below this level would invalidate the current bullish structure and open the path toward the 1,400 dollar support zone.
On the resistance side, immediate resistance is encountered at 1,800 dollars, followed by the major psychological barrier at 1,846 dollars. Beyond this level, the 1,944 dollar mark represents a significant technical resistance where previous selling pressure emerged. The ultimate target for this bullish phase remains the 2,000 dollar level, which coincides with the weekly Fast Moving Average line and represents a 12.99 percent gain from current prices. More ambitious projections from technical analysts suggest potential extensions toward 2,200 dollars to 2,350 dollars if momentum sustains, representing an additional 24.29 percent to 32.77 percent appreciation from present levels.
Institutional Accumulation and Whale Activity
The fundamental backdrop supporting Ethereum's recovery has strengthened considerably through substantial institutional buying and whale accumulation. BlackRock's iShares Ethereum Trust ETF, ticker symbol ETHA, has emerged as the dominant force in institutional Ethereum adoption. Recent data indicates that ETHA captured 29.7 million dollars in inflows on July 2, 2026, representing the second consecutive day of positive flows across the entire Ethereum ETF complex. BlackRock's Ethereum ETF has accumulated approximately 6.5 billion dollars in assets under management, establishing it as the undisputed heavyweight among Ethereum spot ETFs.
Fidelity's Ethereum Fund, designated FETH, contributed an additional 0.8 million dollars in inflows on the same day, while VanEck added 1.2 million dollars. The cumulative net inflows across all nine Ethereum spot ETFs have surpassed 1.5 billion dollars since their July 2024 launch, demonstrating sustained institutional appetite for regulated Ethereum exposure. This institutional participation represents a fundamental shift in how traditional finance accesses cryptocurrency markets, providing a regulated gateway for conventional investors seeking Ethereum exposure without direct custody requirements.
On-chain data reveals significant whale accumulation activity, with addresses holding more than 10,000 Ethereum purchasing over 140,000 Ethereum within recent days. This accumulation of approximately 246.6 million dollars worth of Ethereum by large holders signals strong conviction among sophisticated market participants regarding Ethereum's long-term value proposition. The whale accumulation trend has been particularly pronounced near key support areas, suggesting that large holders view current price levels as attractive entry points for long-term positioning.
Trading Strategy and Risk Management
For active traders, the current Ethereum setup presents both opportunity and risk that requires careful position management. The optimal trading strategy involves monitoring the 1,750 to 1,800 dollar range for directional confirmation. A weekly close above 1,800 dollars would trigger a high-probability move toward the 2,000 dollar target, representing a 12.99 percent upside from current levels. Traders should establish long positions with stop-loss orders placed below 1,670 dollars, which represents the invalidation point for the current bullish setup.
Risk management parameters should account for the overbought conditions on shorter timeframes. The 4-hour RSI reading of 72.6 suggests that a pullback toward the 1,750 dollar support zone is probable before the next leg higher. Traders can utilize this potential retracement as an opportunity to scale into positions at more favorable risk-reward ratios. The risk-reward profile for Ethereum longs remains attractive, with potential upside of 230 dollars to 2,000 dollars versus downside risk of approximately 100 dollars to the invalidation level.
Short-term price targets include 1,846 dollars as the first take-profit level, representing a 4.29 percent gain from current prices. The second target at 1,944 dollars offers 9.83 percent upside, while the third target at 2,050 dollars represents 15.82 percent appreciation. These targets align with historical resistance levels and Fibonacci retracement zones that have previously acted as price magnets during bullish phases.
Market Sentiment and Trader Consensus
Trader sentiment across social media platforms and professional analysis channels has shifted decisively toward cautious bullishness. Multiple professional traders describe the current price action as a strong trend reversal with bullish shift building momentum. The refusal of Ethereum to make new lows, combined with every dip being bought aggressively, supports the narrative of underlying demand strength. The sentiment analysis indicates that traders are positioning for a push toward the 2,000 dollar target next week if Ethereum secures the 1,750 to 1,800 dollar range.
ETF inflows, which increased nearly 12 percent this week according to available data, combined with easing inflationary fears and shifting Federal Reserve policy expectations, are cited as primary tailwinds supporting a reversion to the 2,000 dollar level in the coming weeks. Regulatory concerns continue to cap the upside sentiment to some extent, but overall market chatter targets 2,000 dollars and beyond with potential extensions to 2,200 dollars to 2,350 dollars according to optimistic analyst projections.
Percentage Calculations and Mathematical Analysis
The recovery from 1,500 dollars to 1,770 dollars represents a gain of 270 dollars, which translates to exactly 18 percent appreciation over five trading days. This calculates to an average daily gain of 3.6 percent during the recovery phase. The distance from current prices at 1,770 dollars to the 2,000 dollar target is 230 dollars, representing a required gain of 12.99 percent. If Ethereum achieves the 2,000 dollar target, the total recovery from the 1,500 dollar low would amount to 500 dollars, representing a 33.33 percent gain.
The risk-reward ratio for a long position from current levels with a stop at 1,670 dollars and target at 2,000 dollars calculates to 2.3 to 1, meaning traders risk 100 dollars to potentially gain 230 dollars. This represents a favorable asymmetric opportunity for disciplined traders. The probability-weighted expected value of this trade, assuming a 60 percent probability of reaching target and 40 percent probability of hitting stop-loss, yields a positive expected return of 98 dollars per unit of Ethereum traded.
Weekly price volatility has averaged approximately 8.5 percent over the past month, suggesting that the 12.99 percent move required to reach 2,000 dollars is within normal market parameters and achievable within a one to two week timeframe if momentum sustains. The correlation between Ethereum and Bitcoin price movements remains elevated at approximately 0.85, meaning Ethereum will likely follow any significant Bitcoin directional moves with amplified volatility.
Next Seven Days Price Forecast
The seven-day outlook for Ethereum remains constructive with a bias toward the upside, contingent upon maintaining support above the 1,750 dollar level. The most probable scenario involves Ethereum consolidating in the 1,750 to 1,850 dollar range for the first two to three days of the week, allowing overbought technical indicators to normalize while building a base for the next advance. Following this consolidation period, a push toward the 1,900 to 1,950 dollar zone becomes likely, with the 2,000 dollar psychological level representing the primary target for the week ending July 12, 2026.
Alternative scenarios include a deeper retracement toward 1,700 dollars if the 1,750 dollar support fails to hold, which would delay the 2,000 dollar target but potentially create an even more attractive entry point for long-term investors. The bearish scenario, with probability estimated at 25 percent, involves a break below 1,670 dollars that would invalidate the current bullish structure and open the path toward 1,550 dollars.
Conclusion and Strategic Recommendations
Ethereum stands at a critical juncture where technical recovery aligns with fundamental institutional support to create a favorable risk-reward environment for long positions. The combination of whale accumulation exceeding 140,000 Ethereum, institutional ETF inflows surpassing 29 million dollars in recent sessions, and improving technical momentum supports the case for continued appreciation toward the 2,000 dollar target. Traders should maintain disciplined risk management with stop-loss orders below 1,670 dollars while targeting 1,846 dollars, 1,944 dollars, and ultimately 2,000 dollars as take-profit levels. The 18 percent recovery from 1,500 dollars demonstrates the resilience of Ethereum demand, and the path toward 2,000 dollars represents an additional 12.99 percent opportunity for participants who maintain proper position sizing and risk controls.
#ETHMarketAnalysis #ETHBreaks1700 @Gate_Square