TianyuSaidTheTrend

vip
Age 0.7 Year
Peak Tier 0
Having a unique understanding and approach, focusing on short-term contracts and medium to long term Spot strategies, sharing practical experience with my own experiences!
$ETH As I always say, one cake pulls two cakes; there are more setups in the 1702-1705 range—aim to guard against 1690, with a target of 1720-1735#ETH突破1700
ETH-0.35%
View Original
  • Reward
  • Comment
  • Repost
  • Share
Non-farm payroll data is positive, short-term long positions are fine. For operations, lay out long orders in the 610-613 range, defense reference 602, targets 629, 635$BTC #ETH突破1700
BTC0.09%
View Original
  • Reward
  • Comment
  • Repost
  • Share
$BTC The 1-hour chart shows a clear bearish dominance pattern, with the current market in a standard descending consolidation box structure: the oscillation range continues to narrow, the upper edge at 58924 is under pressure from the middle Bollinger band, and support is locked at the previous low of 58172; the highs of the stage rebounds are gradually lowering, and the rebound volume is concurrently shrinking. The market is not forming a bottom, but rather a phase where bears are accumulating strength.
The Bollinger bands are opening downward as a whole, with prices under sustained pressure
BTC0.09%
View Original
  • Reward
  • Comment
  • Repost
  • Share
SOL's current rally started from $64, rebounding and surging to a high of $76 before slightly pulling back to the $74 level. The overall short-term strong structure has not been broken yet, but after continuous surges, on-market profit-taking is gradually being realized and exiting, with the market entering a phase of high-level rotation, consolidation, and rest.
Technically, the bullish trend pattern is very clear. The moving average system maintains a standard bullish alignment, with the 7-day MA successfully crossing above the 30-day MA and continuing to diverge upward. Even if the price pu
SOL-0.70%
View Original
  • Reward
  • Comment
  • Repost
  • Share
A biscuit dragging another biscuit, macro-level bearish pressure hasn't dissipated, the overall bearish pattern on the technical chart still dominates, medium-to-long-term approach remains unchanged, every rebound is an excellent opportunity to go short at highs.
Below the 1500 mark, there is spot buying support acting as a floor, short-term price action is unlikely to break down deeply in one go, Asian session is expected to maintain low-level repeated grinding and consolidation.
Short-term trading strategy
Short positions to be entered in batches: 1620-1630 range, short entries in batches
St
ETH-0.35%
View Original
  • Reward
  • Comment
  • Repost
  • Share
$SOL On the 4-hour timeframe, the MACD has formed a death cross, and the short-term bearish trend still exists; on the 1-hour level, the MACD green bars are narrowing continuously, and the short-term selling momentum has clearly decreased.
The buy order at the first level of the order book is piled up, indicating sufficient market absorption; the current funding rate is -0.0024%, the cost of holding short positions remains high, and shorts are under continuous pressure.
The current price of 71 is running close to the lower Bollinger Band on the 1-hour chart; the 70.4 level below has been teste
SOL-0.70%
View Original
  • Reward
  • Comment
  • Repost
  • Share
SOL afternoon layout 71.5-71.7 long orders, current price 72.2, partners who entered can take profits freely. $SOL
SOL-0.70%
View Original
  • Reward
  • Comment
  • Repost
  • Share
On the 1-hour chart, the MACD has formed a bearish crossover, with volume continuing to shrink; on the 4-hour chart, the MACD remains in the bullish zone, and the Bollinger Bands are gradually narrowing. The order book shows a short premium of 1.85%, funding rate at 0.01%, and overall sentiment is neutral.
The support zone between 71.34 and 71.78 has been tested multiple times under pressure, with buying orders continuously entering at lower levels.
Defense: If the 1-hour MACD declines with increasing volume, or the price quickly breaks below 71.3 without an effective rebound, the current bull
SOL-0.81%
View Original
  • Reward
  • Comment
  • Repost
  • Share
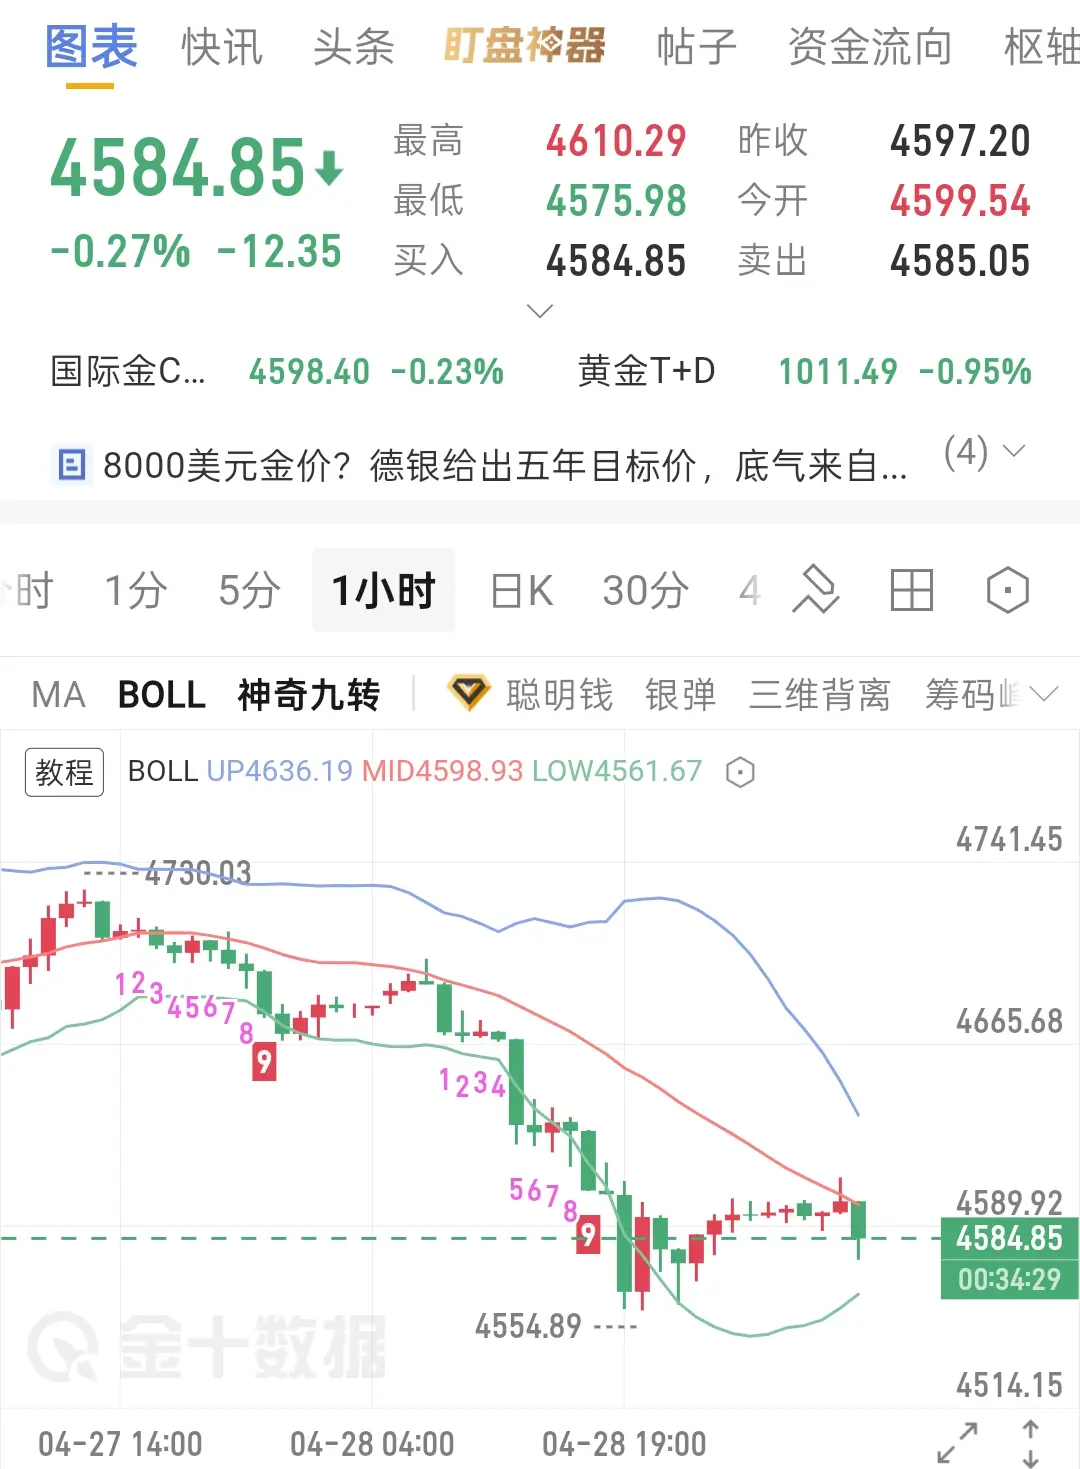
April 29 Gold Analysis
The gold market fell sharply yesterday, with a unilateral decline, and the overall trend has clearly shifted to a bearish one.
Daily level: The stochastic indicator has formed a death cross and is diverging downward, clearly indicating a bearish outlook. Prices continue to fluctuate downward, and the pattern is entirely dominated by a bearish trend. The main support below is around 4450.
4-hour level: Both the stochastic indicator and MACD are in a sluggish state at low levels, showing no signs of stopping the decline or reversing; the pattern still faces downward pressu
View Original
post-image
  • Reward
  • Comment
  • Repost
  • Share
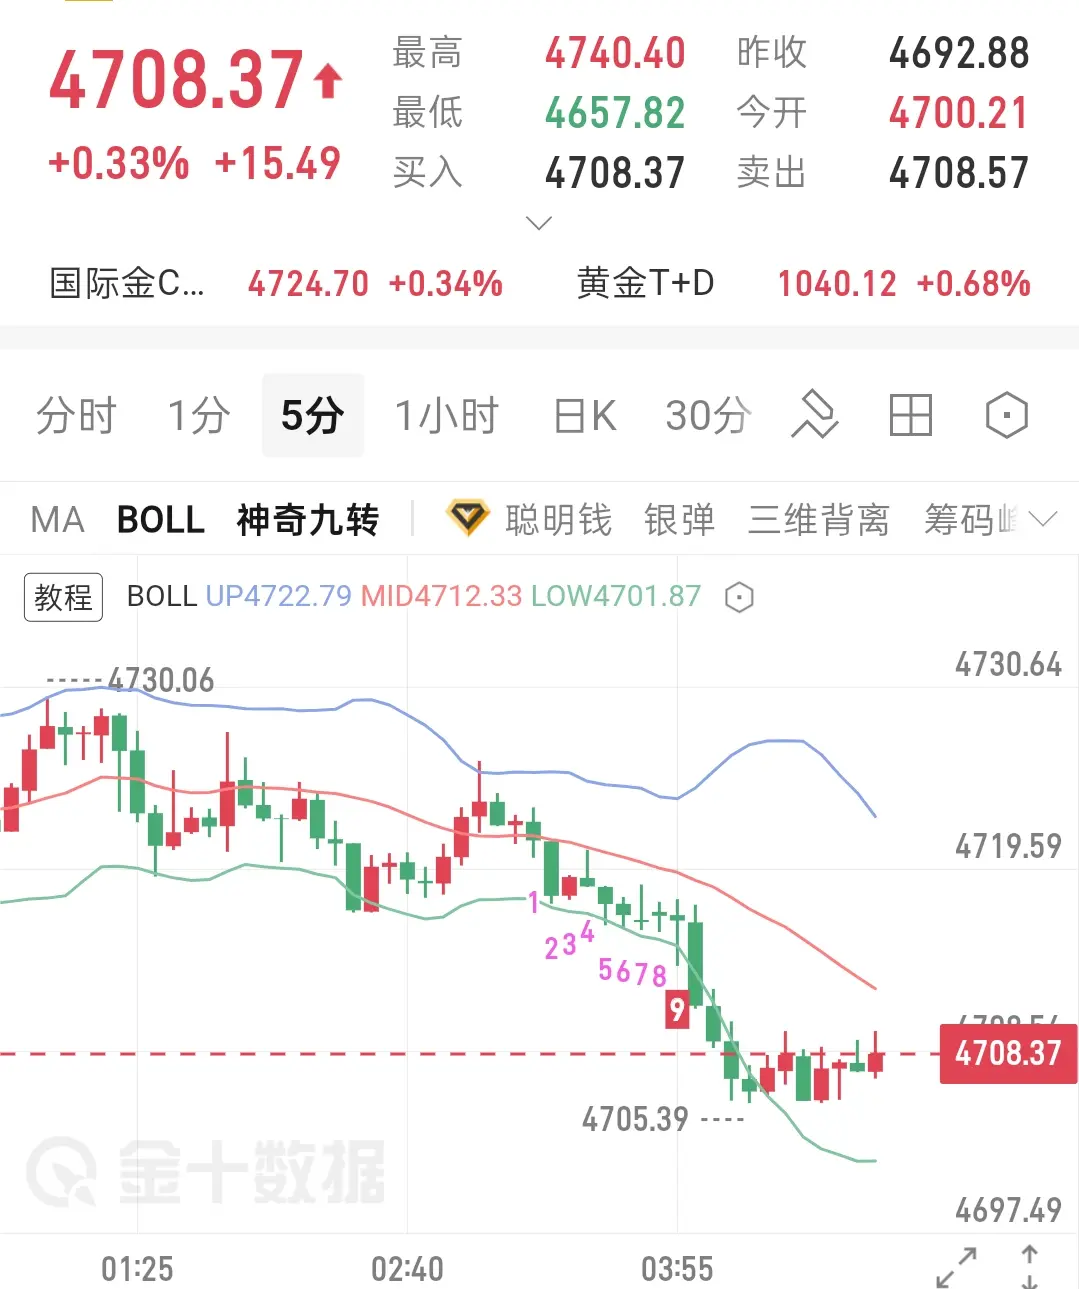
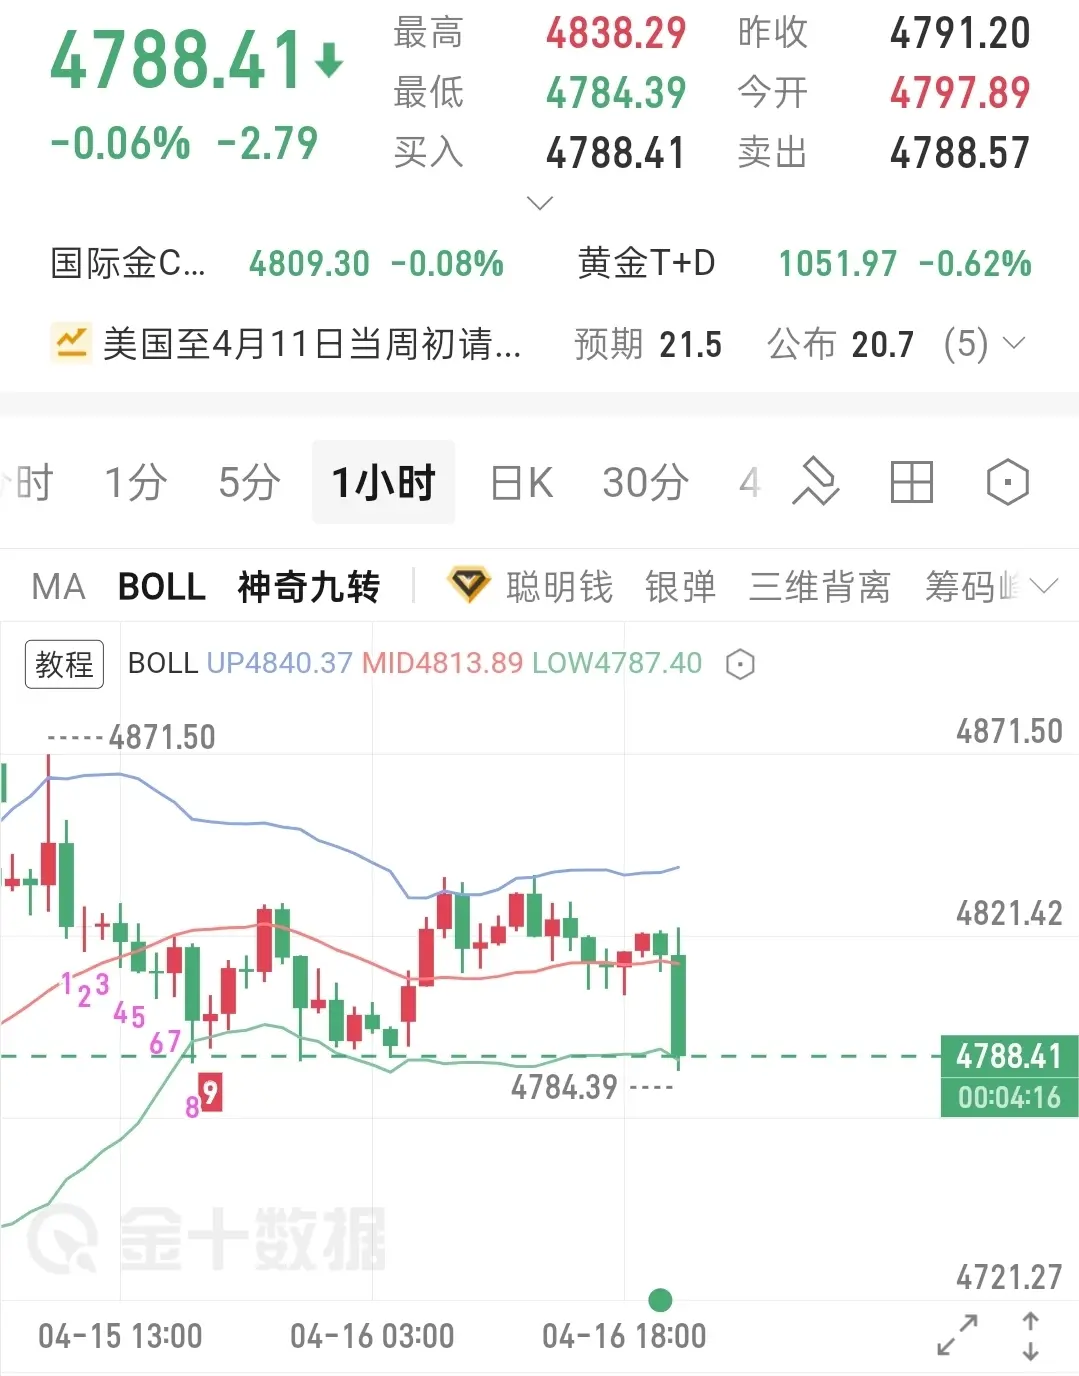
April 27 Gold Analysis:
Currently, gold remains at 4708, consolidating within a narrow range, with the overall market showing a slightly weak oscillation pattern. The medium-term trend is dominated by a bearish trend, but every rebound in gold prices presents a prime opportunity to establish short positions. At this stage, a large number of profitable long positions at high levels are concentrated in exiting and selling, indicating that the bullish momentum has been exhausted.
Previously, gold experienced a significant decline from its high, accumulating a massive amount of long-term profit-ta
View Original
post-image
  • Reward
  • 1
  • Repost
  • Share
irfanc7:
Boncos today, I lost $50 at Xau; maybe tomorrow it can improve.
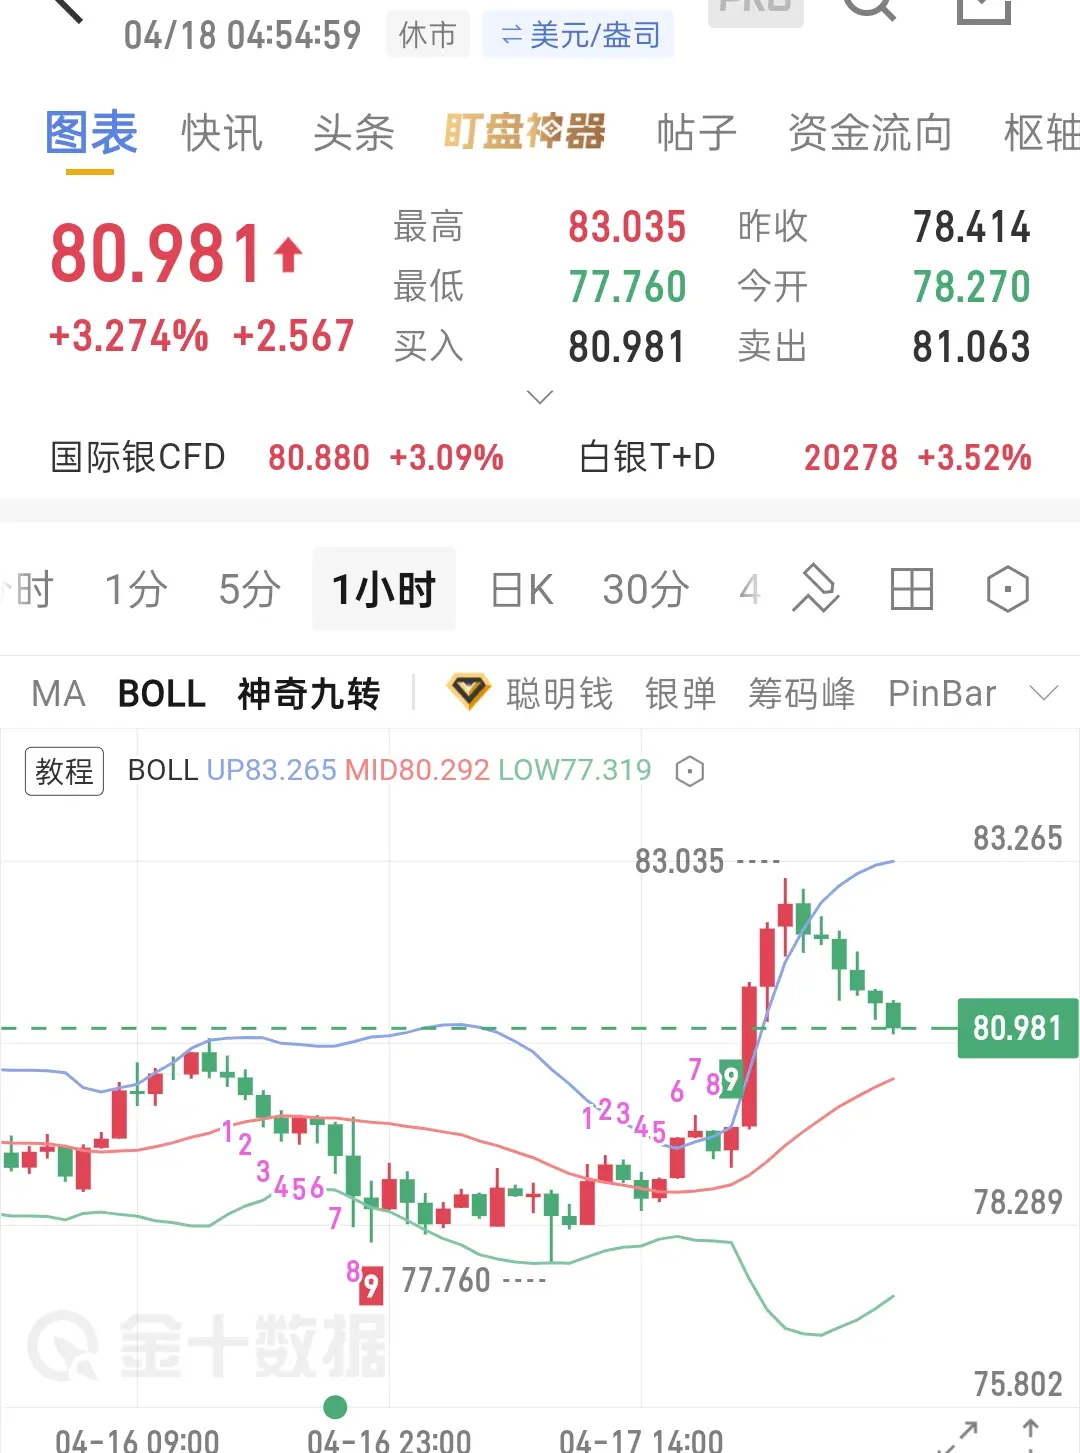
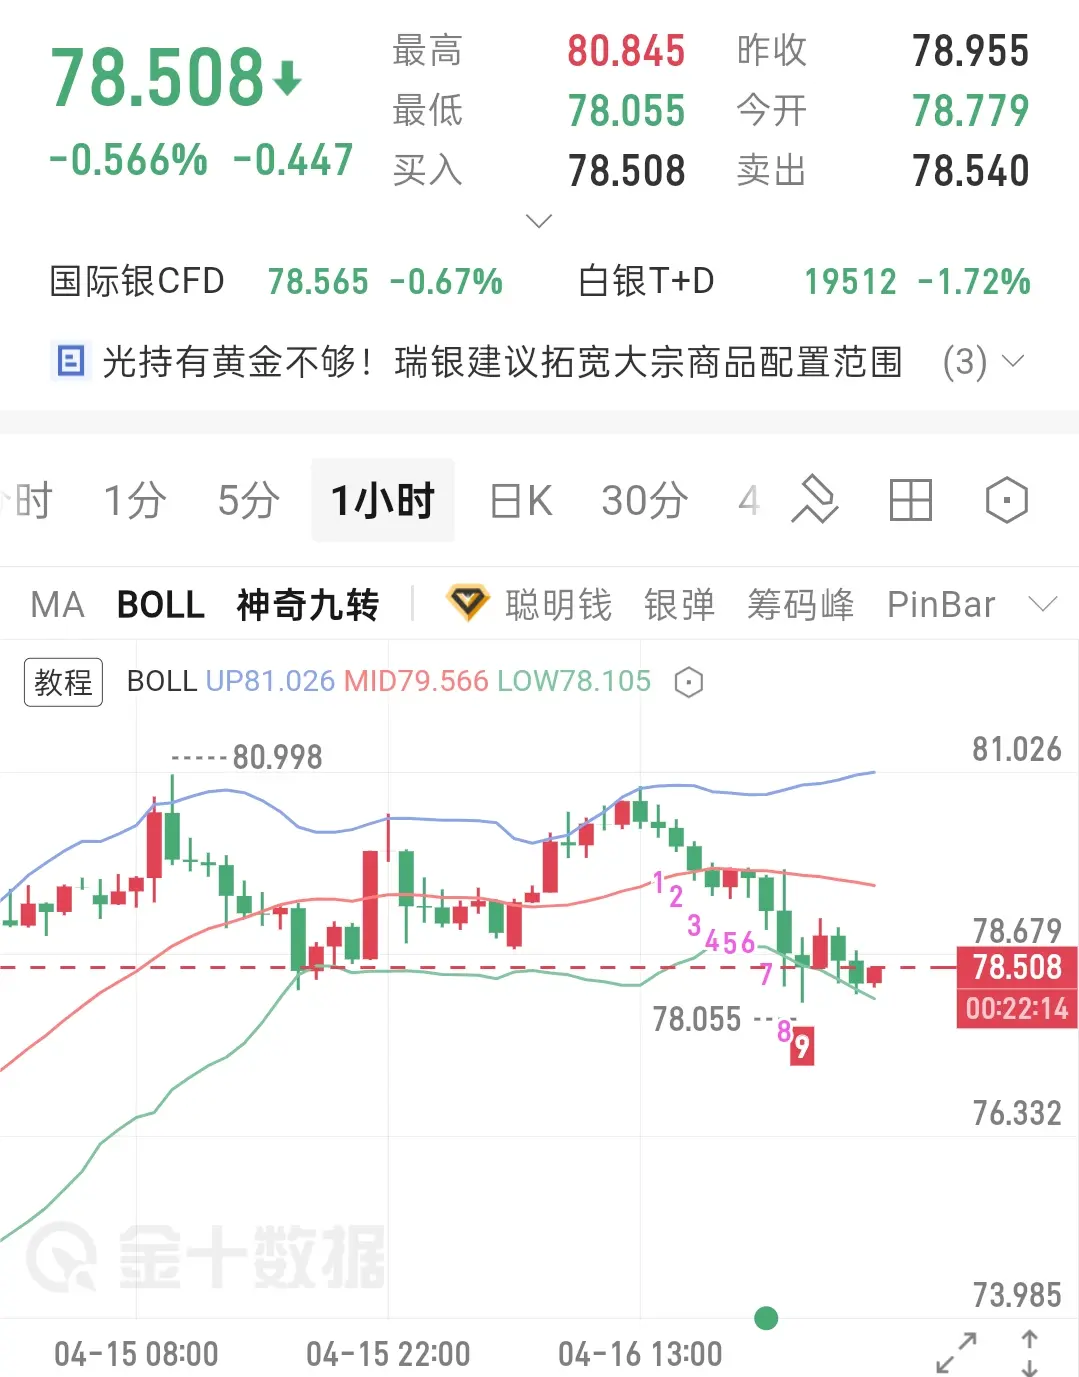
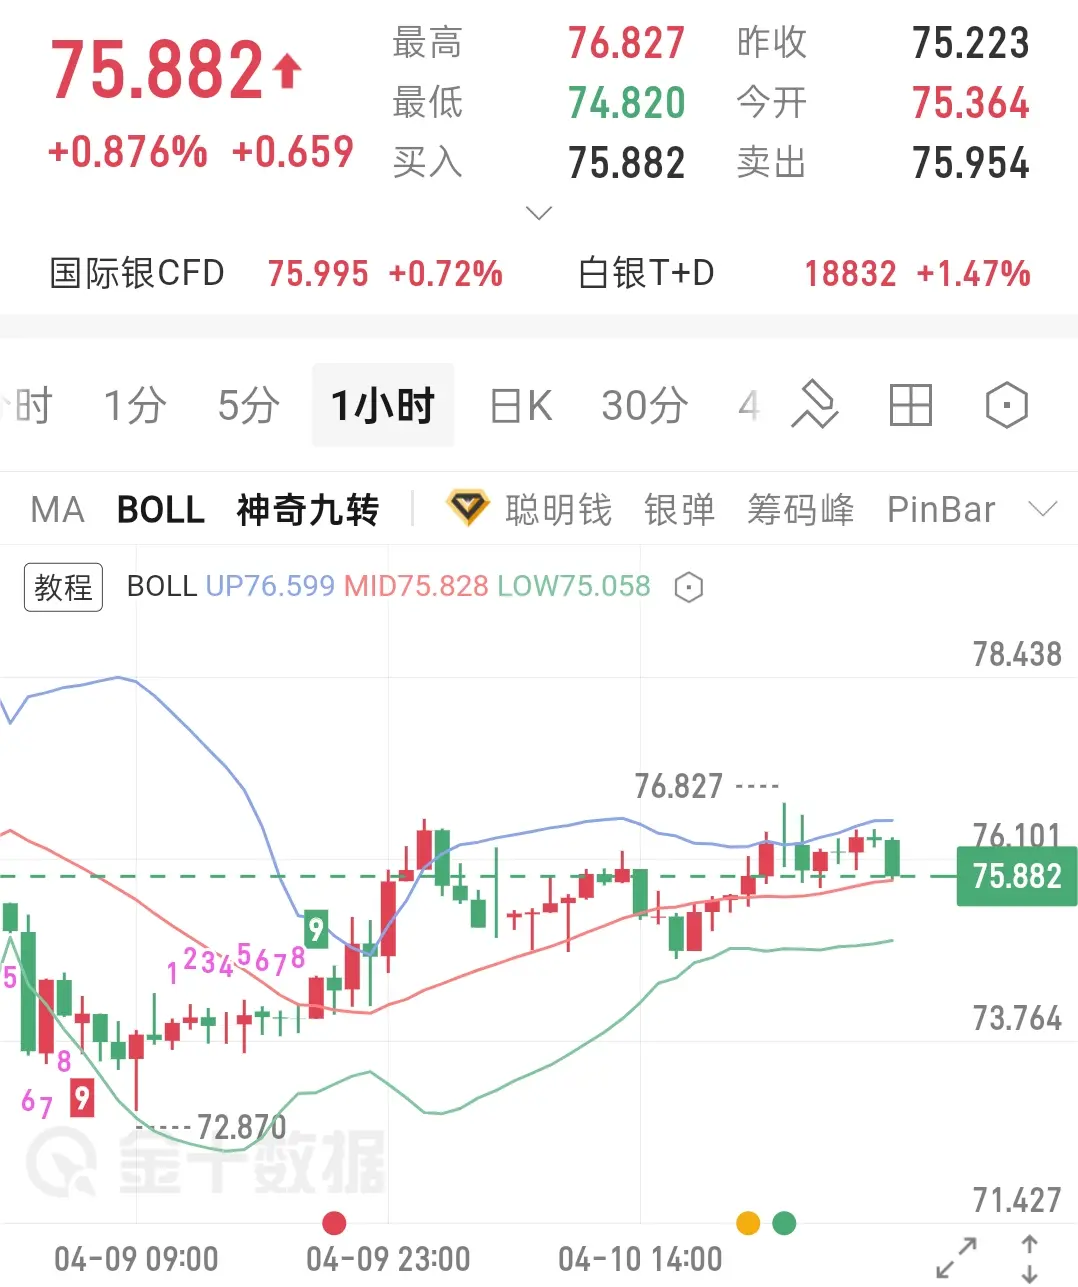
4.20 Silver Analysis
The Federal Reserve's interest rate cut cycle, U.S. March CPI dropped to 3.2%, below market expectations, and rate cut expectations continue to heat up, with a probability of over 78% in September. The U.S. dollar index and U.S. Treasury yields turned downward in April, significantly reducing silver's holding costs. Silver's elasticity far exceeds gold, and after rate cuts are implemented, it often accelerates upward.
Tensions in the Middle East are high, safe-haven funds are flowing in, the U.S. military has extended the aircraft carrier deployment cycle, and the confront
View Original
post-image
  • Reward
  • Comment
  • Repost
  • Share
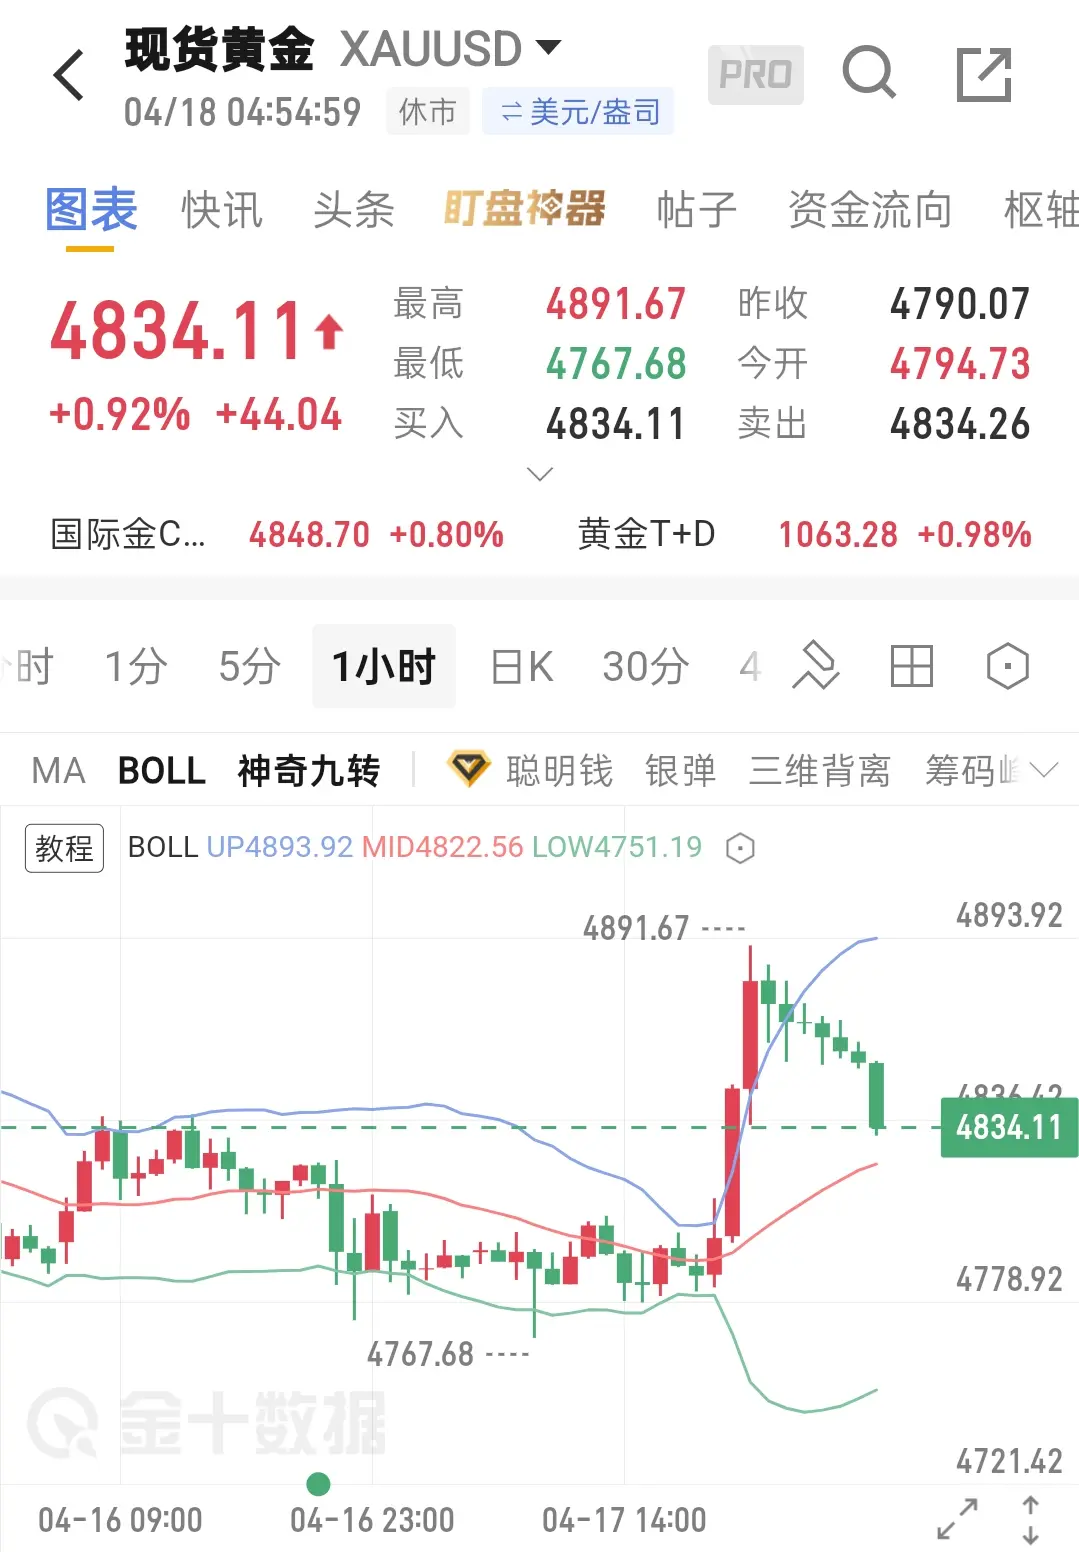
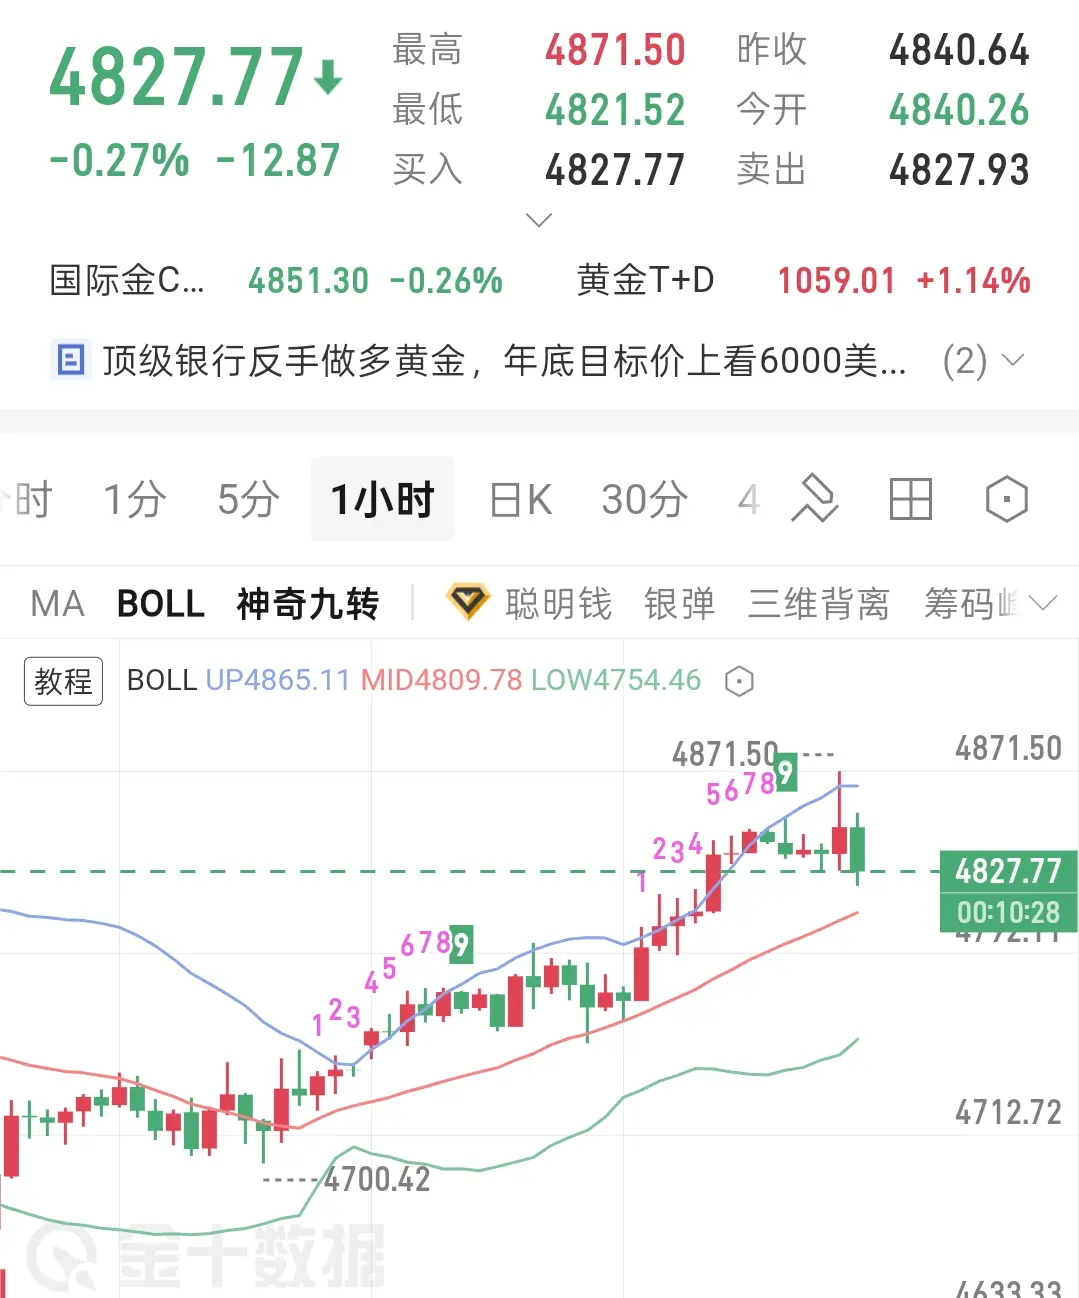
4.20 Gold Market Analysis
This week, gold overall showed a pattern of opening lower and stabilizing, then oscillating upward, with multiple rebounds off support levels during the week, quickly recovering each time, with bullish momentum continuing to dominate. On Friday night, it pushed higher again, strongly breaking through the previous consolidation range, reaching a high of around 4891. Subsequently, due to profit-taking selling pressure, it faced short-term resistance and slightly retreated, ultimately closing near $4,830, with a weekly positive candle, indicating a clear bullish trend.
K
View Original
post-image
  • Reward
  • Comment
  • Repost
  • Share
4.17 Silver Analysis
Silver, like precious metals, is highly correlated with gold. Its trend closely follows gold, but unlike gold, it lacks central bank gold-buying support. Additionally, its high leverage characteristics cause more volatile swings, with downward momentum significantly stronger than gold. All rebounds on the chart are false signals, and a rally to the upside is a good opportunity to establish short positions.
Previously, multiple key support levels have been consecutively broken, with all original support levels turning into resistance. Short-term technical indicators such as
View Original
post-image
  • Reward
  • Comment
  • Repost
  • Share
4.17 Gold Analysis: Confirmed Bearish Trend, Focus on Short Selling
Weekly Level: Gold price has effectively broken below the MA20 critical support line, signaling the end of the medium- to long-term upward trend. After the MACD formed a death cross at high levels, the green bars continued to expand, indicating ongoing bearish momentum. The large-cycle downtrend is clear.
Daily Level: The 5-day, 10-day, and 20-day moving averages are arranged in a standard bearish order, with the gold price trading below all moving averages, showing weak rebounds. The MACD remains below the zero line, continui
View Original
post-image
  • Reward
  • Comment
  • Repost
  • Share
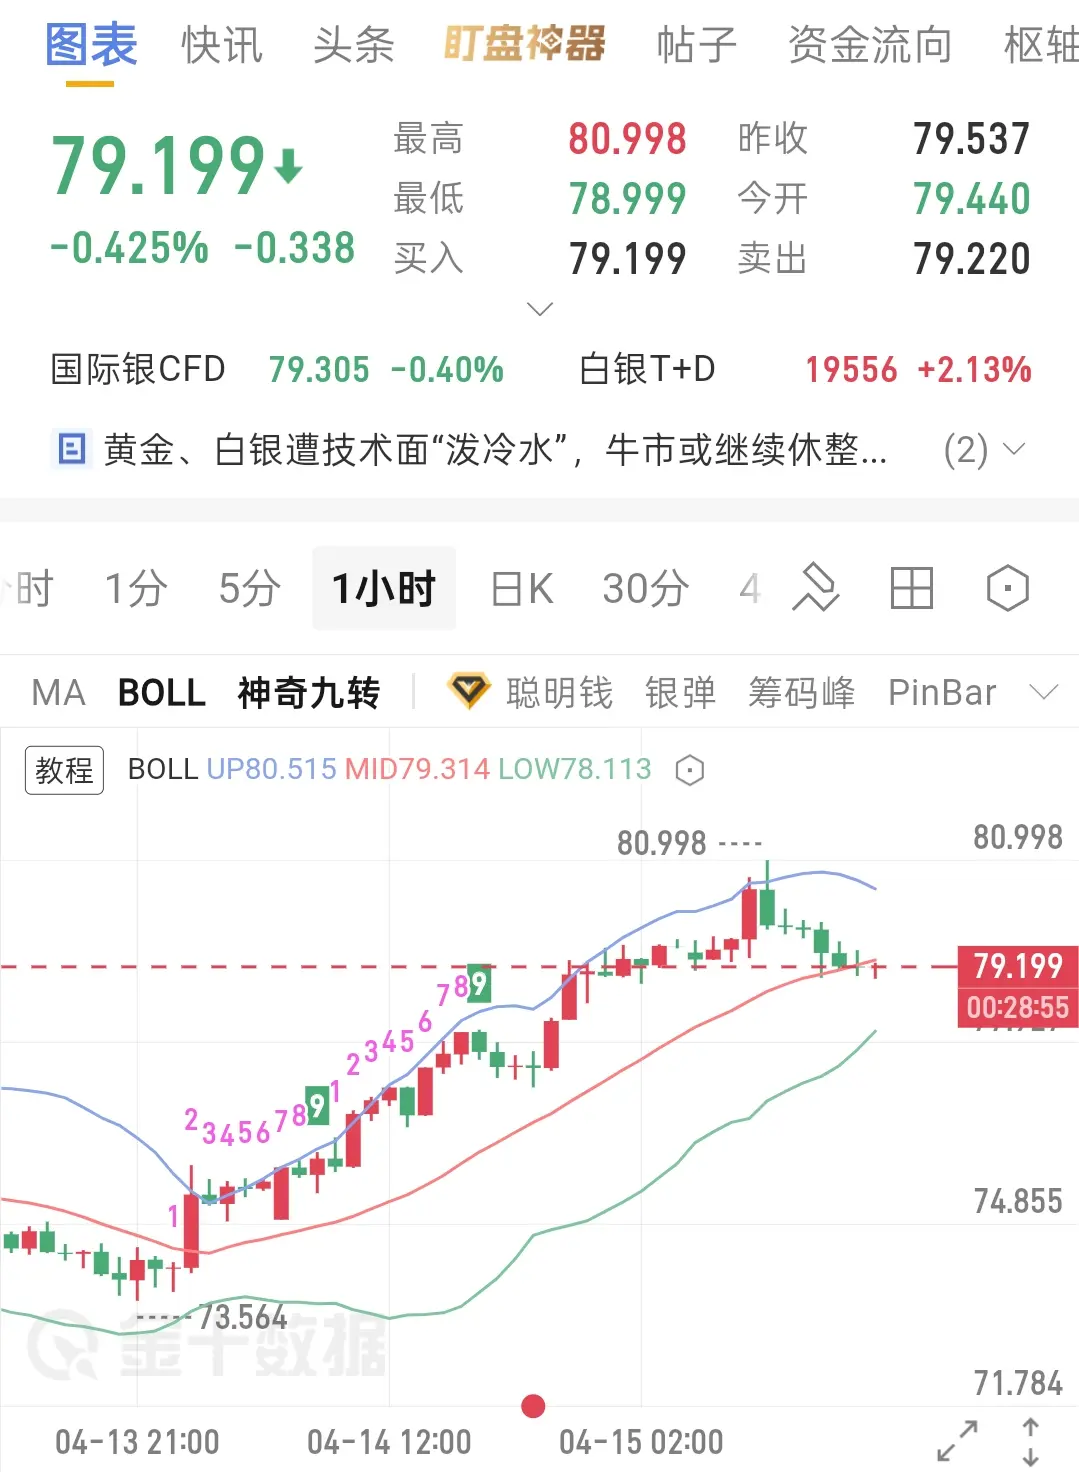
4.15 Silver Analysis: The daily chart shows a bullish arrangement pattern, with the overall upward trend remaining intact. The MACD indicator's two lines continue to diverge upward, with red momentum bars steadily increasing. The RSI indicator is also rising, indicating that the bulls are dominating the market, and the medium-term bullish pattern is clear.
However, it should be noted that short-term cycle indicators have entered the overbought zone. After continuous price increases, a large amount of profit-taking has accumulated. In the short term, there is a need for consolidation to digest
View Original
post-image
  • Reward
  • Comment
  • Repost
  • Share
U.S.-Iran negotiations resume again, optimistic expectations continue to ferment, bulls make a strong return, 4800 solidifies support, aiming at the 5000 level!
The signals of the U.S.-Iran negotiation restart are clear. Market optimism keeps heating up. Geopolitical risks in the Middle East gradually ease. Coupled with the weaker U.S. dollar and the renewed outlook for rate cuts, multiple positive factors converge to drive a strong rebound in gold, and it manages to firmly hold the crucial integer level of 4800.
From a technical perspective, the gold price strongly breaks through the prior re
View Original
post-image
  • Reward
  • Comment
  • Repost
  • Share
4.13 Crude Oil Analysis:
The medium-term upward trend is very clear. The current short-term pullback is just an opportunity to enter the market.
Main logic:
Geopolitical risks are still present, crude oil supply remains tight, and inventories are at low levels. The bullish trend still dominates above, so the strategy is to buy on dips.
Conservative traders can go long directly at the opening price of 95.7.
Trading suggestions:
Buy within the 93-95 range, with targets at 100, 105, and above 110. #美伊停火协议谈判再生变故
View Original
  • Reward
  • Comment
  • Repost
  • Share
4.13 Silver Analysis:
Silver is currently at a high level, with the overall trend leaning weak and oscillating downward. The sharp rise in oil prices has raised concerns that inflation will continue to increase, causing the US dollar and US Treasury yields to rise accordingly, which directly increases the cost of holding gold. The appeal of silver, which does not pay interest, also diminishes.
Previously, long investors started to take profits and exit, and combined with market volatility, institutions tend to sell gold for cash. The bullish funds are continuously withdrawing, and the bearish
XAG-3.02%
View Original
post-image
  • Reward
  • Comment
  • Repost
  • Share
ETH and Bitcoin are basically moving in sync, just follow the big brother~ It is recommended to buy long between 3010-3030, with an initial target of 3090. If it doesn't break the previous high, you can also take the opposite position to short. Remember, once the support level is broken, you need to be cautious of the falling risk!

Overall idea

In the short term, the main strategy is to make money by "buying low". If you encounter a key resistance level that you can't break through, try "selling high" in small amounts. Whether you are going long or shorting, you must control the ri
ETH-0.35%
View Original
post-image
  • Reward
  • Comment
  • Repost
  • Share
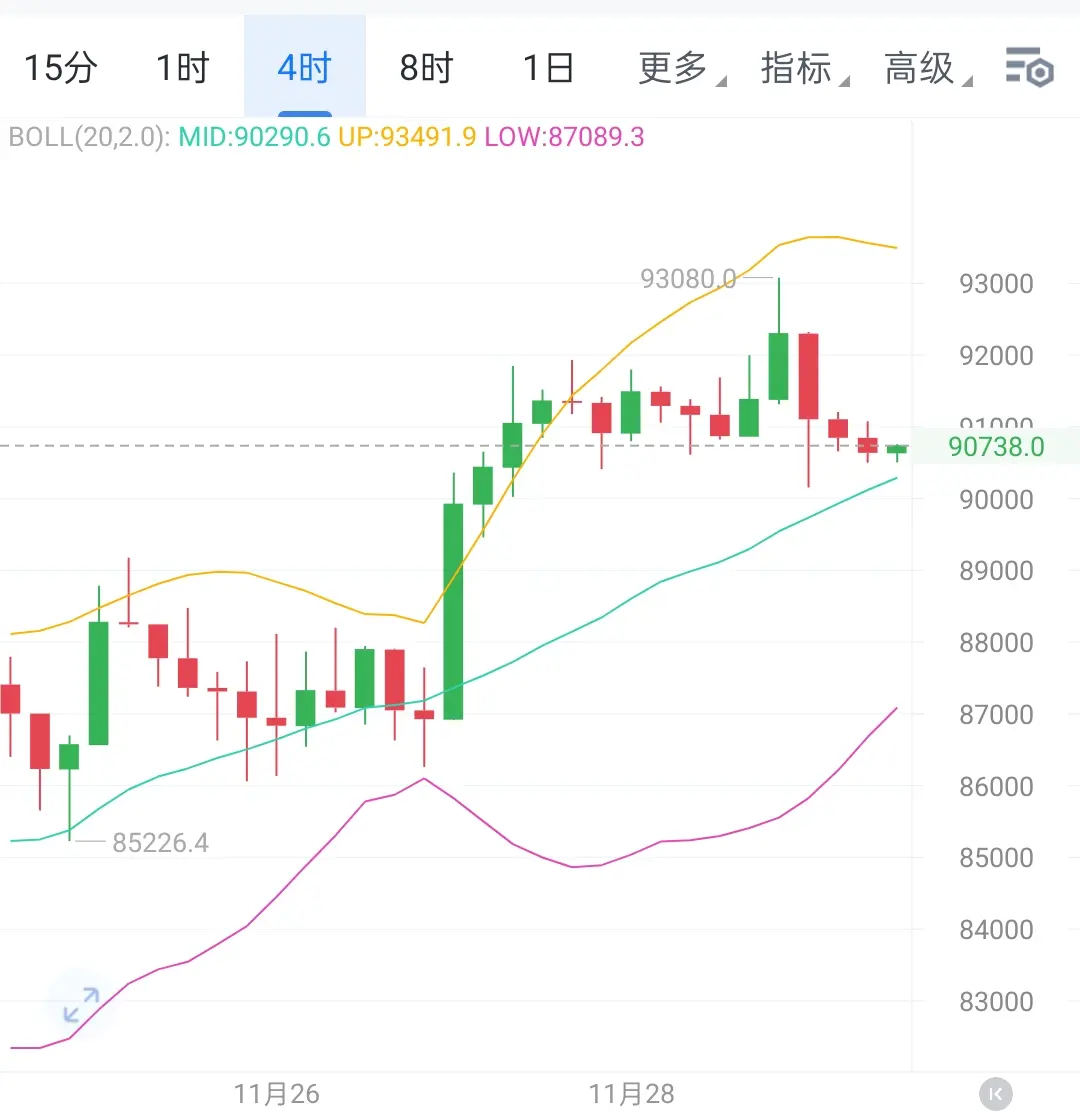
The BTC daily chart and 4-hour chart are both saying "there will be a rebound"! Everyone can wait for the price to pull back to 90500-91000 to go long, aiming for 92500. If it doesn't break through the previous high, you can also try shorting. Focus closely on the 90000 level; if it breaks down, it may continue to fall, so don't be careless! $BTC #比特币行情观察
BTC0.09%
View Original
post-image
  • Reward
  • Comment
  • Repost
  • Share
  • Pinned