BrotherXin'sPricklyYellow

vip
On-chain Analyst
Crypto Market Researcher
Futures Trading Strategist
The same-named new brother across the internet - Spiky Chives
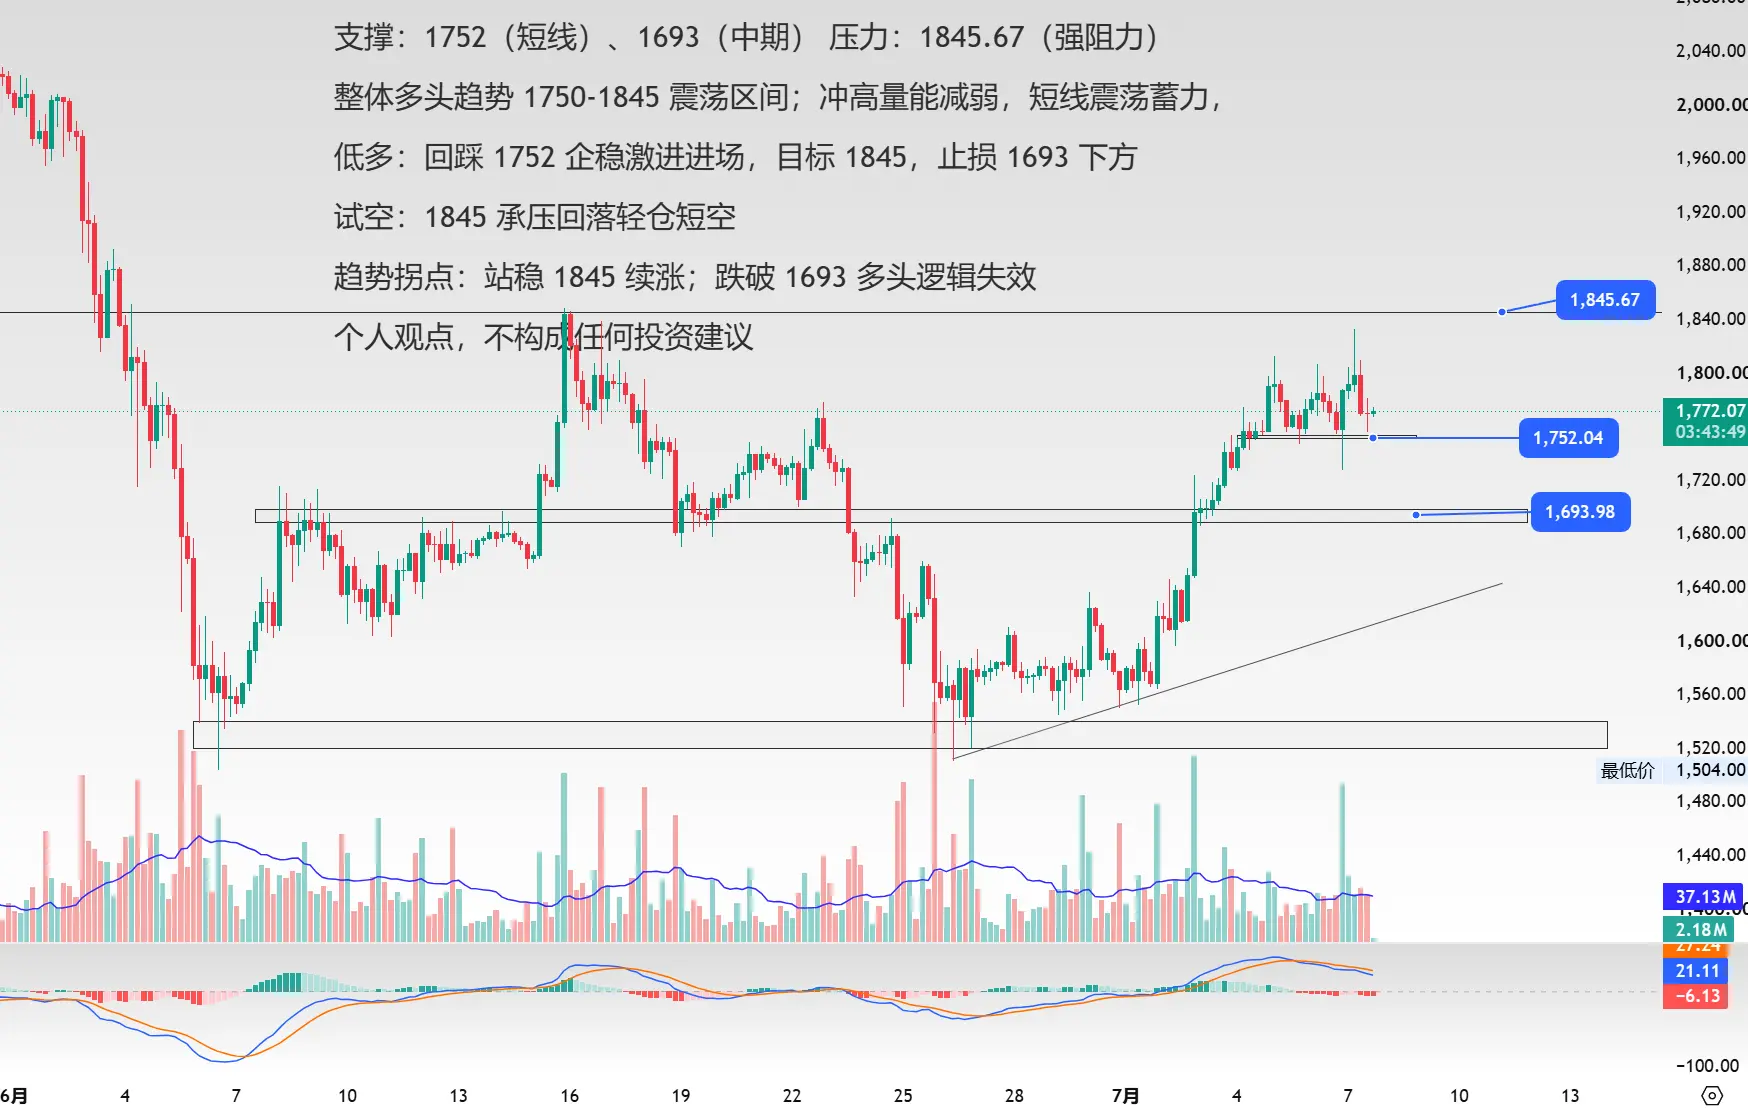
Support: 1752 (short-term), 1693 (medium-term) Resistance: 1845.67 (strong resistance)
Overall bull trend, 1750-1845 consolidation range; upward momentum weakening, short-term consolidation and accumulation,
Long on dips: aggressive entry on stabilization at 1752 pullback, target 1845, stop loss below 1693
Short test: light short on rejection at 1845
Trend inflection: hold above 1845 for continuation; break below 1693 invalidates bullish thesis
Personal opinion, does not constitute any investment advice
View Original
post-image
  • Reward
  • Comment
  • Repost
  • Share
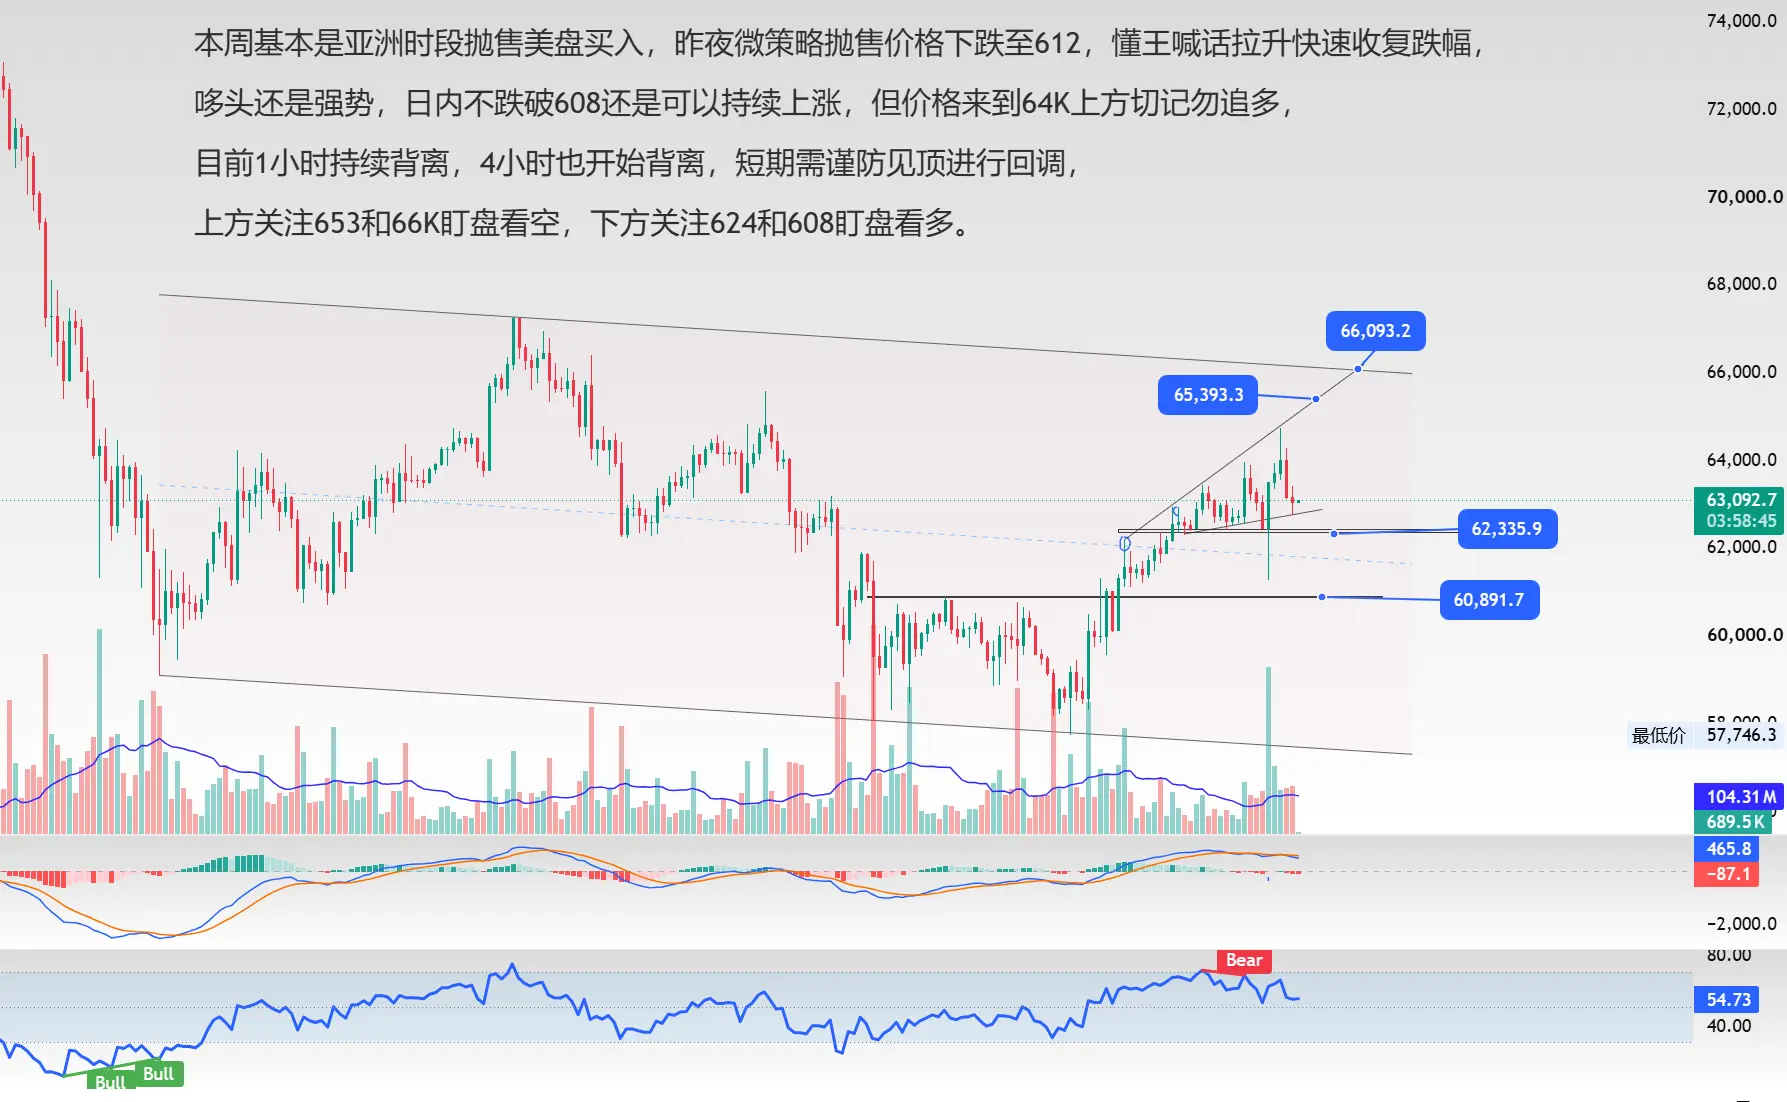
This week is basically mass selling during the Asian session and buying during the US session. Last night, MicroStrategy sold; the price fell to 612. Then Trump hyped it up—pushing it higher and quickly recovering the drop,

The whales are still strong. As long as the price does not break below 608 during the day, it can continue rising. But once the price comes above 64K, remember: do not chase longs,

Currently, there is continuous divergence on the 1-hour chart, and divergence has also started on the 4-hour chart. In the short term, be cautious of a potential top forming and a pullback,
BTC0.57%
View Original
post-image
  • Reward
  • Comment
  • Repost
  • Share
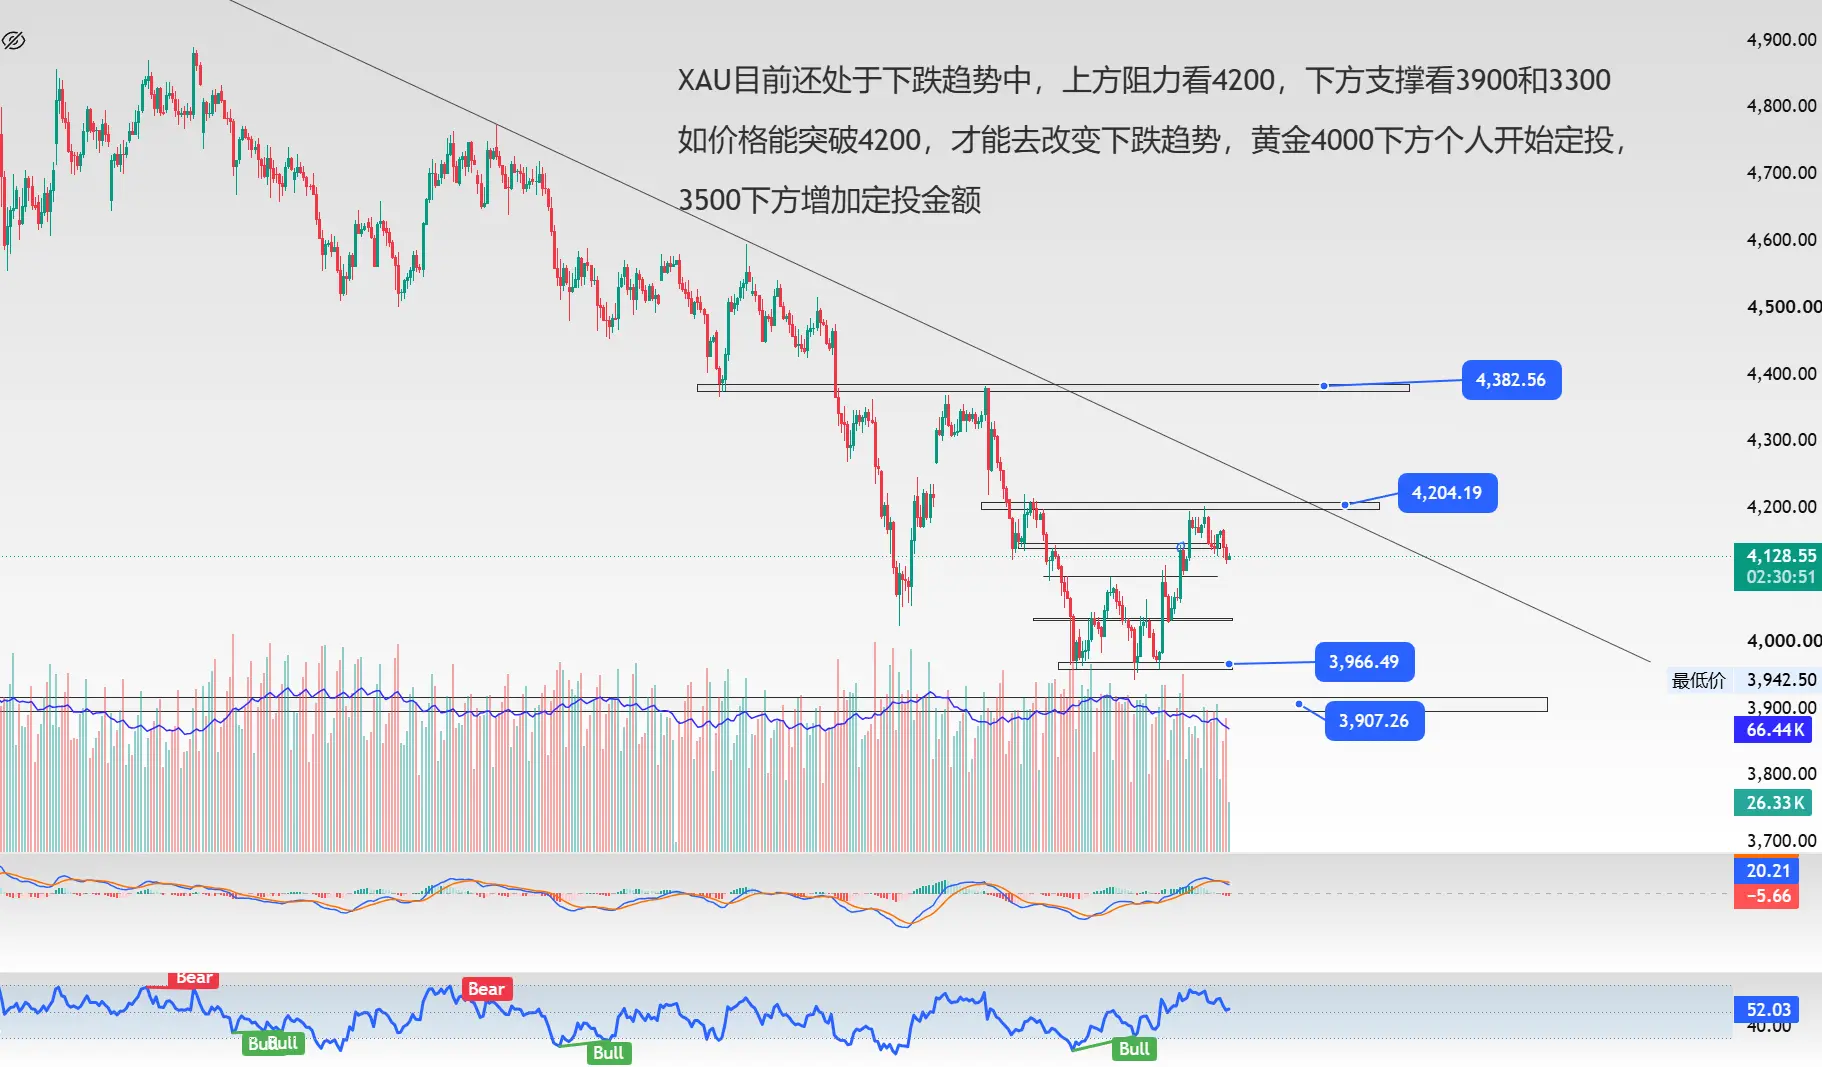
XAU is currently in a downtrend, with resistance above at 4200 and support below at 3900 and 3300
If the price can break through 4200, it can change the downtrend. For gold below 4000, I will start dollar-cost averaging,
Below 3500, increase the dollar-cost averaging amount $XAUT
XAUT-0.40%
View Original
post-image
  • Reward
  • 1
  • Repost
  • Share
Aminusalihu95:
not bad. let's see what this entails by the weekend. everything is possible, everything will happen
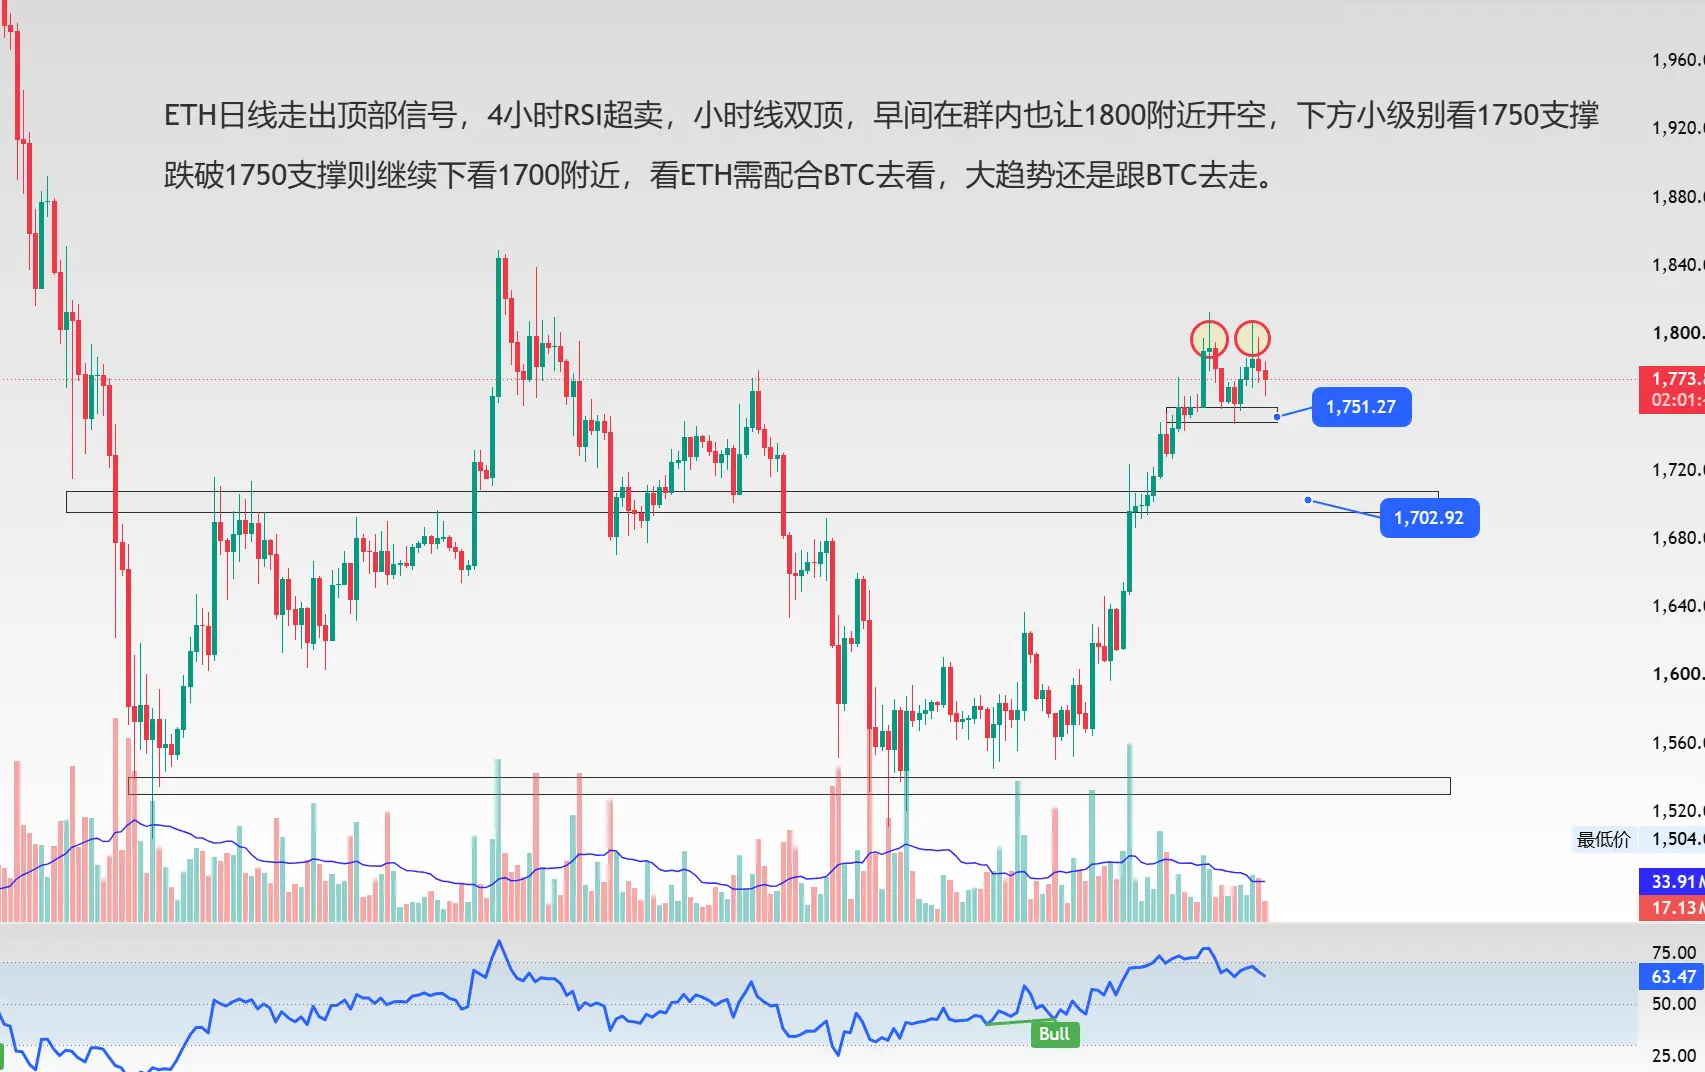
ETH daily chart shows a top signal, 4-hour RSI oversold, hourly double top, and early this morning in the group, we also recommended shorting around 1800, with the lower smaller timeframe looking at 1750 support.
If 1750 support is broken, then continue looking at 1700 area. Watching ETH requires coordinating with BTC, as the overall trend still follows BTC.
ETH0.40%
BTC0.52%
View Original
post-image
  • Reward
  • Comment
  • Repost
  • Share
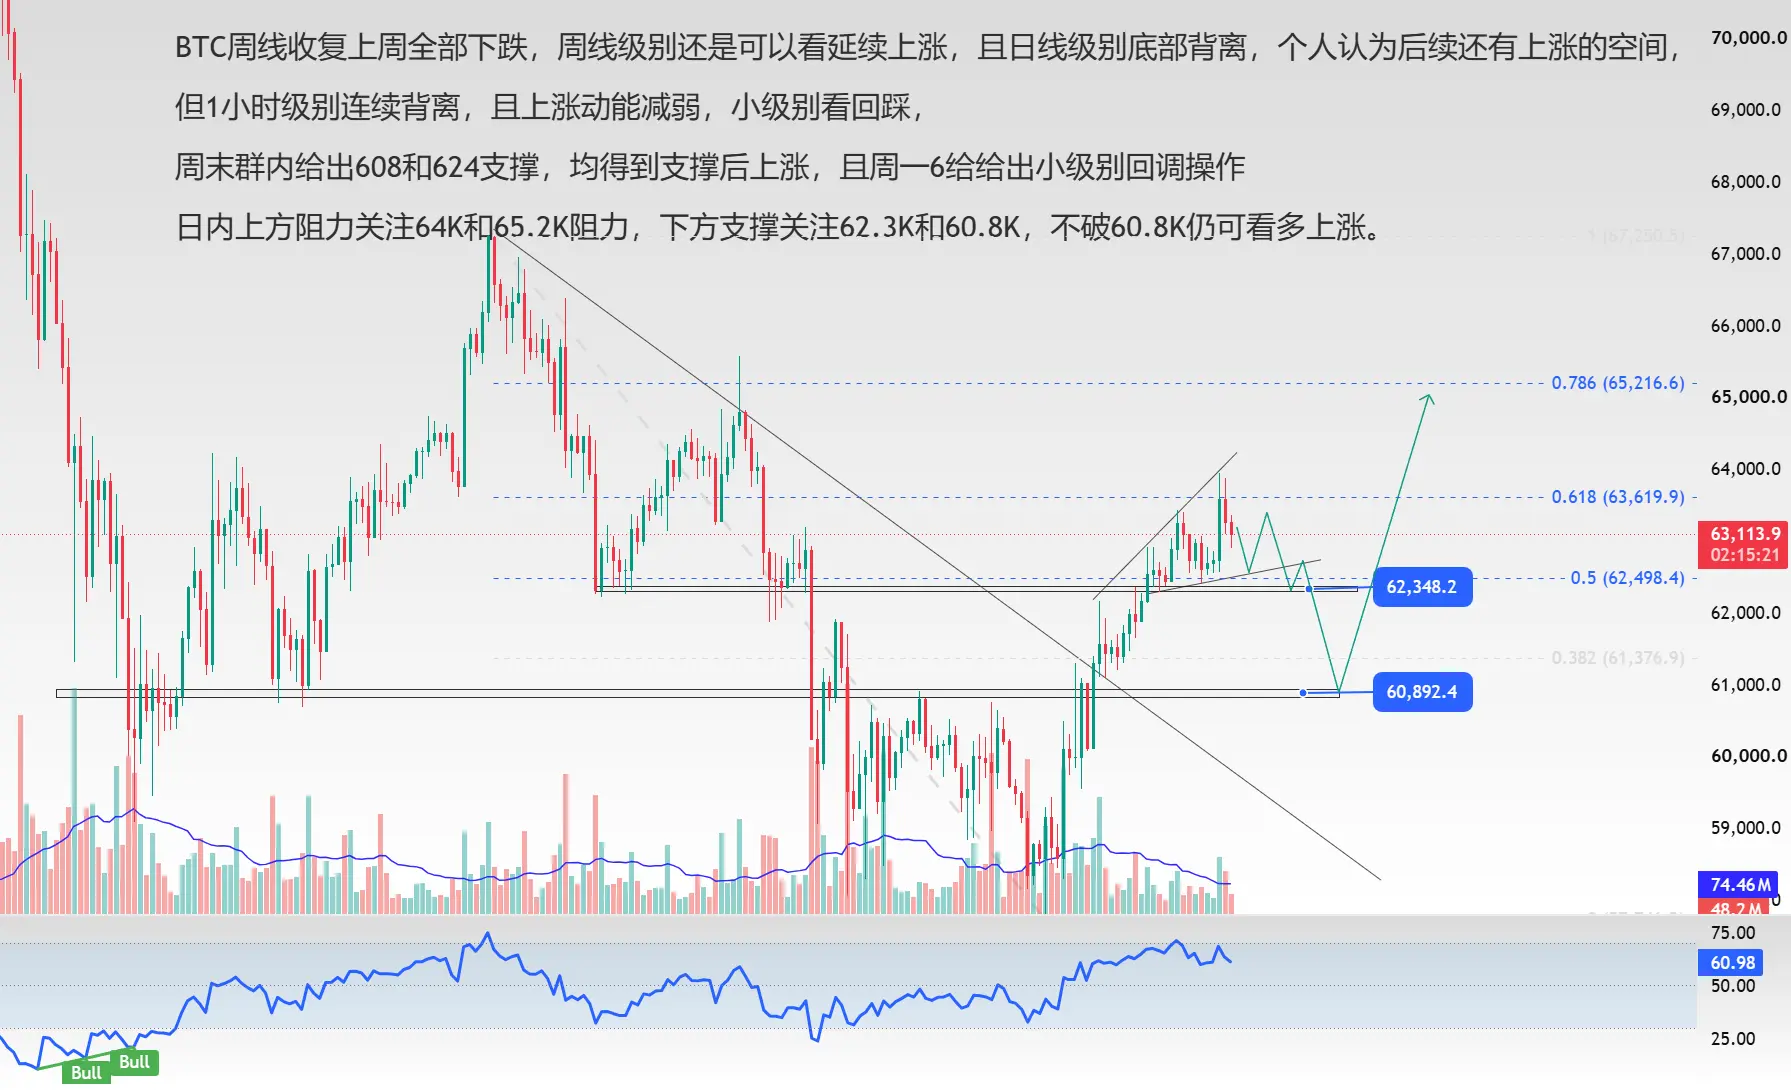
BTC weekly has recovered all of last week's decline. From a weekly perspective, it still looks like a continuation of the uptrend, and the daily level shows a bullish divergence. Personally, I think there is still room for upside.
However, the 1-hour level shows continuous divergence, and the upward momentum is weakening. On the smaller timeframe, a pullback is expected.
Over the weekend, support levels at 608 and 624 were given in the group, both held and led to an uptick. On Monday, a small-level pullback trade was given.
For today, the intraday resistance levels to watch are 64K and 65.2K,
BTC0.57%
View Original
post-image
  • Reward
  • Comment
  • Repost
  • Share
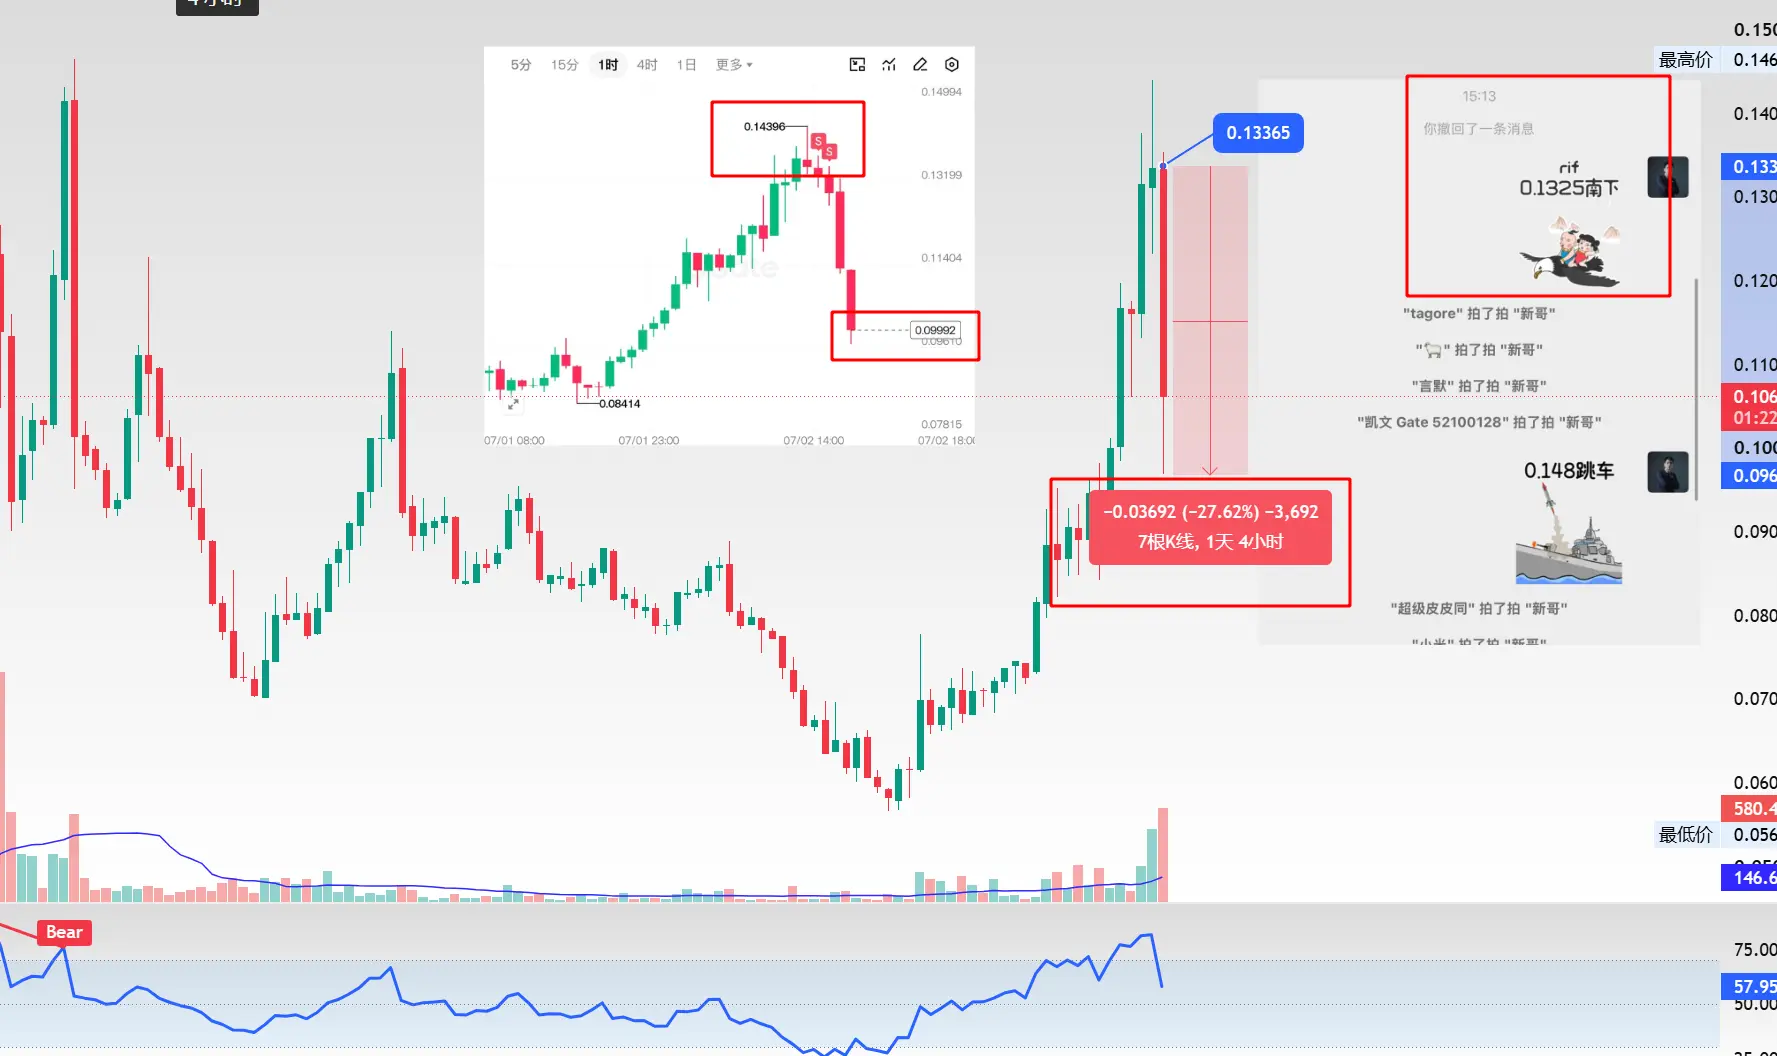
rtf going south 28% please call me the counterfeit prince$BTC
BTC0.57%
View Original
post-image
  • Reward
  • Comment
  • Repost
  • Share
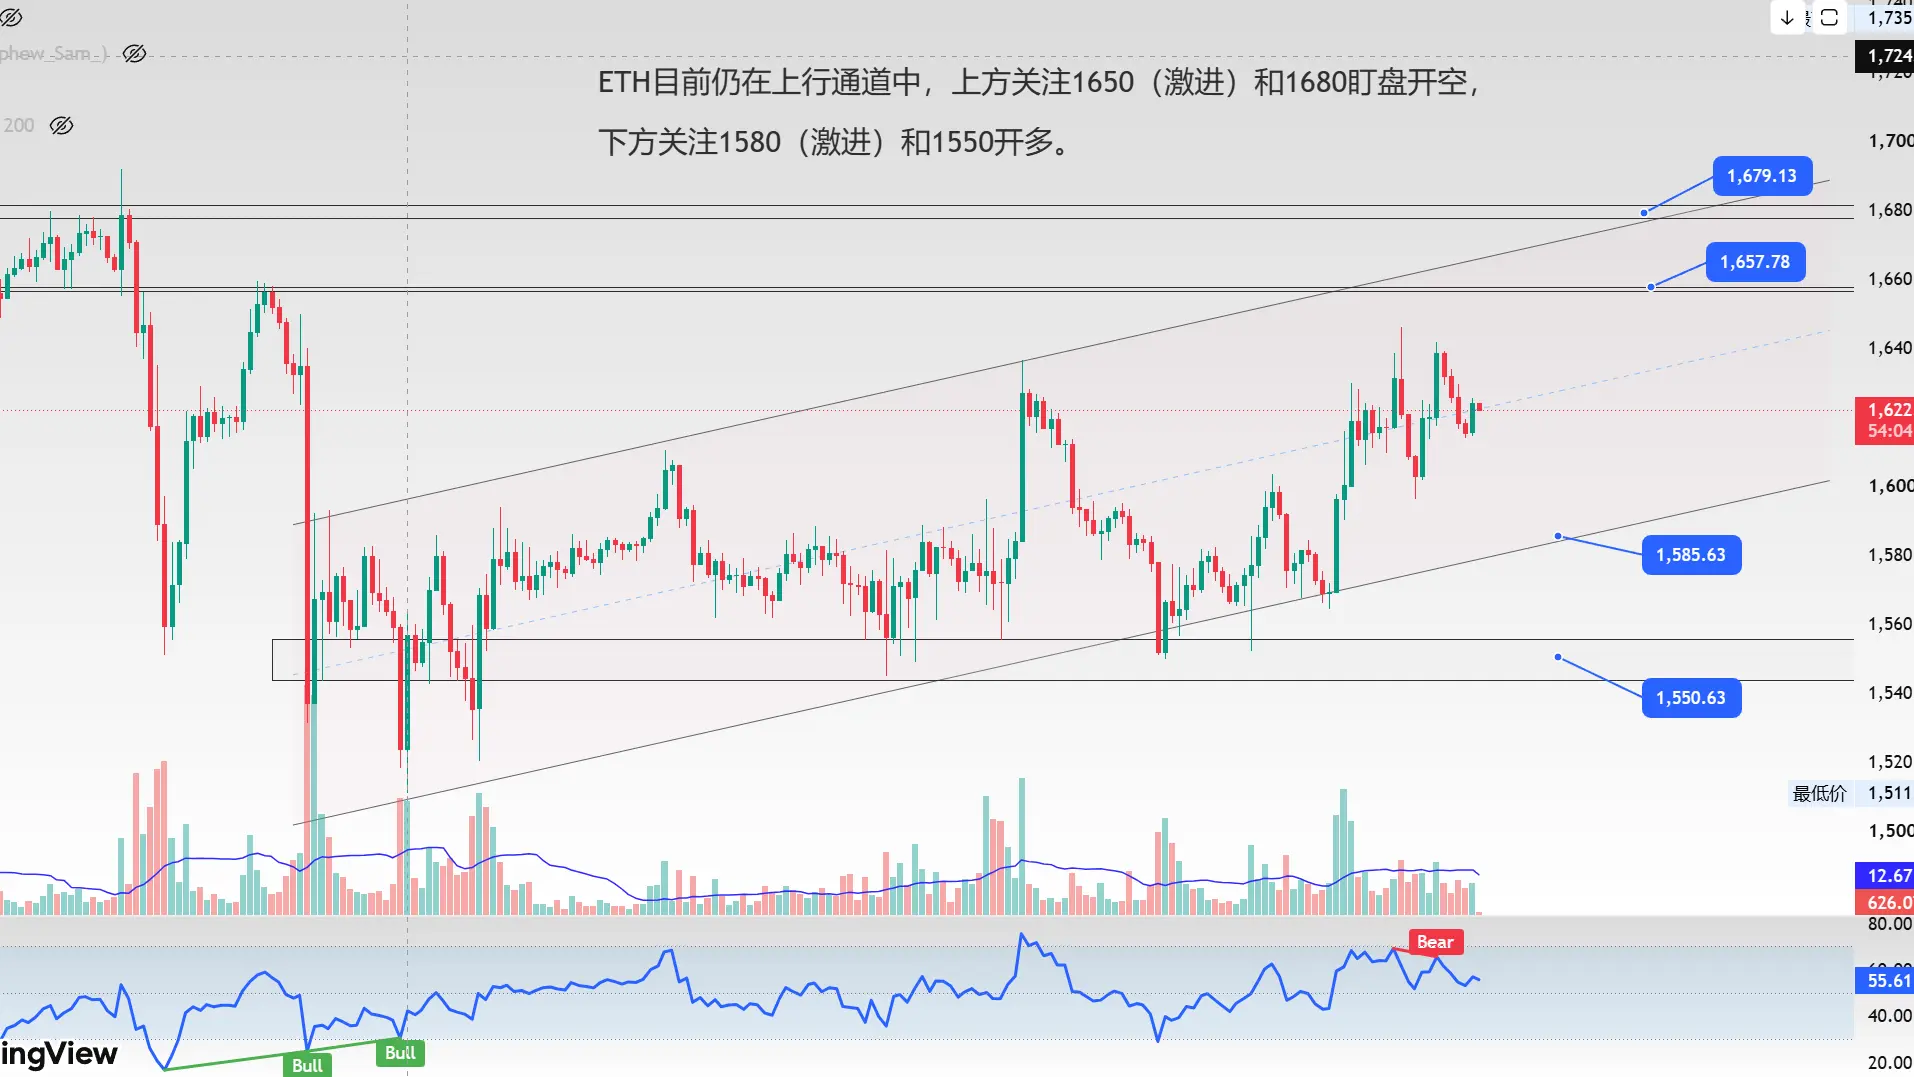
ETH is still in an upward channel, with attention above on shorting at 1650 (aggressive) and 1680 while monitoring the market.
Attention below on going long at 1580 (aggressive) and 1550. $ETH
ETH0.45%
View Original
post-image
  • Reward
  • Comment
  • Repost
  • Share
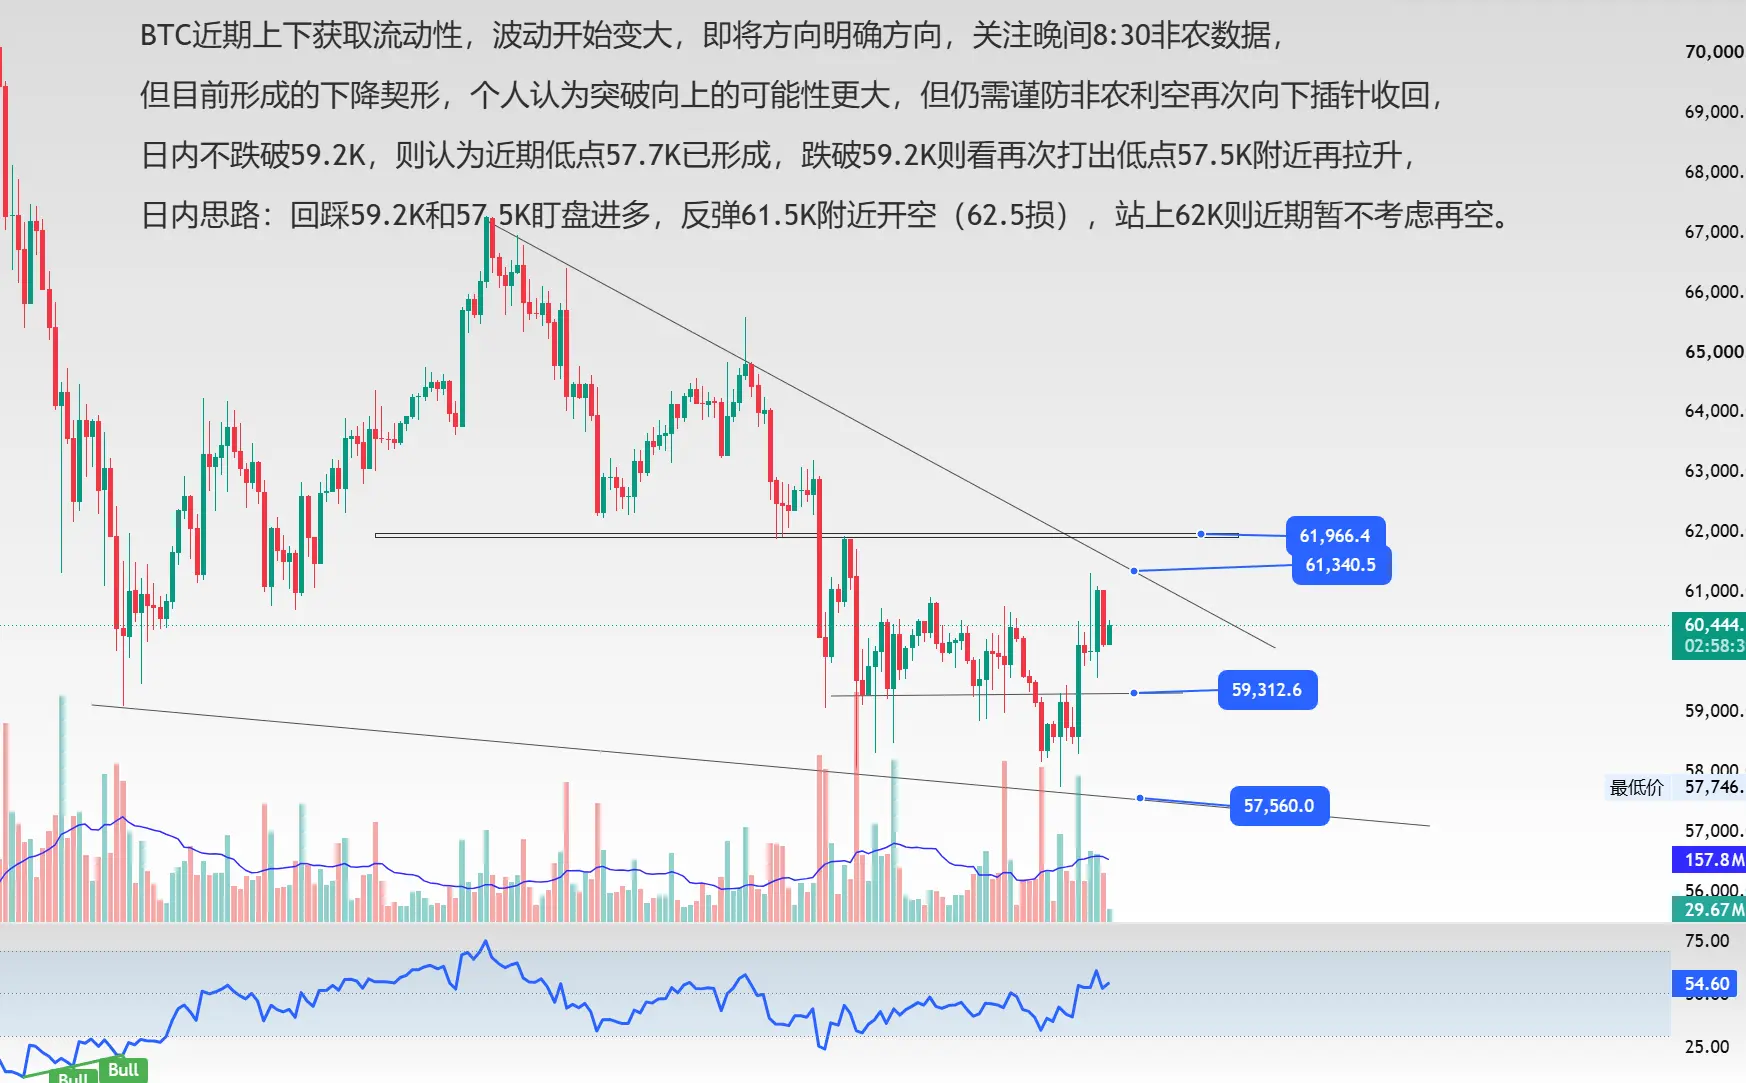
BTC has been capturing liquidity up and down recently, volatility is starting to increase, and a clear direction is imminent. Pay attention to the 8:30 PM non-farm payroll data,
However, regarding the descending wedge pattern currently forming, I personally believe the probability of an upward breakout is higher, but we still need to be wary of the non-farm data being bearish, causing another downward spike that recovers,
If the intraday price does not break below 59.2K, then the recent low of 57.7K is considered established. If it breaks below 59.2K, expect another low around 57.5K before a r
BTC0.57%
View Original
post-image
  • Reward
  • Comment
  • Repost
  • Share
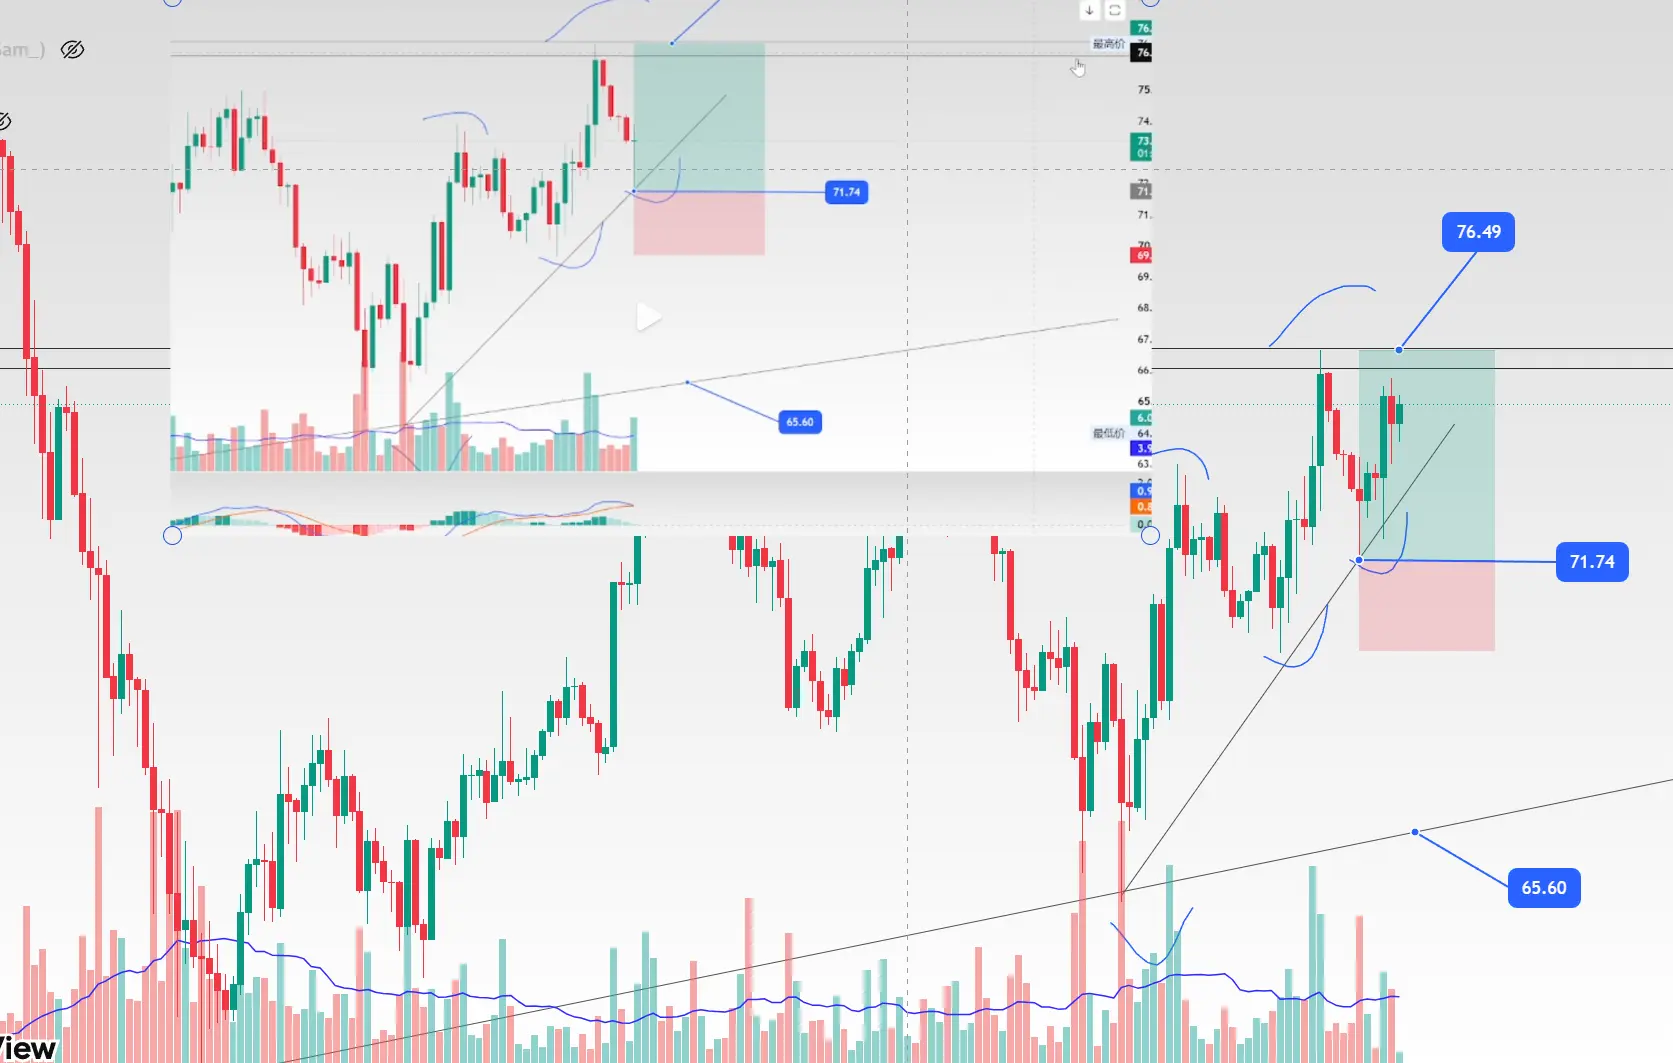
Yesterday, 71 SOL moved north, and it’s currently up 5%. Have any buddies seen it? ​​
View Original
post-image
  • Reward
  • Comment
  • Repost
  • Share
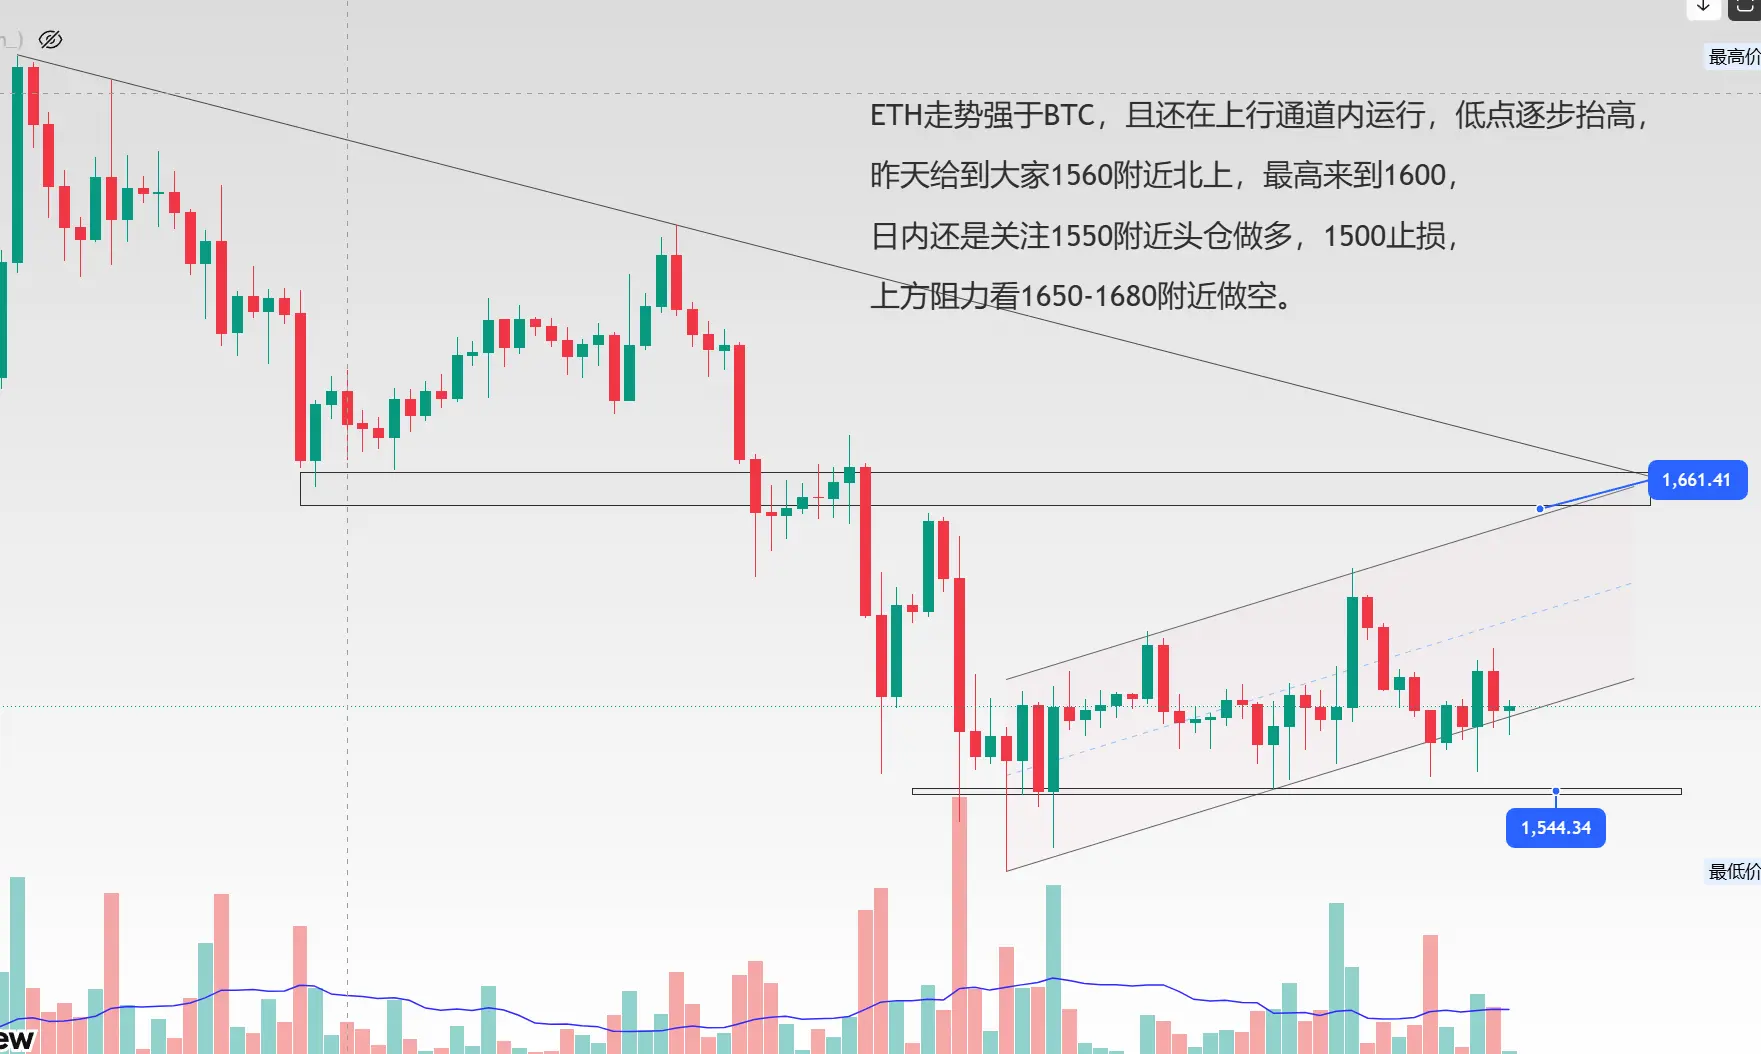
ETH is stronger than BTC, and is still running within an uptrend channel, with lows gradually rising.
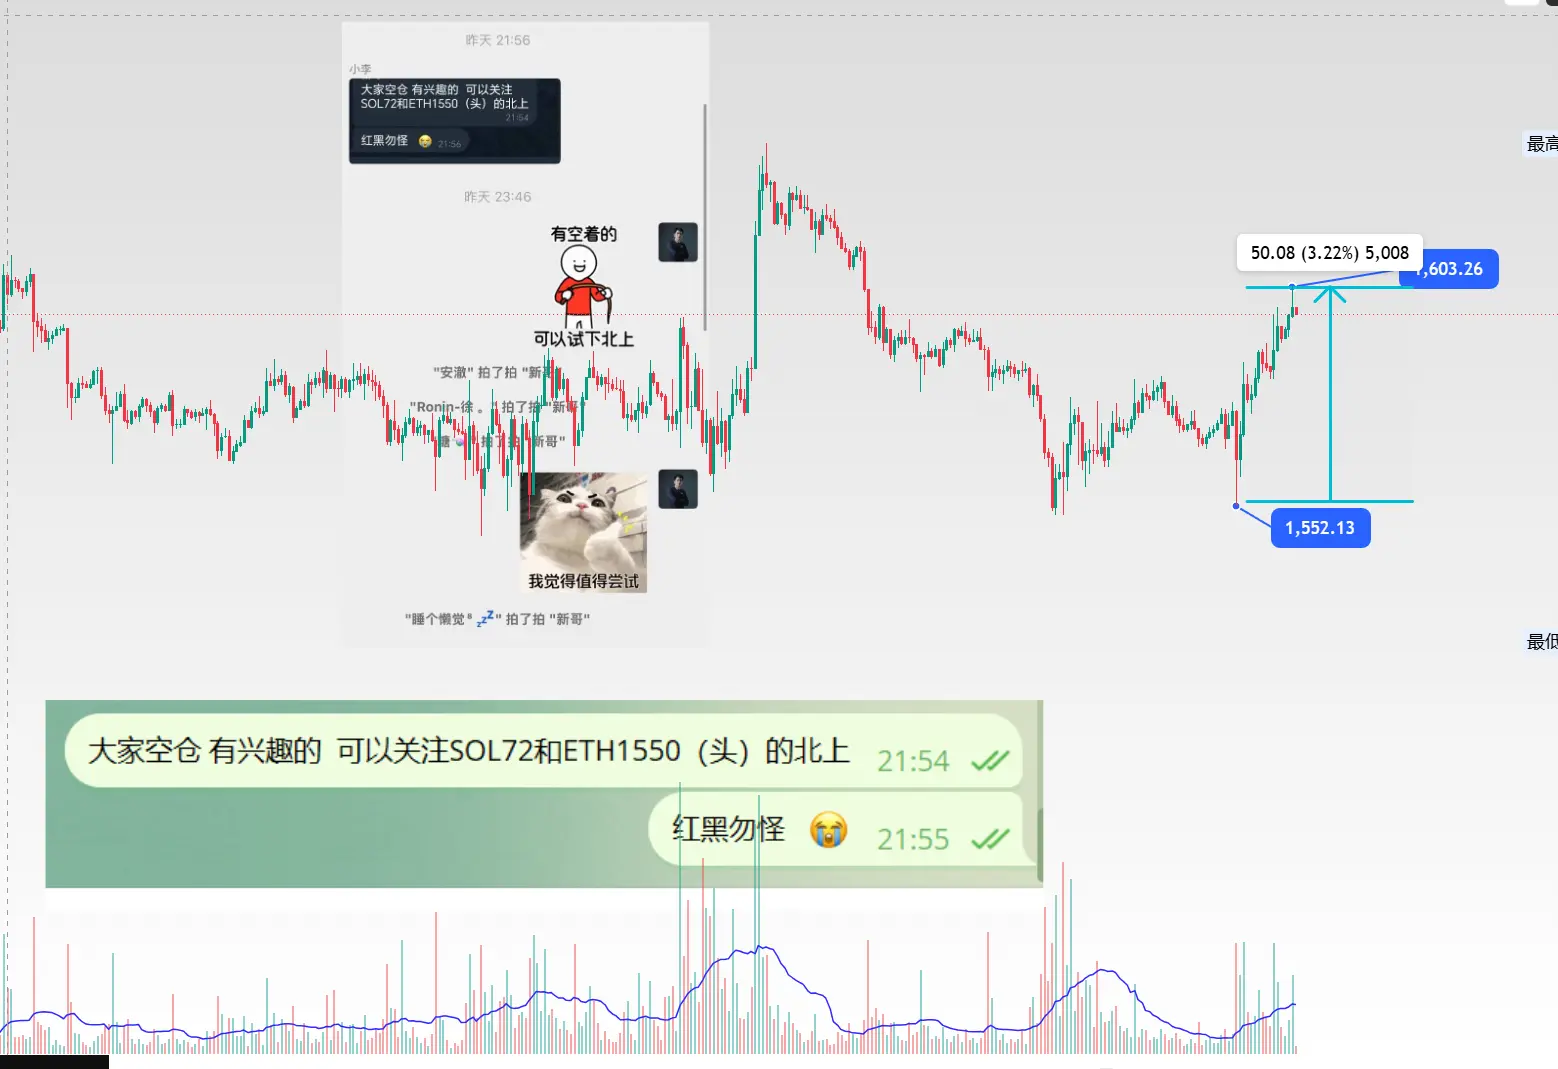
Yesterday, I suggested going long around 1560, and it peaked at 1600.
Today, still focus on entering a long position near 1550 as the first leg, with a stop loss at 1500.
Resistance above is around 1650-1680, where I would go short.
ETH0.40%
BTC0.52%
View Original
post-image
  • Reward
  • Comment
  • Repost
  • Share
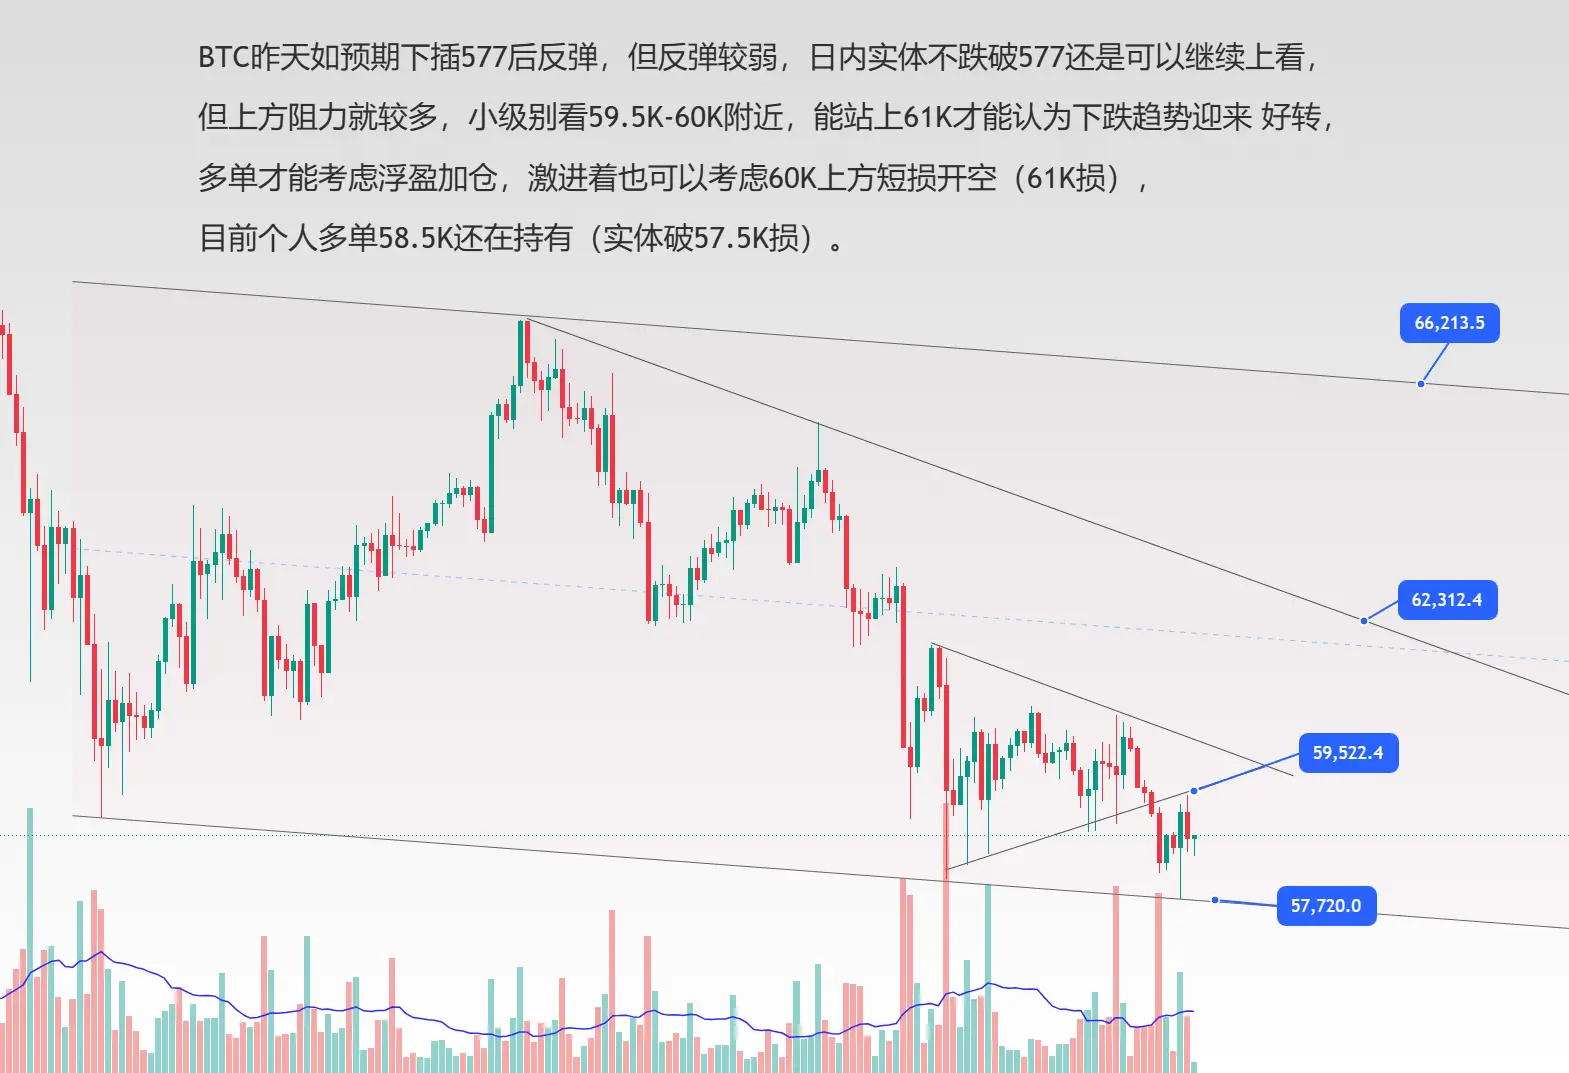
BTC dipped to 577 as expected yesterday and then rebounded, but the rebound was weak. As long as the daily candlestick body does not break below 577, we can still look upward,
However, there are many resistances above. On the smaller timeframe, look near 59.5K-60K. Only if it can hold above 61K can we consider the downtrend improving,
Only then can long positions consider adding to profitable positions. Aggressive traders can also consider opening shorts above 60K with a tight stop loss (stop loss at 61K),
Currently, I am still holding my long position at 58.5K (stop loss if the candlestick bo
BTC0.57%
View Original
post-image
  • Reward
  • Comment
  • Repost
  • Share
The second child is also at 3%, much better than the first child.
View Original
post-image
  • Reward
  • Comment
  • Repost
  • Share
Guys, first go to 577 to take out the liquidity below and quickly recover it. How many people can actually see the 577 point? ​​​$BTC
BTC0.57%
View Original
post-image
  • Reward
  • Comment
  • Repost
  • Share
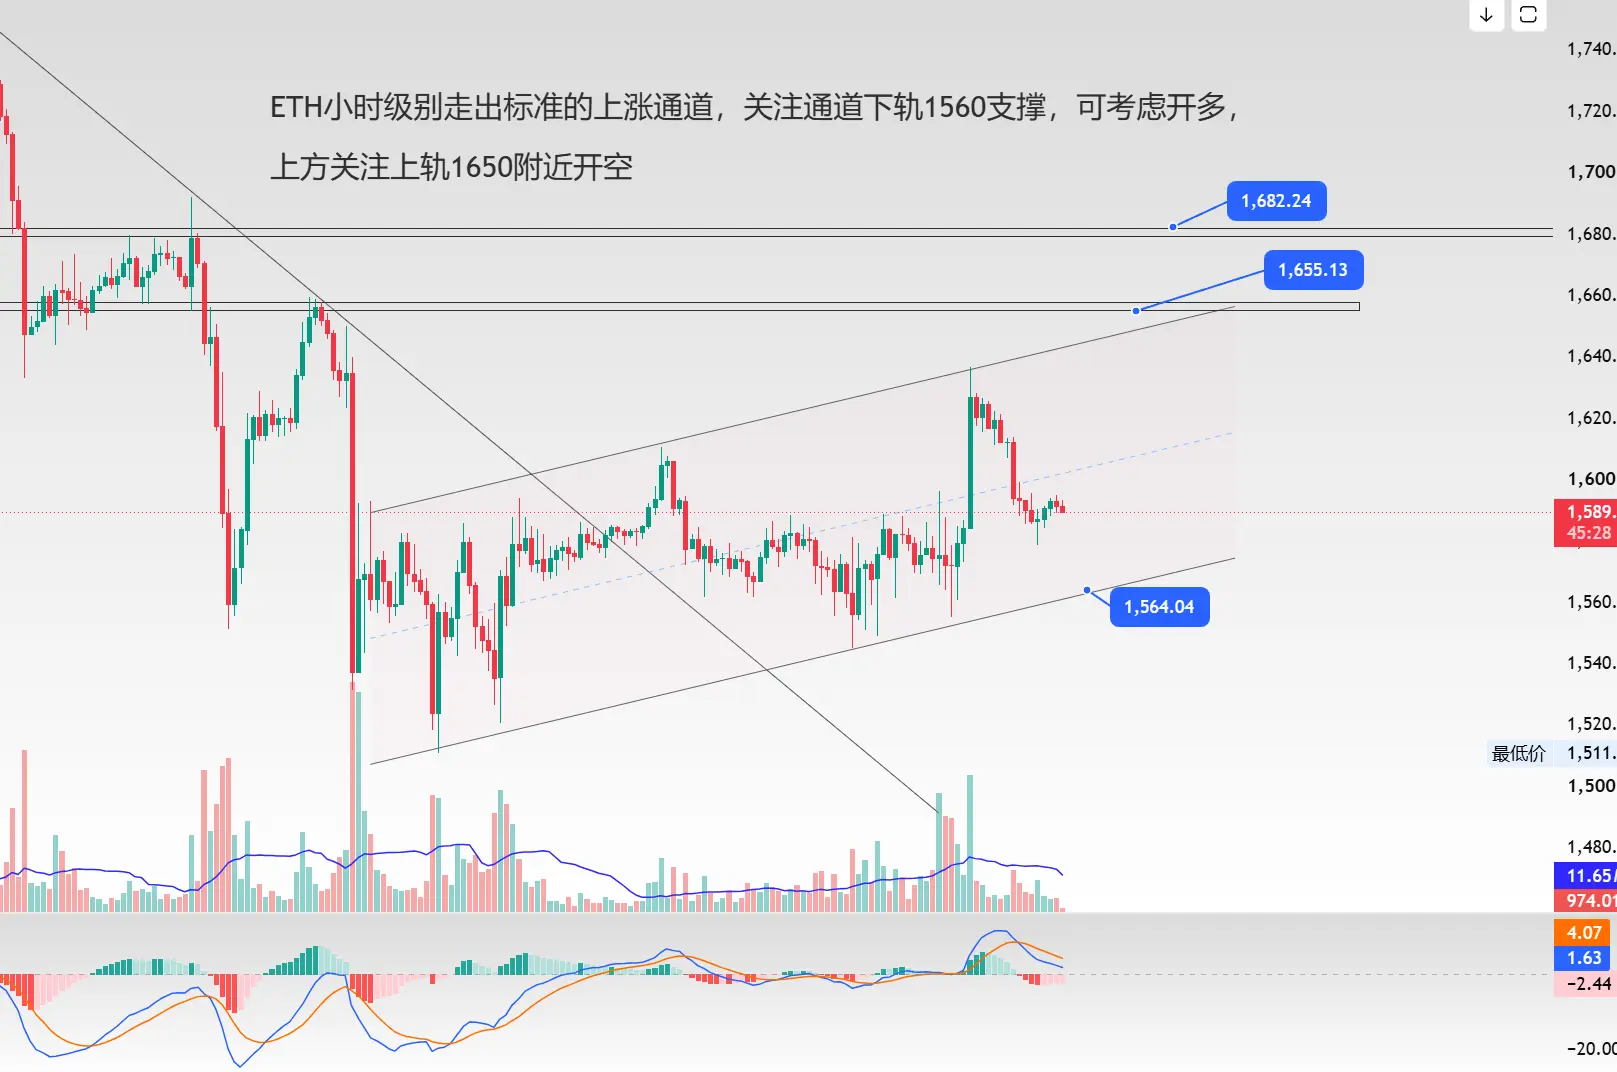
ETH hourly level has formed a standard upward channel. Focus on the lower rail support at 1560, consider going long,
Above, focus on the upper rail near 1650 to go short.
ETH0.45%
View Original
post-image
  • Reward
  • Comment
  • Repost
  • Share
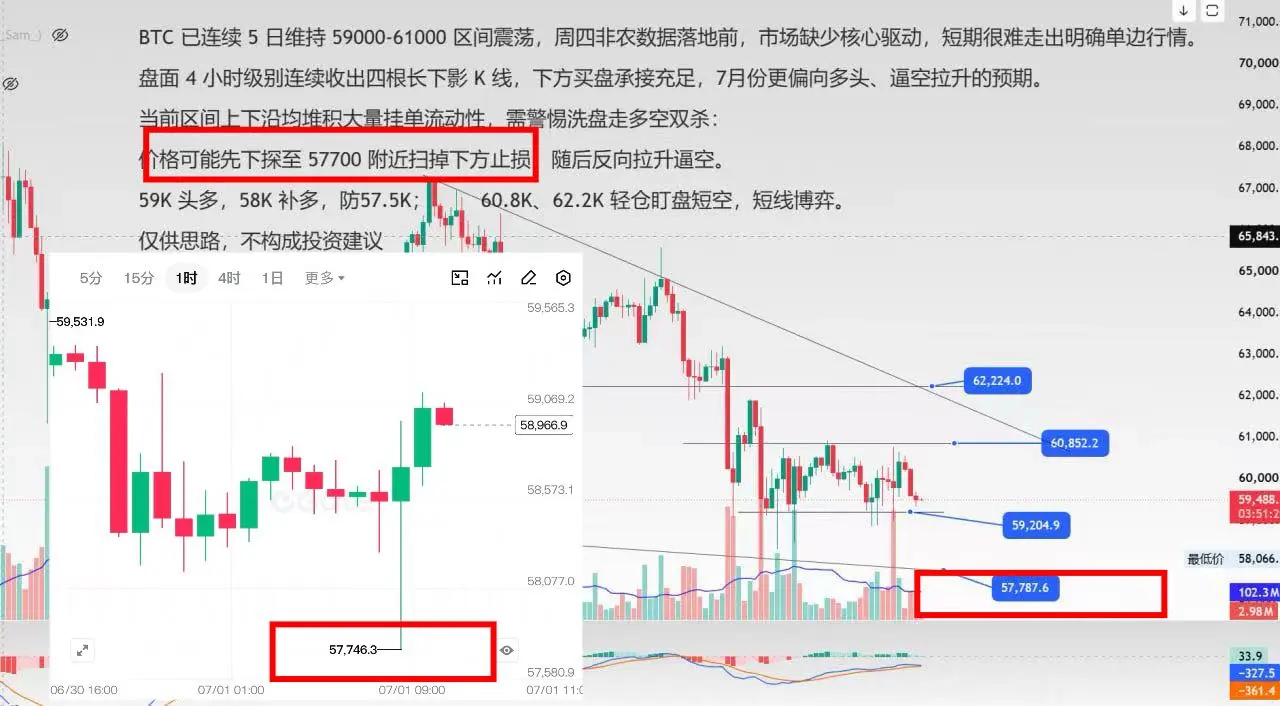
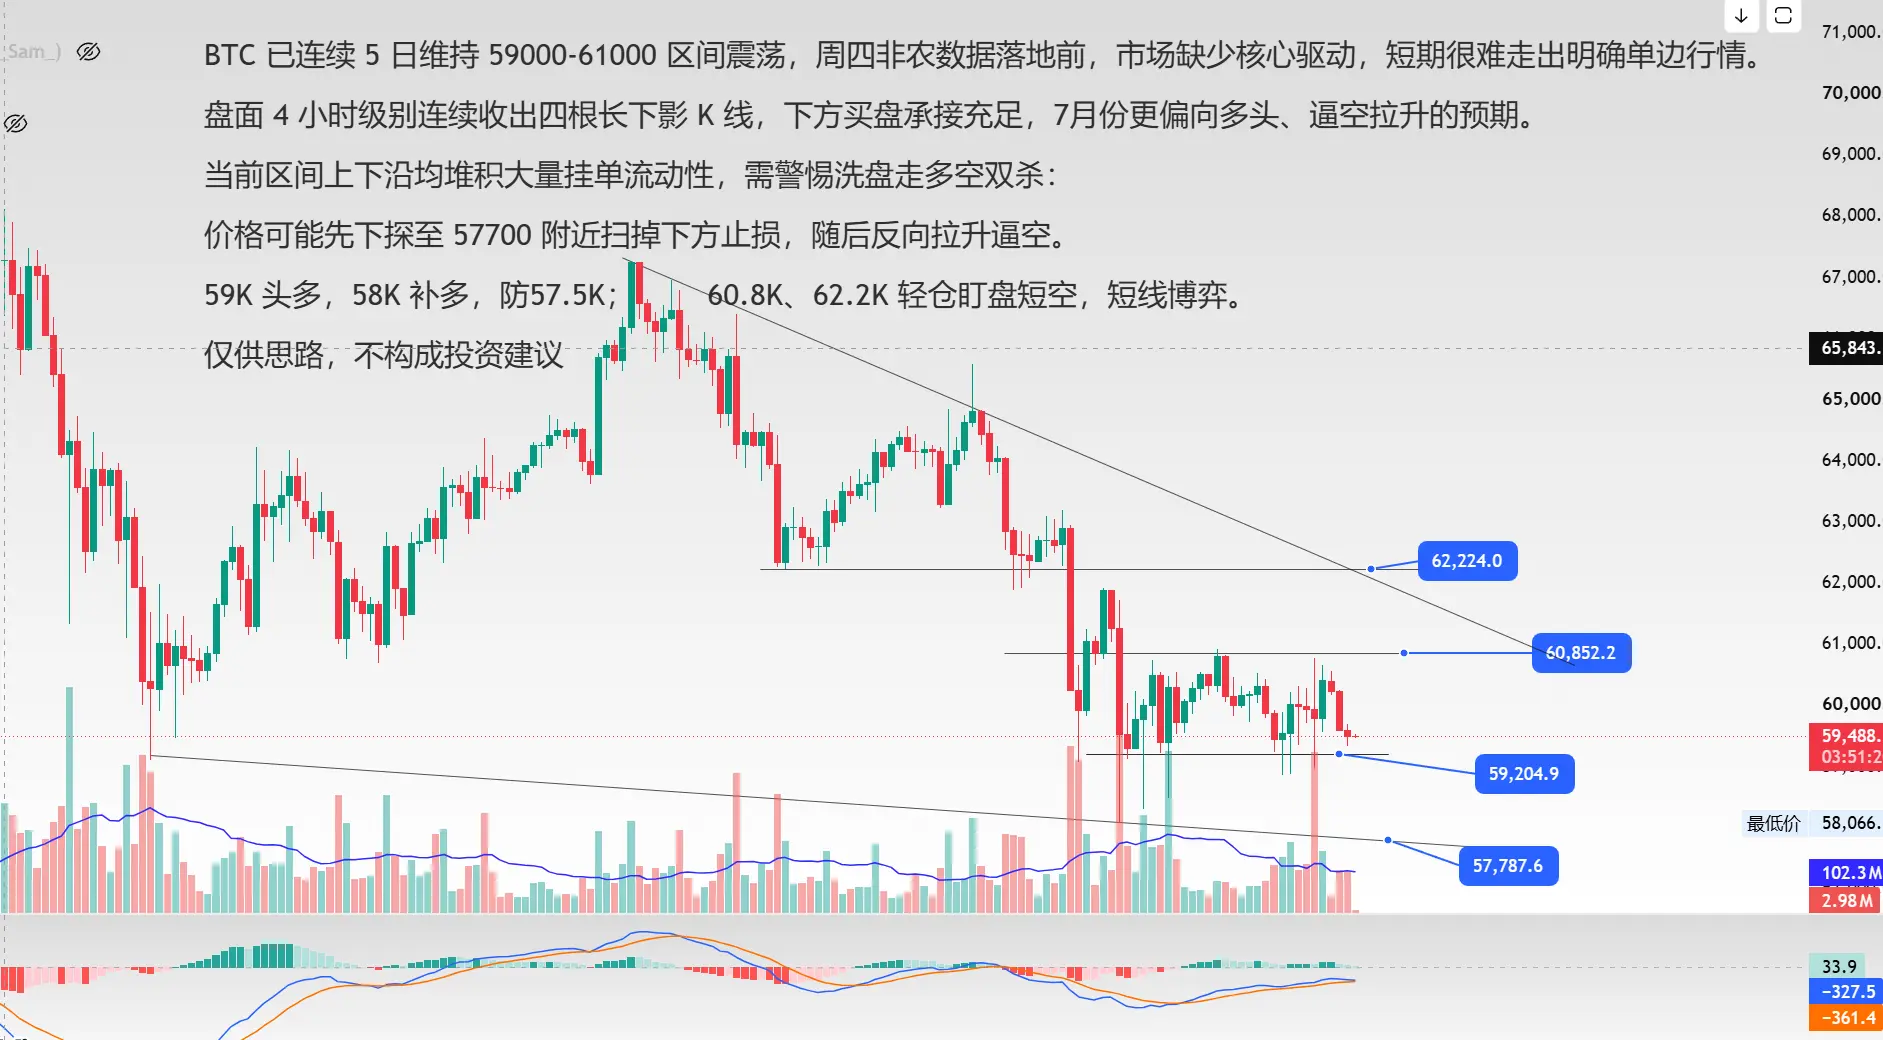
BTC has been oscillating in the 59k-61000 range for 5 consecutive days. Before the Thursday non-farm payroll data release, the market lacks a core catalyst, making it difficult to form a clear unilateral trend in the short term.
On the 4-hour chart, four consecutive long lower shadow candlesticks have formed, indicating sufficient buying support below. The expectation for July is more bullish, leaning towards a squeeze and upward push.
Large amounts of pending order liquidity have accumulated at both the upper and lower bounds of the current range. Beware of a washout that triggers both long a
BTC0.57%
View Original
post-image
  • Reward
  • Comment
  • Repost
  • Share
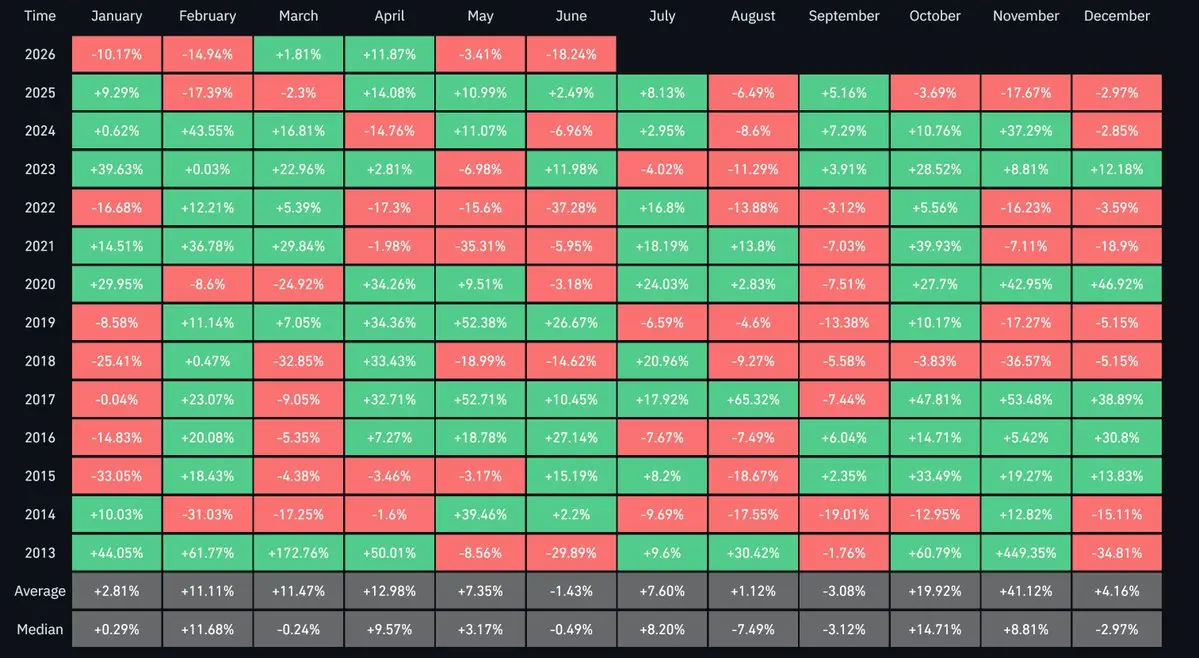
July is coming, and historically July is a sea of green$BTC
BTC0.57%
View Original
post-image
  • Reward
  • Comment
  • Repost
  • Share
How should we view the back-and-forth pin insertion?
283 views
2026-06-29 12:58
  • Reward
  • Comment
  • Repost
  • Share
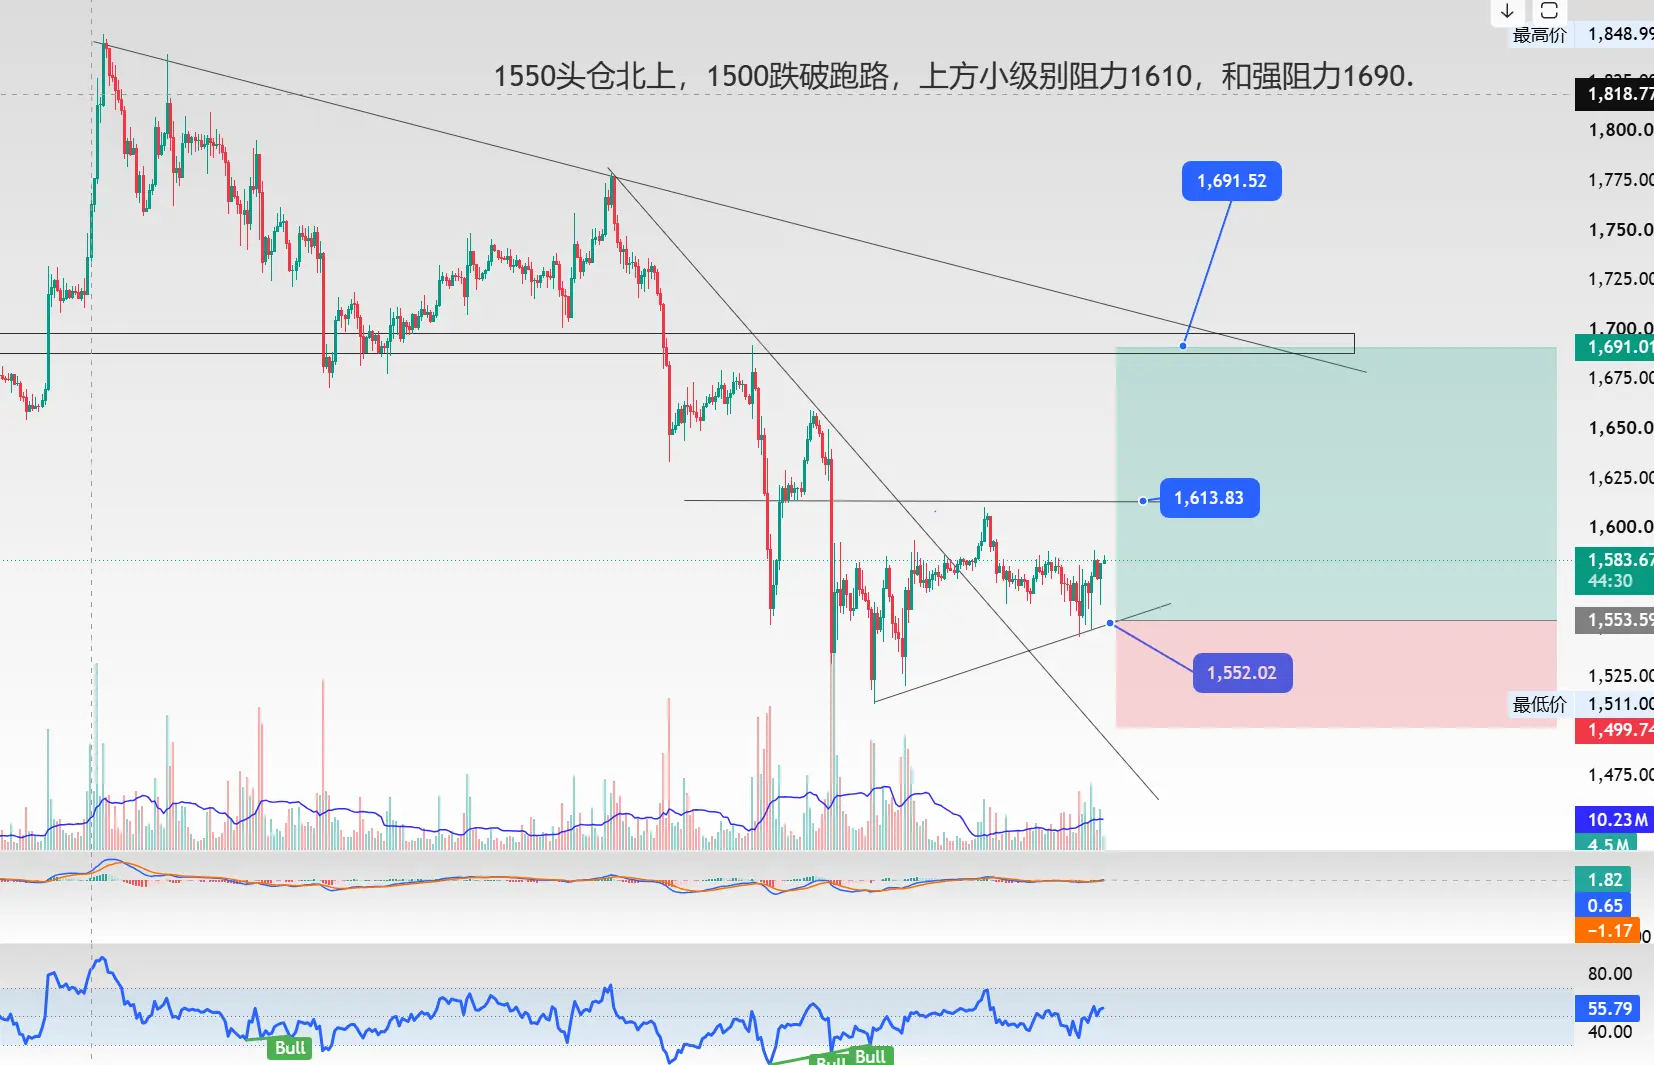
With 1550, positions push upward; when it breaks below 1500, it turns into a sell-off as people exit. Above, there is minor resistance at 1610, and strong resistance at 1690.
View Original
post-image
  • Reward
  • Comment
  • Repost
  • Share
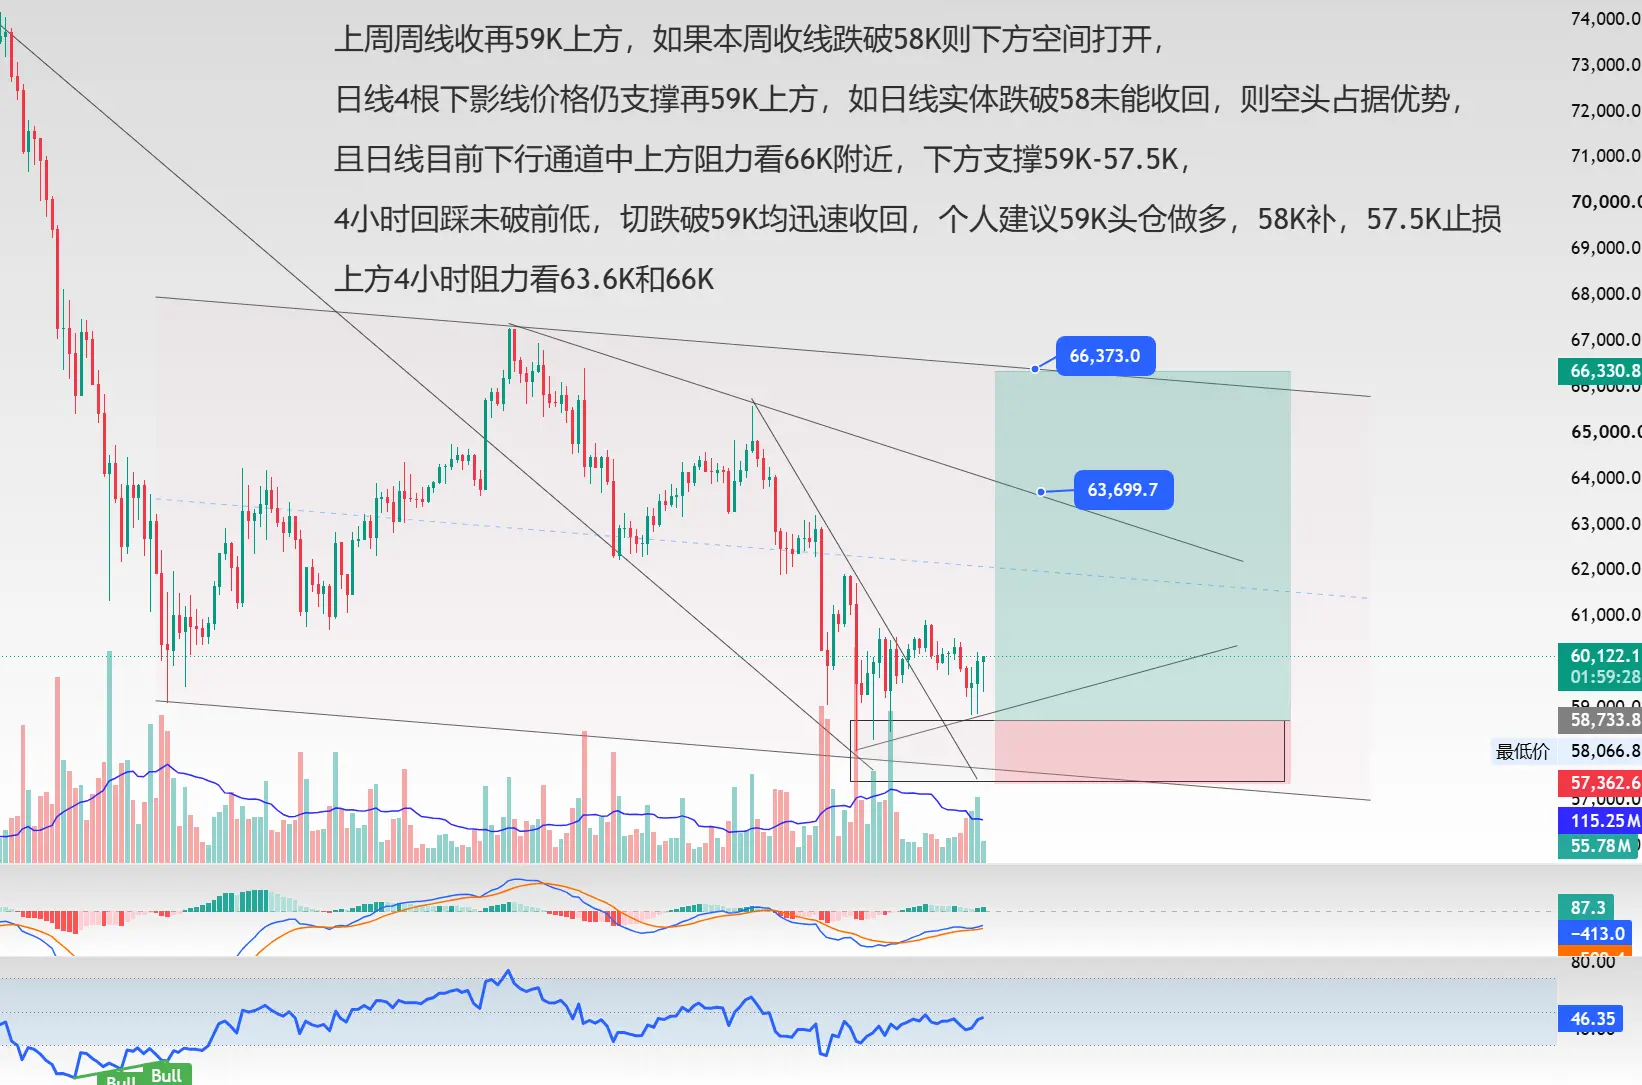
Last week's weekly candle closed above 59K. If this week's candle closes below 58K, the downside space will open.
The daily chart shows four consecutive lower shadows, with price still supported above 59K. If the daily candle body breaks below 58K without recovering, the bears will take the advantage.
Moreover, the daily chart is currently in a downward channel, with resistance near 66K above and support at 59K-57.5K below.
On the 4-hour chart, the price has not broken the previous low during the pullback, and any dip below 59K quickly recovers. Personal suggestion: open a long position at 59K
BTC0.57%
View Original
post-image
  • Reward
  • Comment
  • Repost
  • Share
  • Pinned