BitcoinWindChime

vip
Age 1.3 Year
Peak Tier 0
Here, we provide daily updates on cryptocurrency market analysis and related news. Mainly based on candlestick patterns, support and resistance levels, trend lines, indicator signals, and market sentiment, helping you determine whether the current market is a rebound correction, trend continuation, or a risk of trend reversal. These insights are for educational and discussion purposes only and do not constitute investment advice. If you're interested, feel free to follow me.
#BTC Today's Market Update
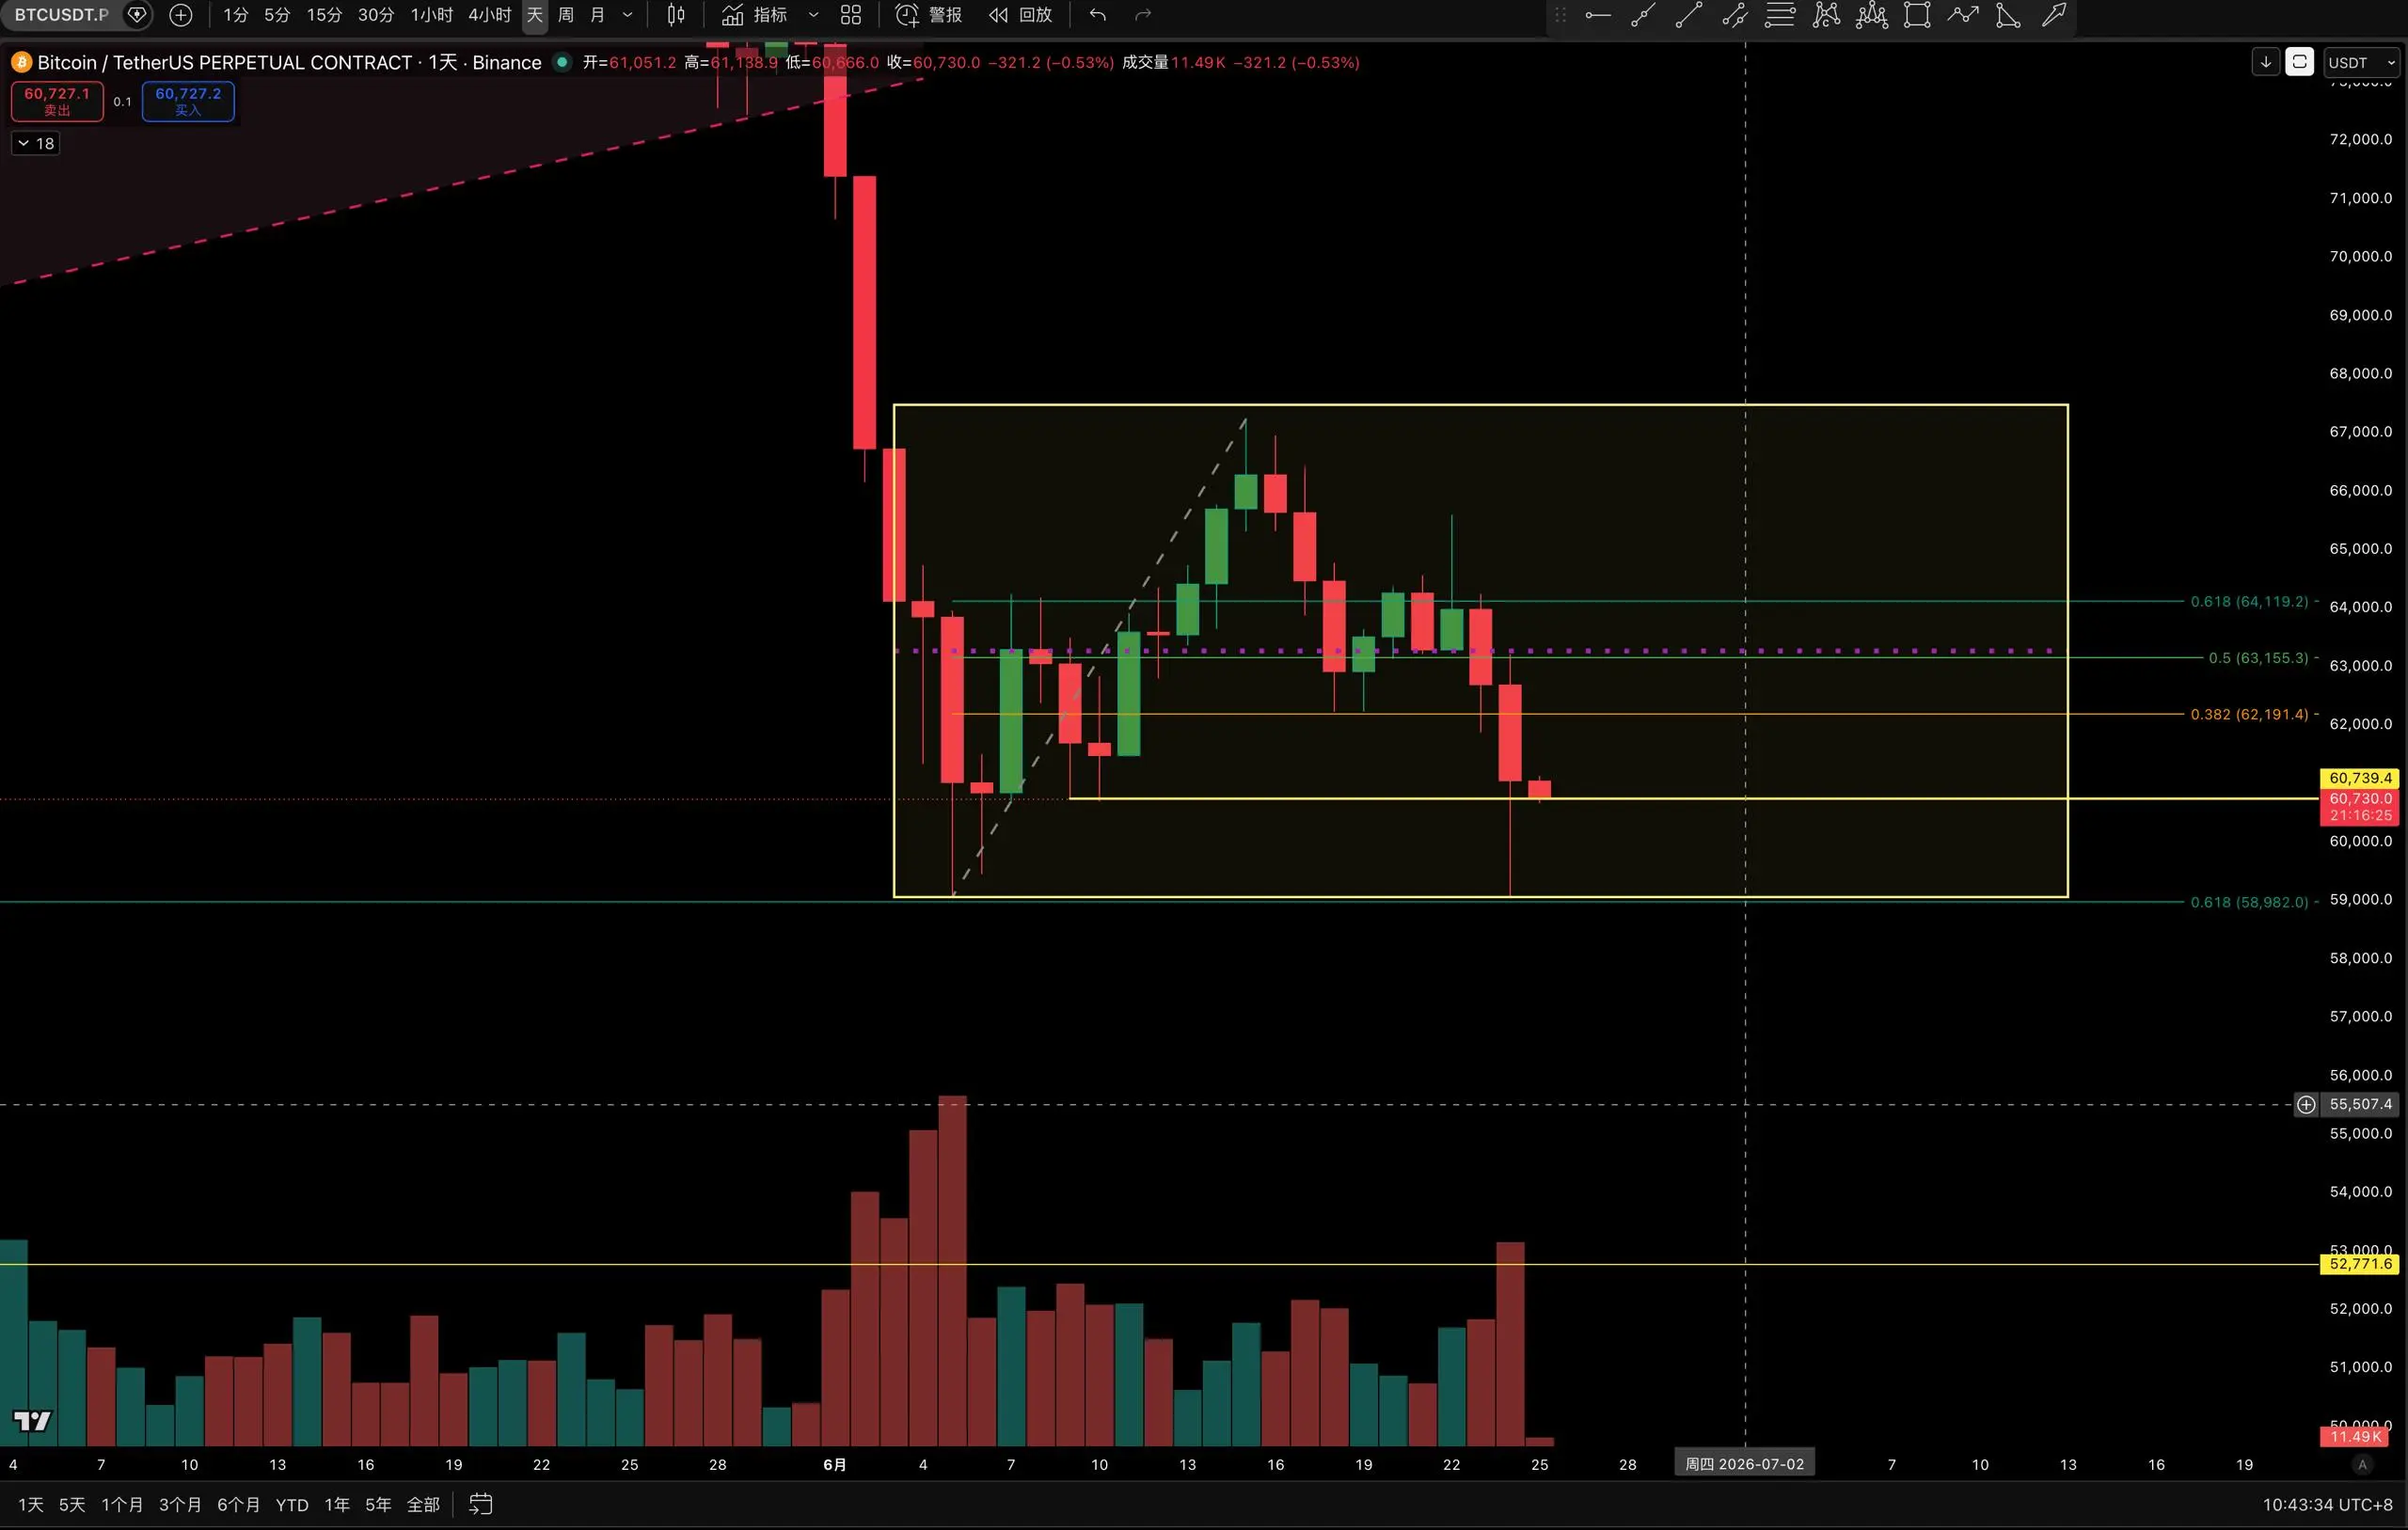
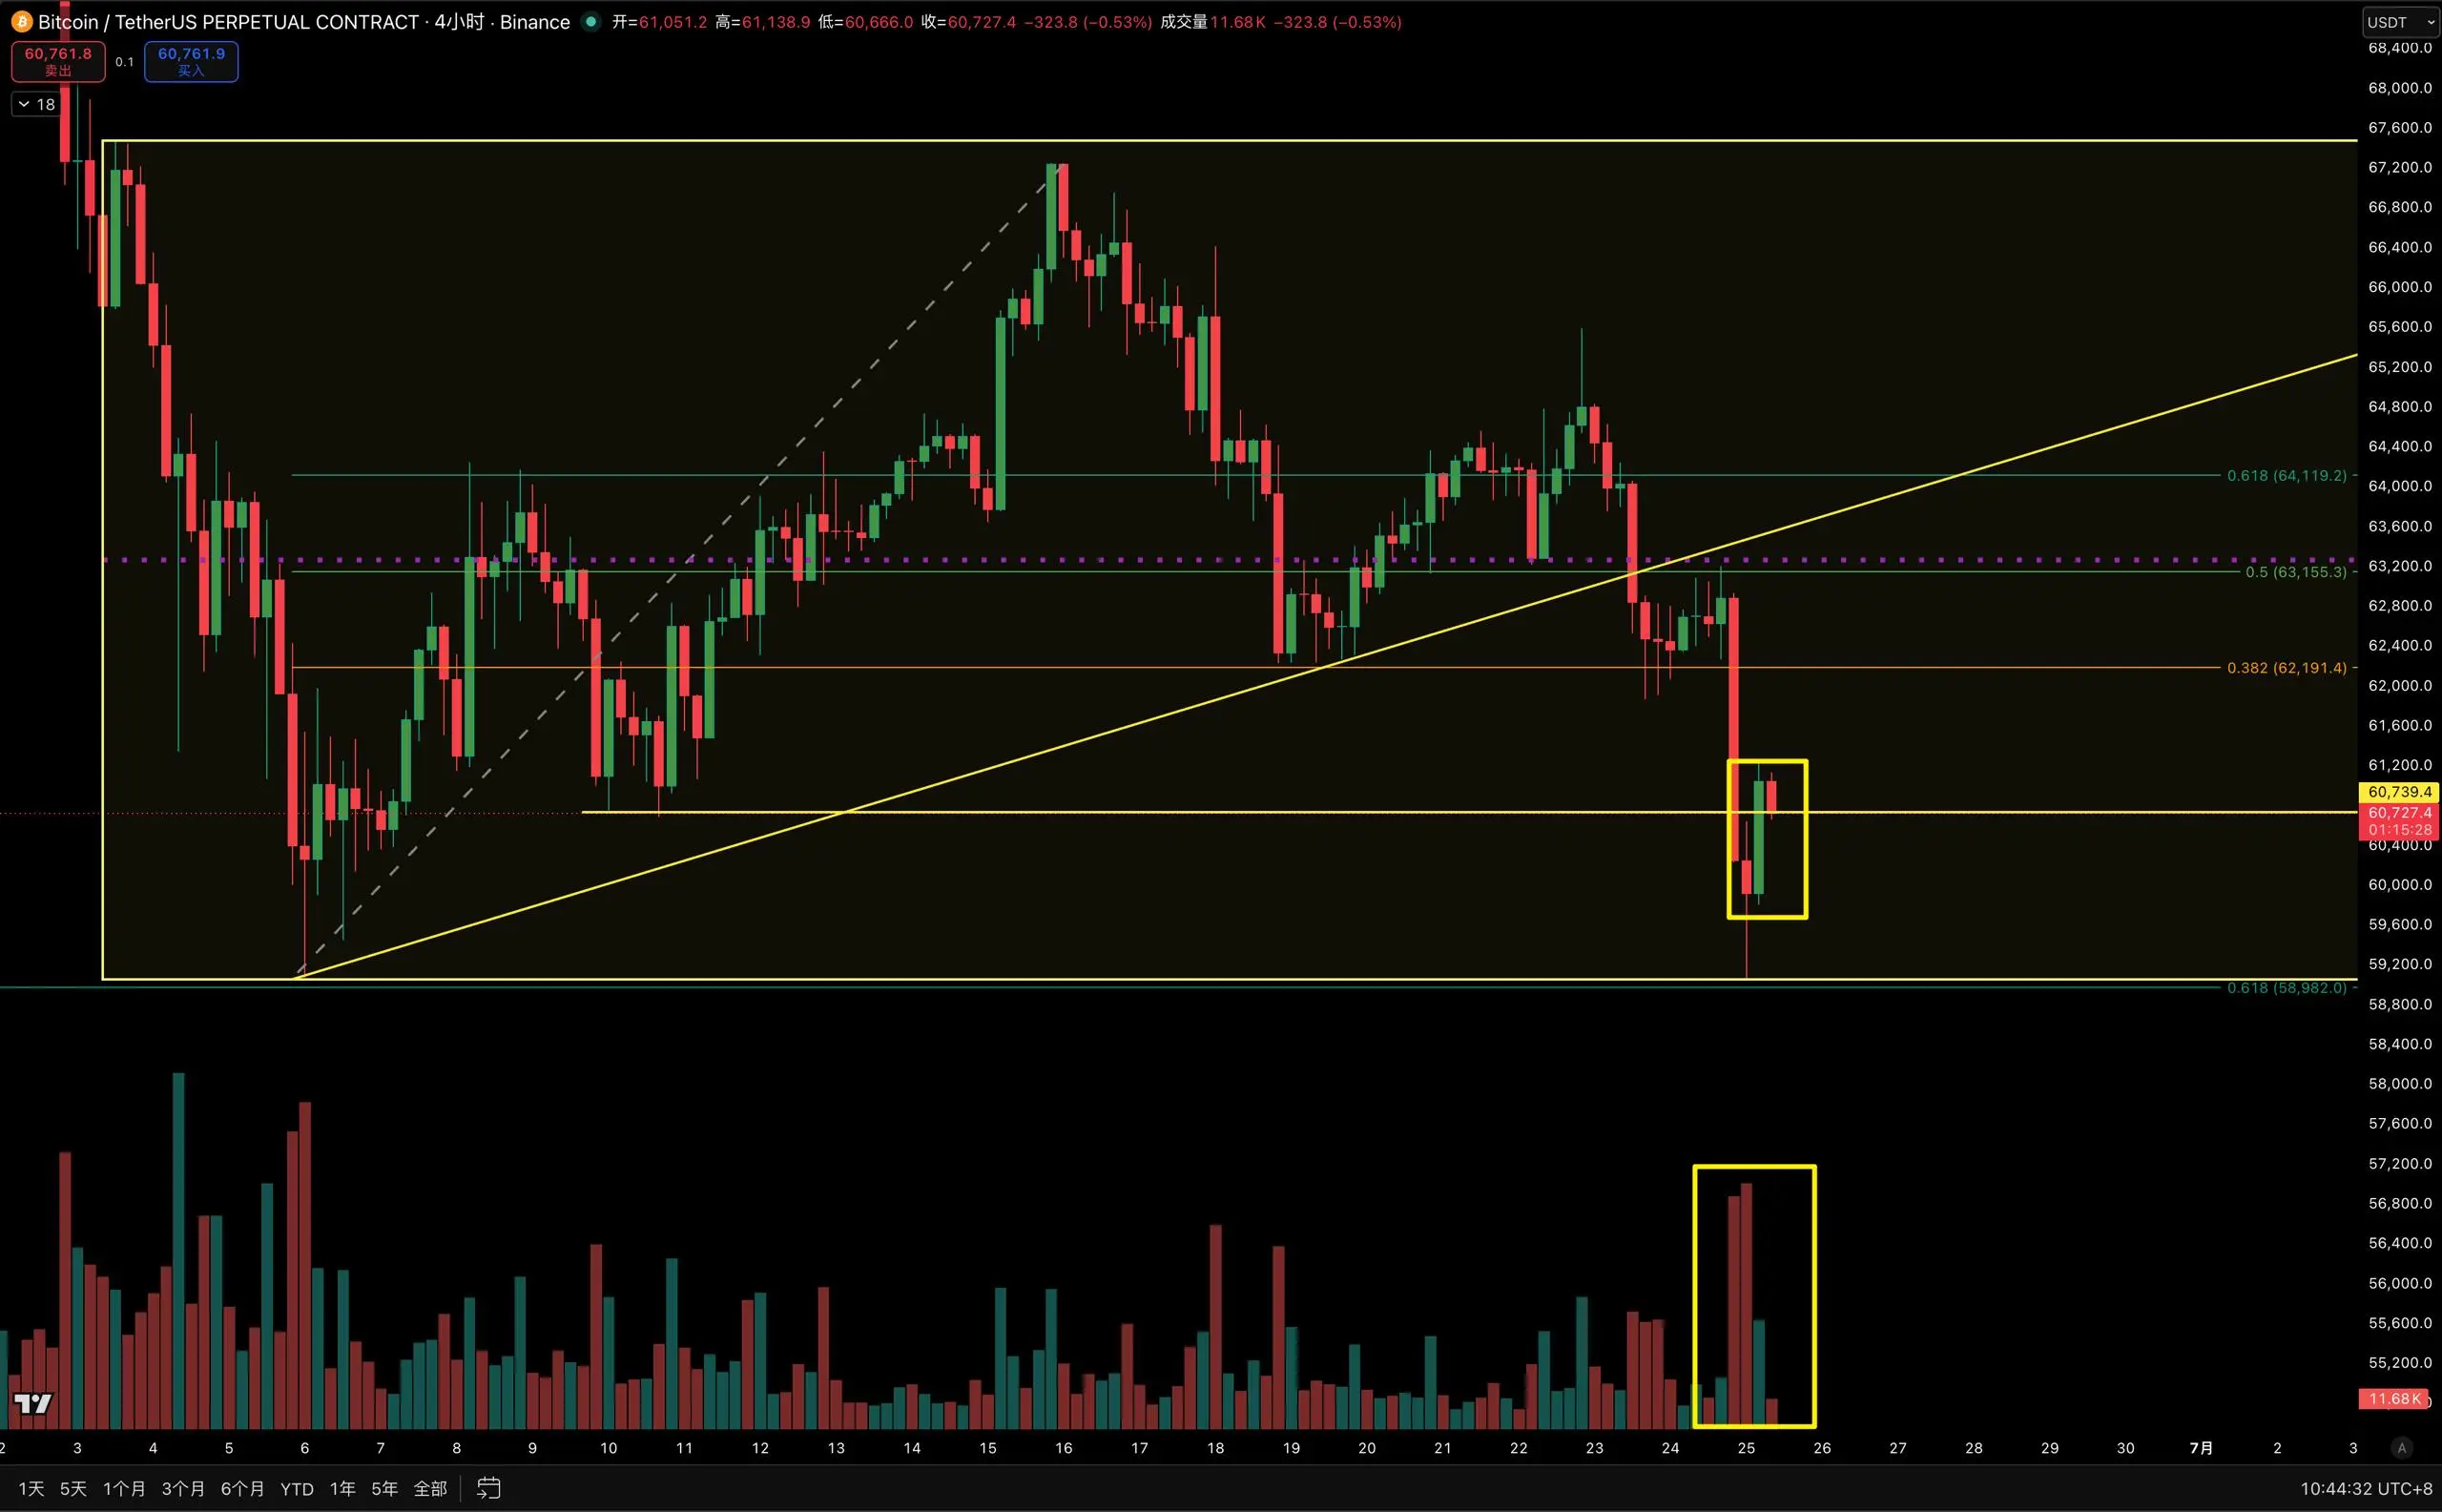
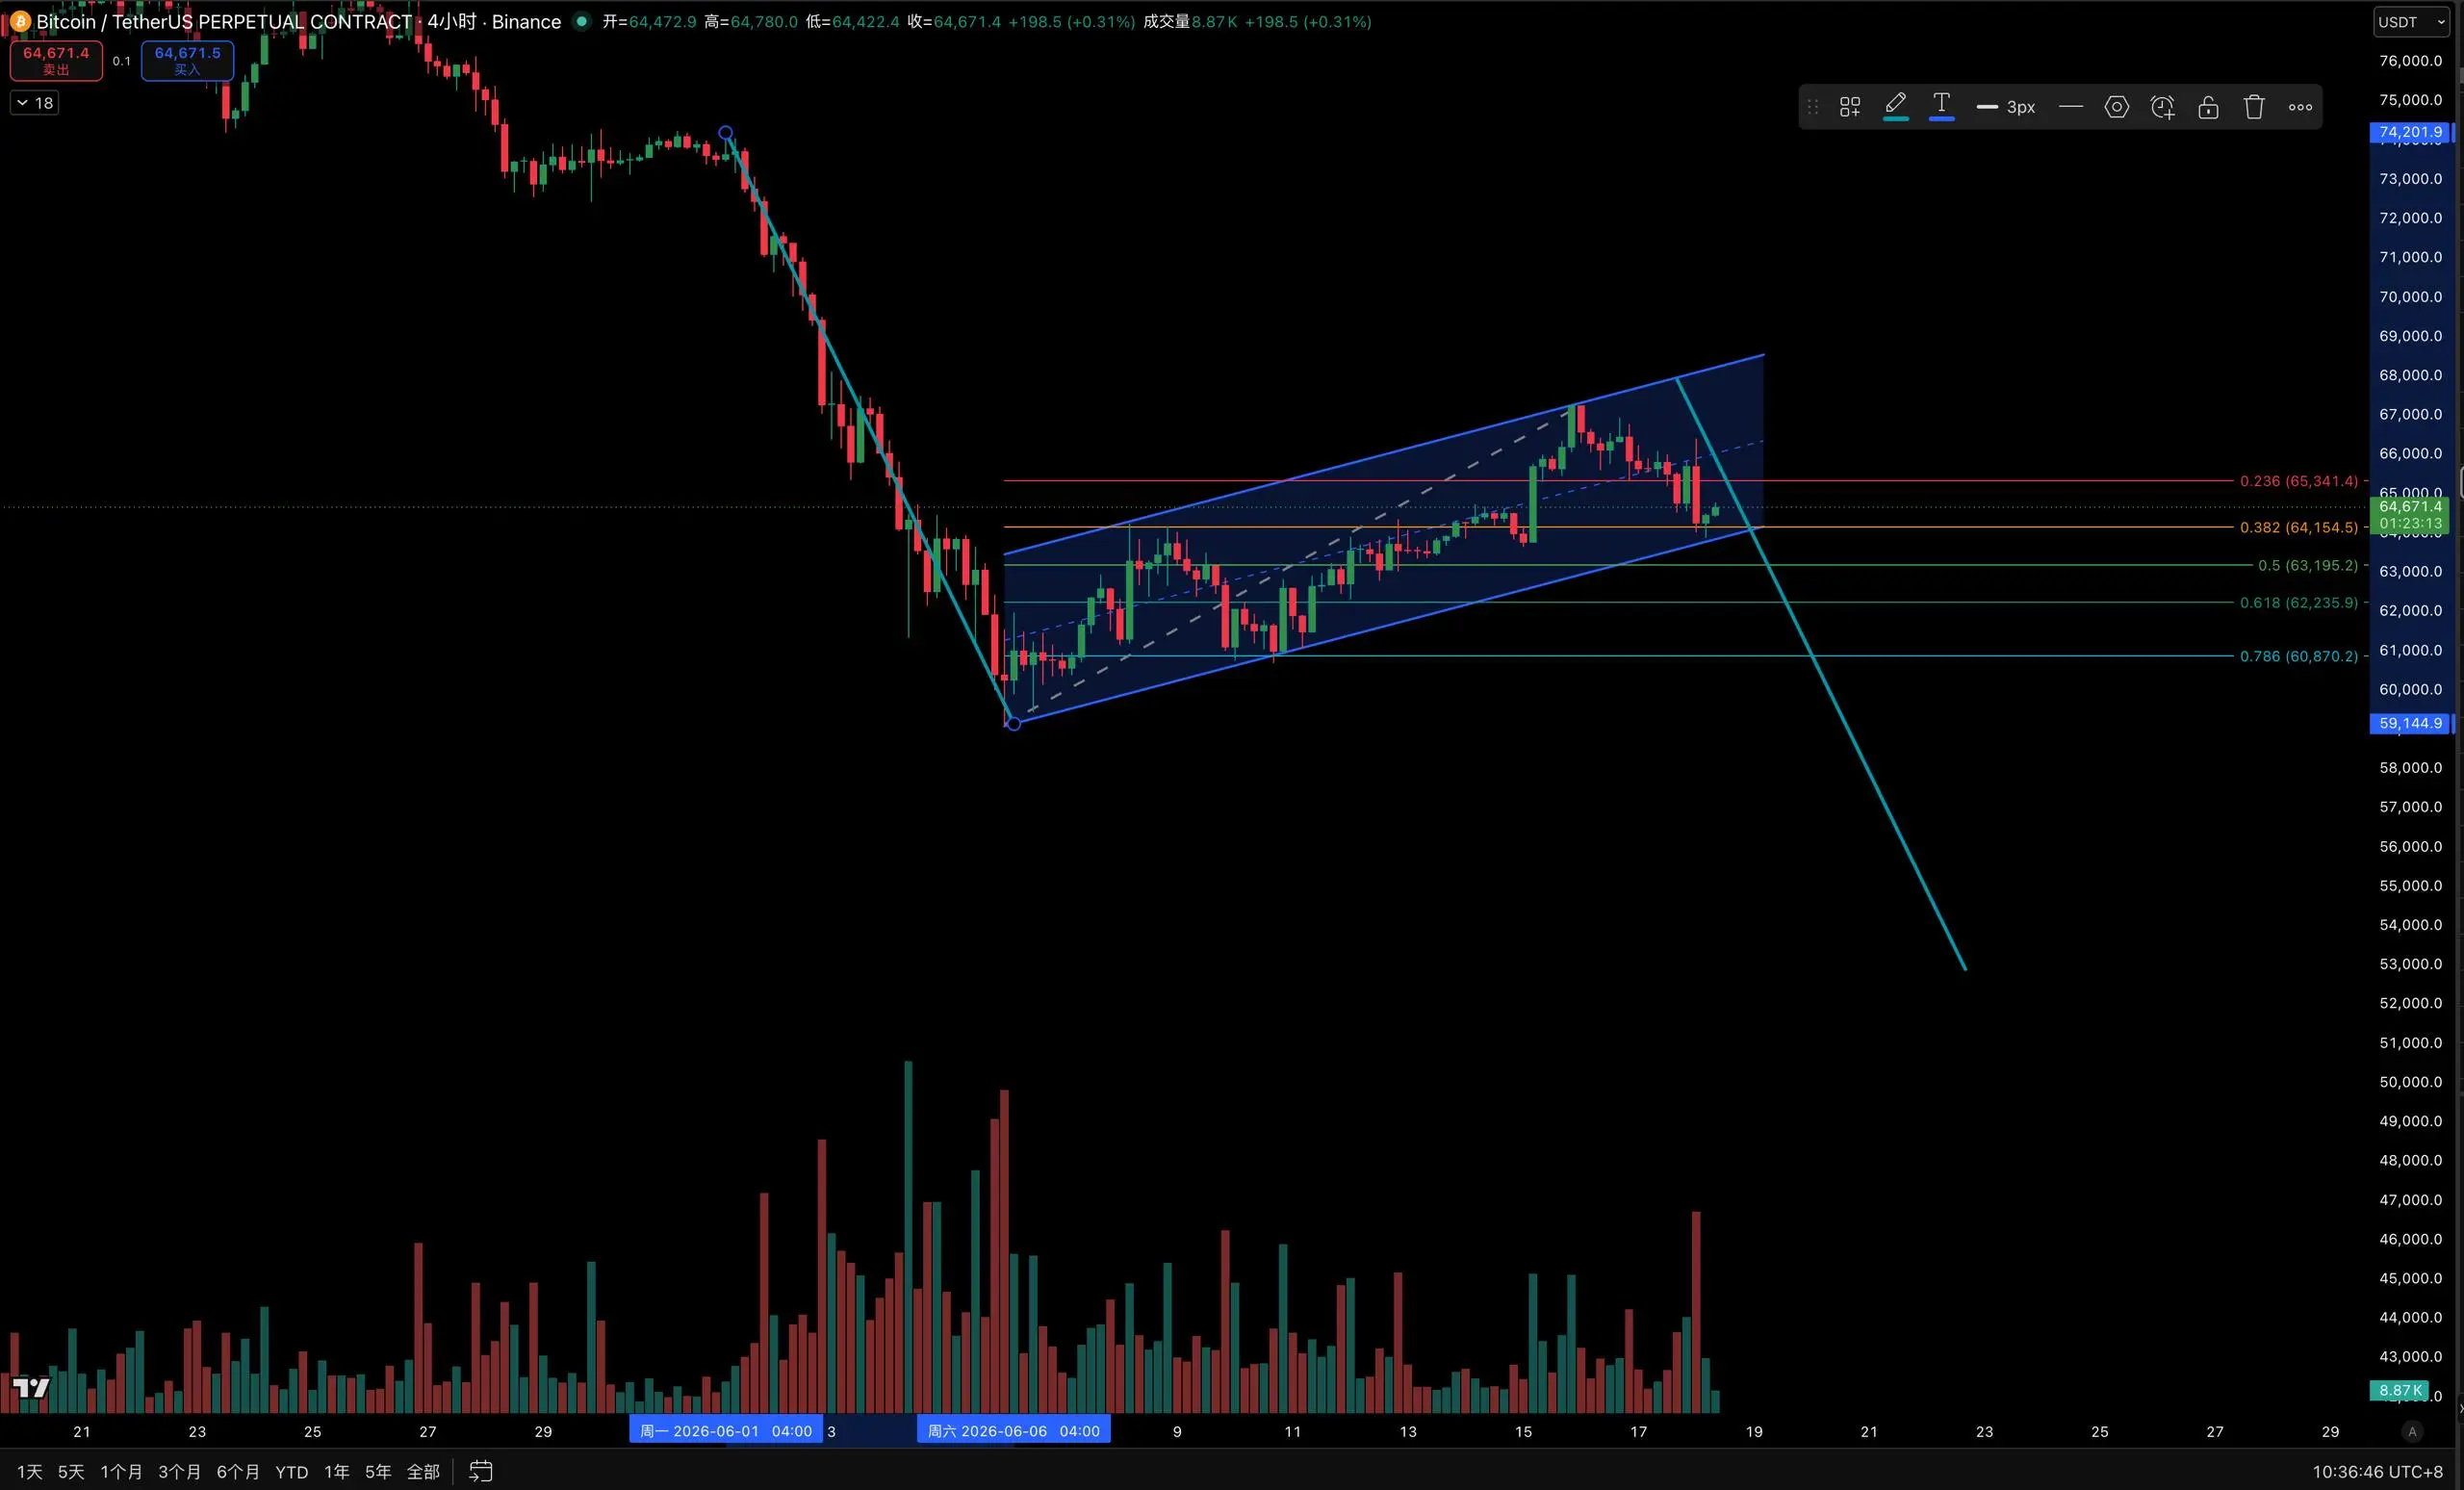
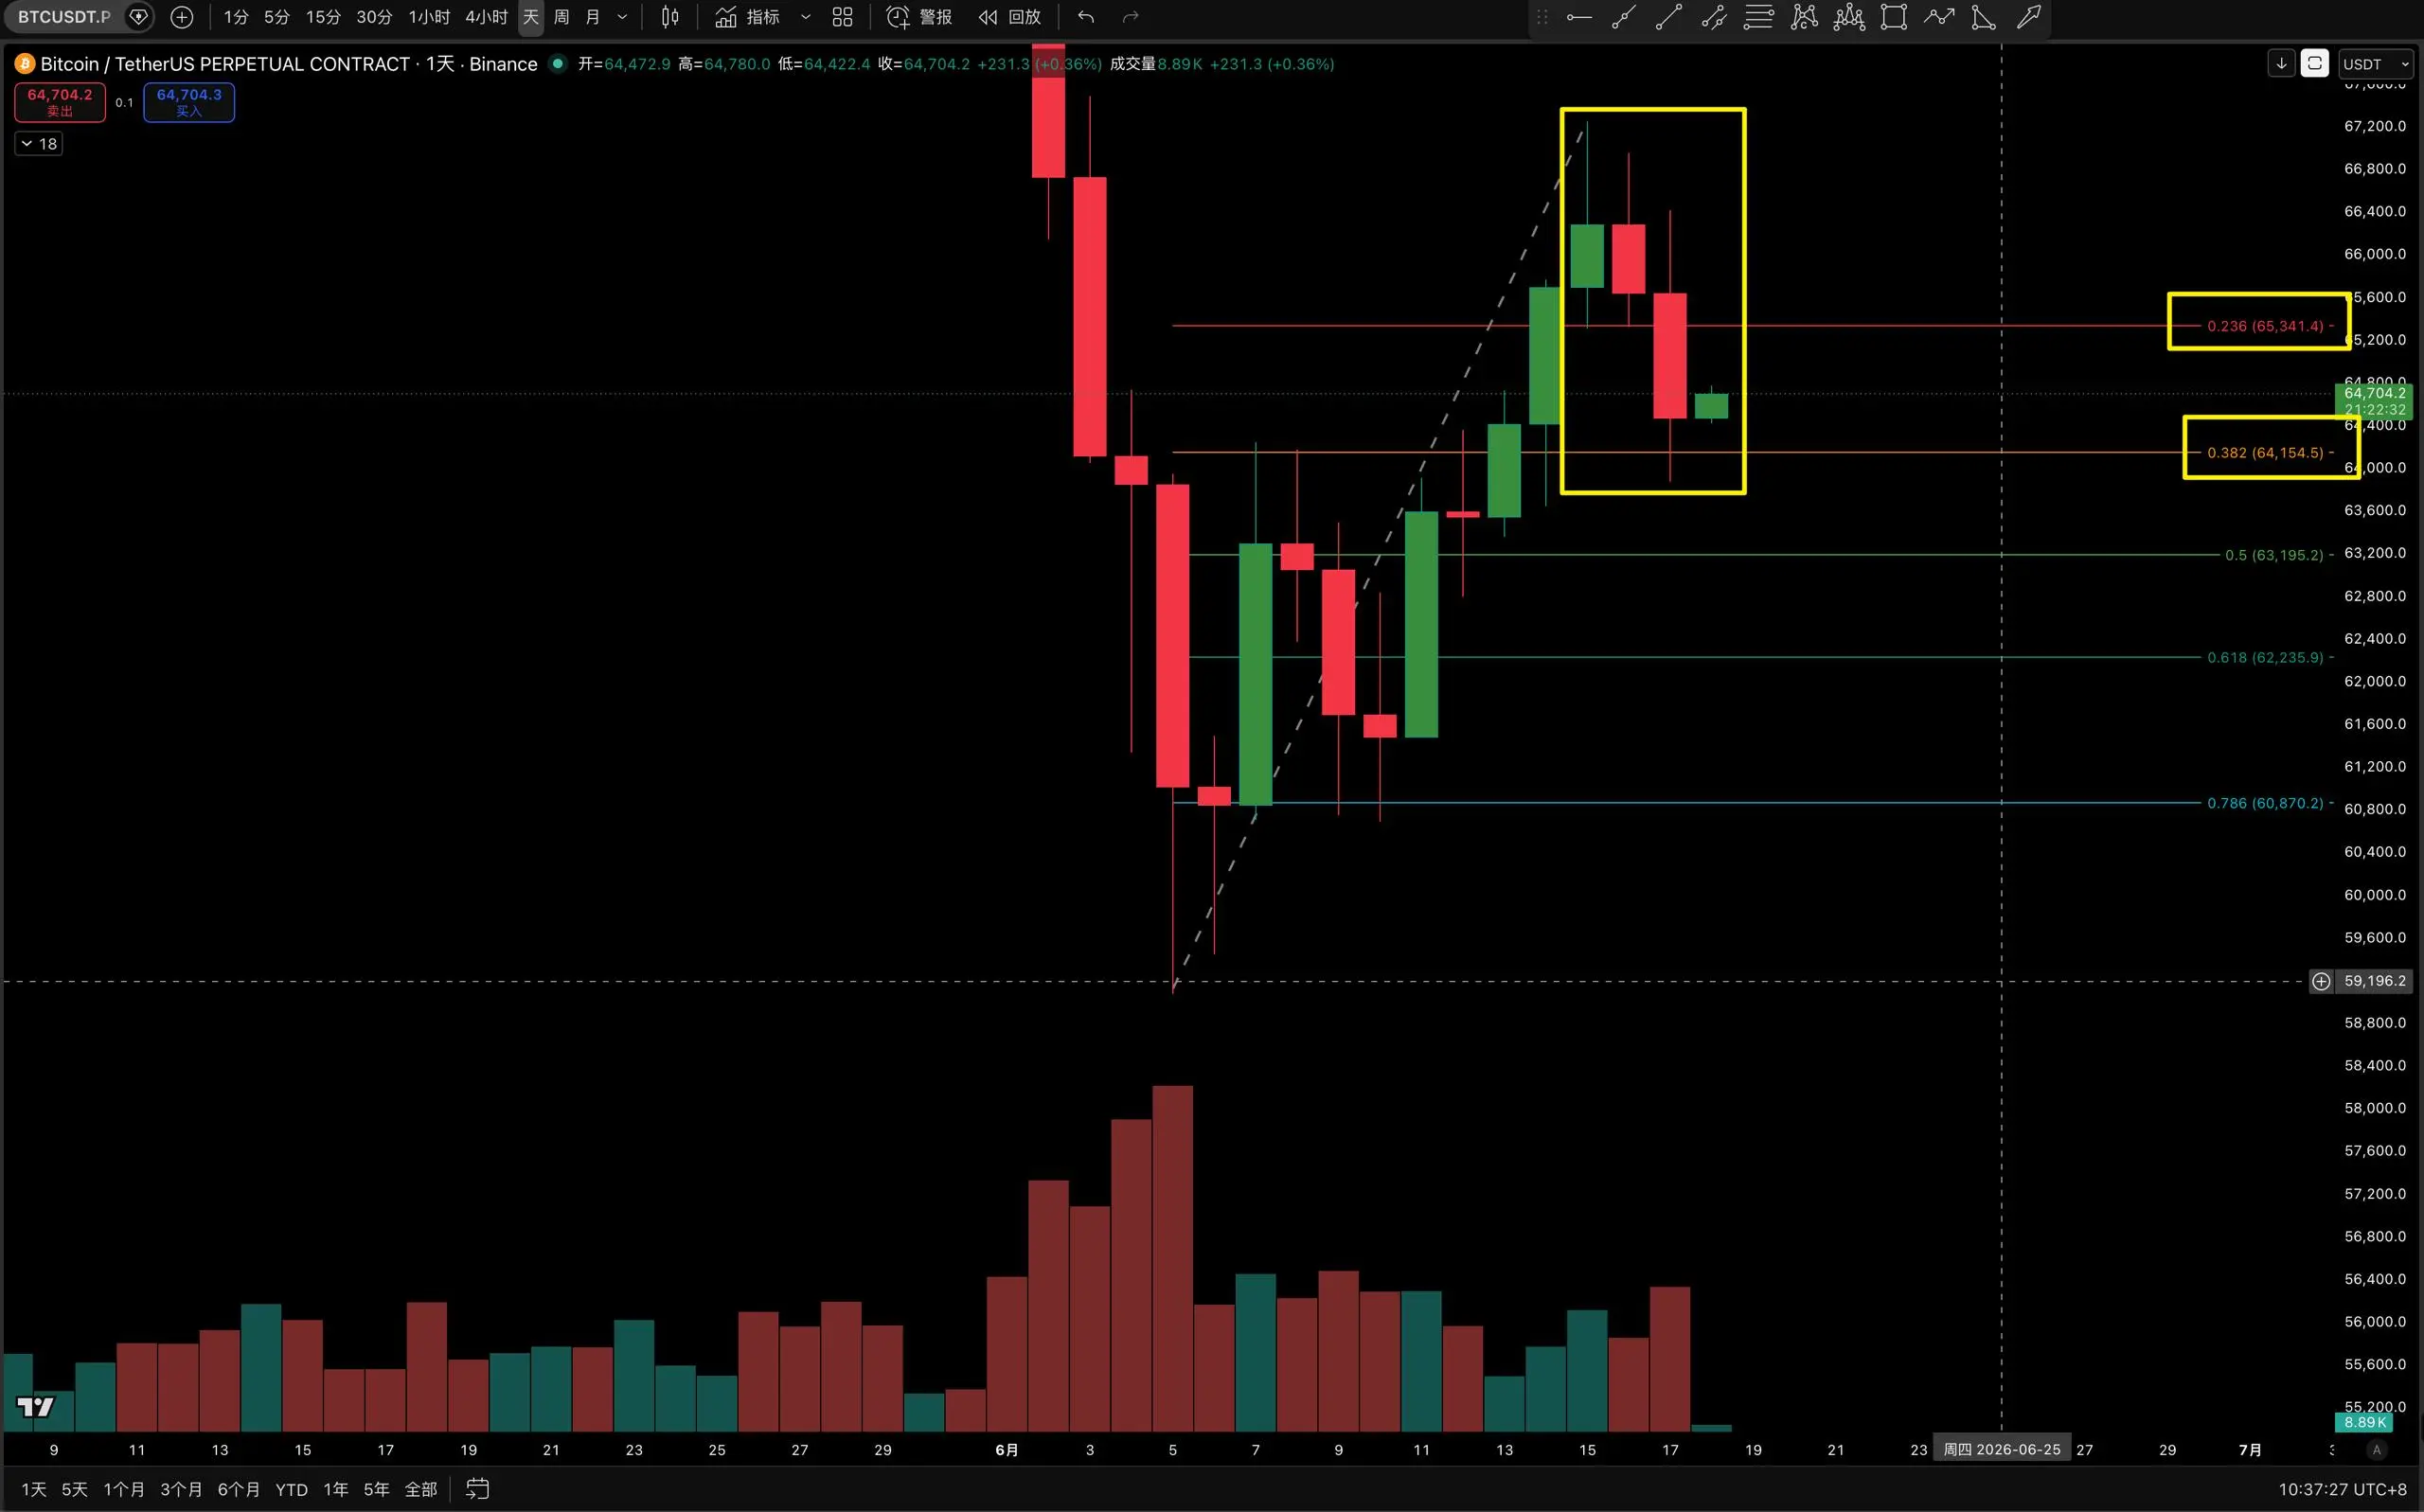
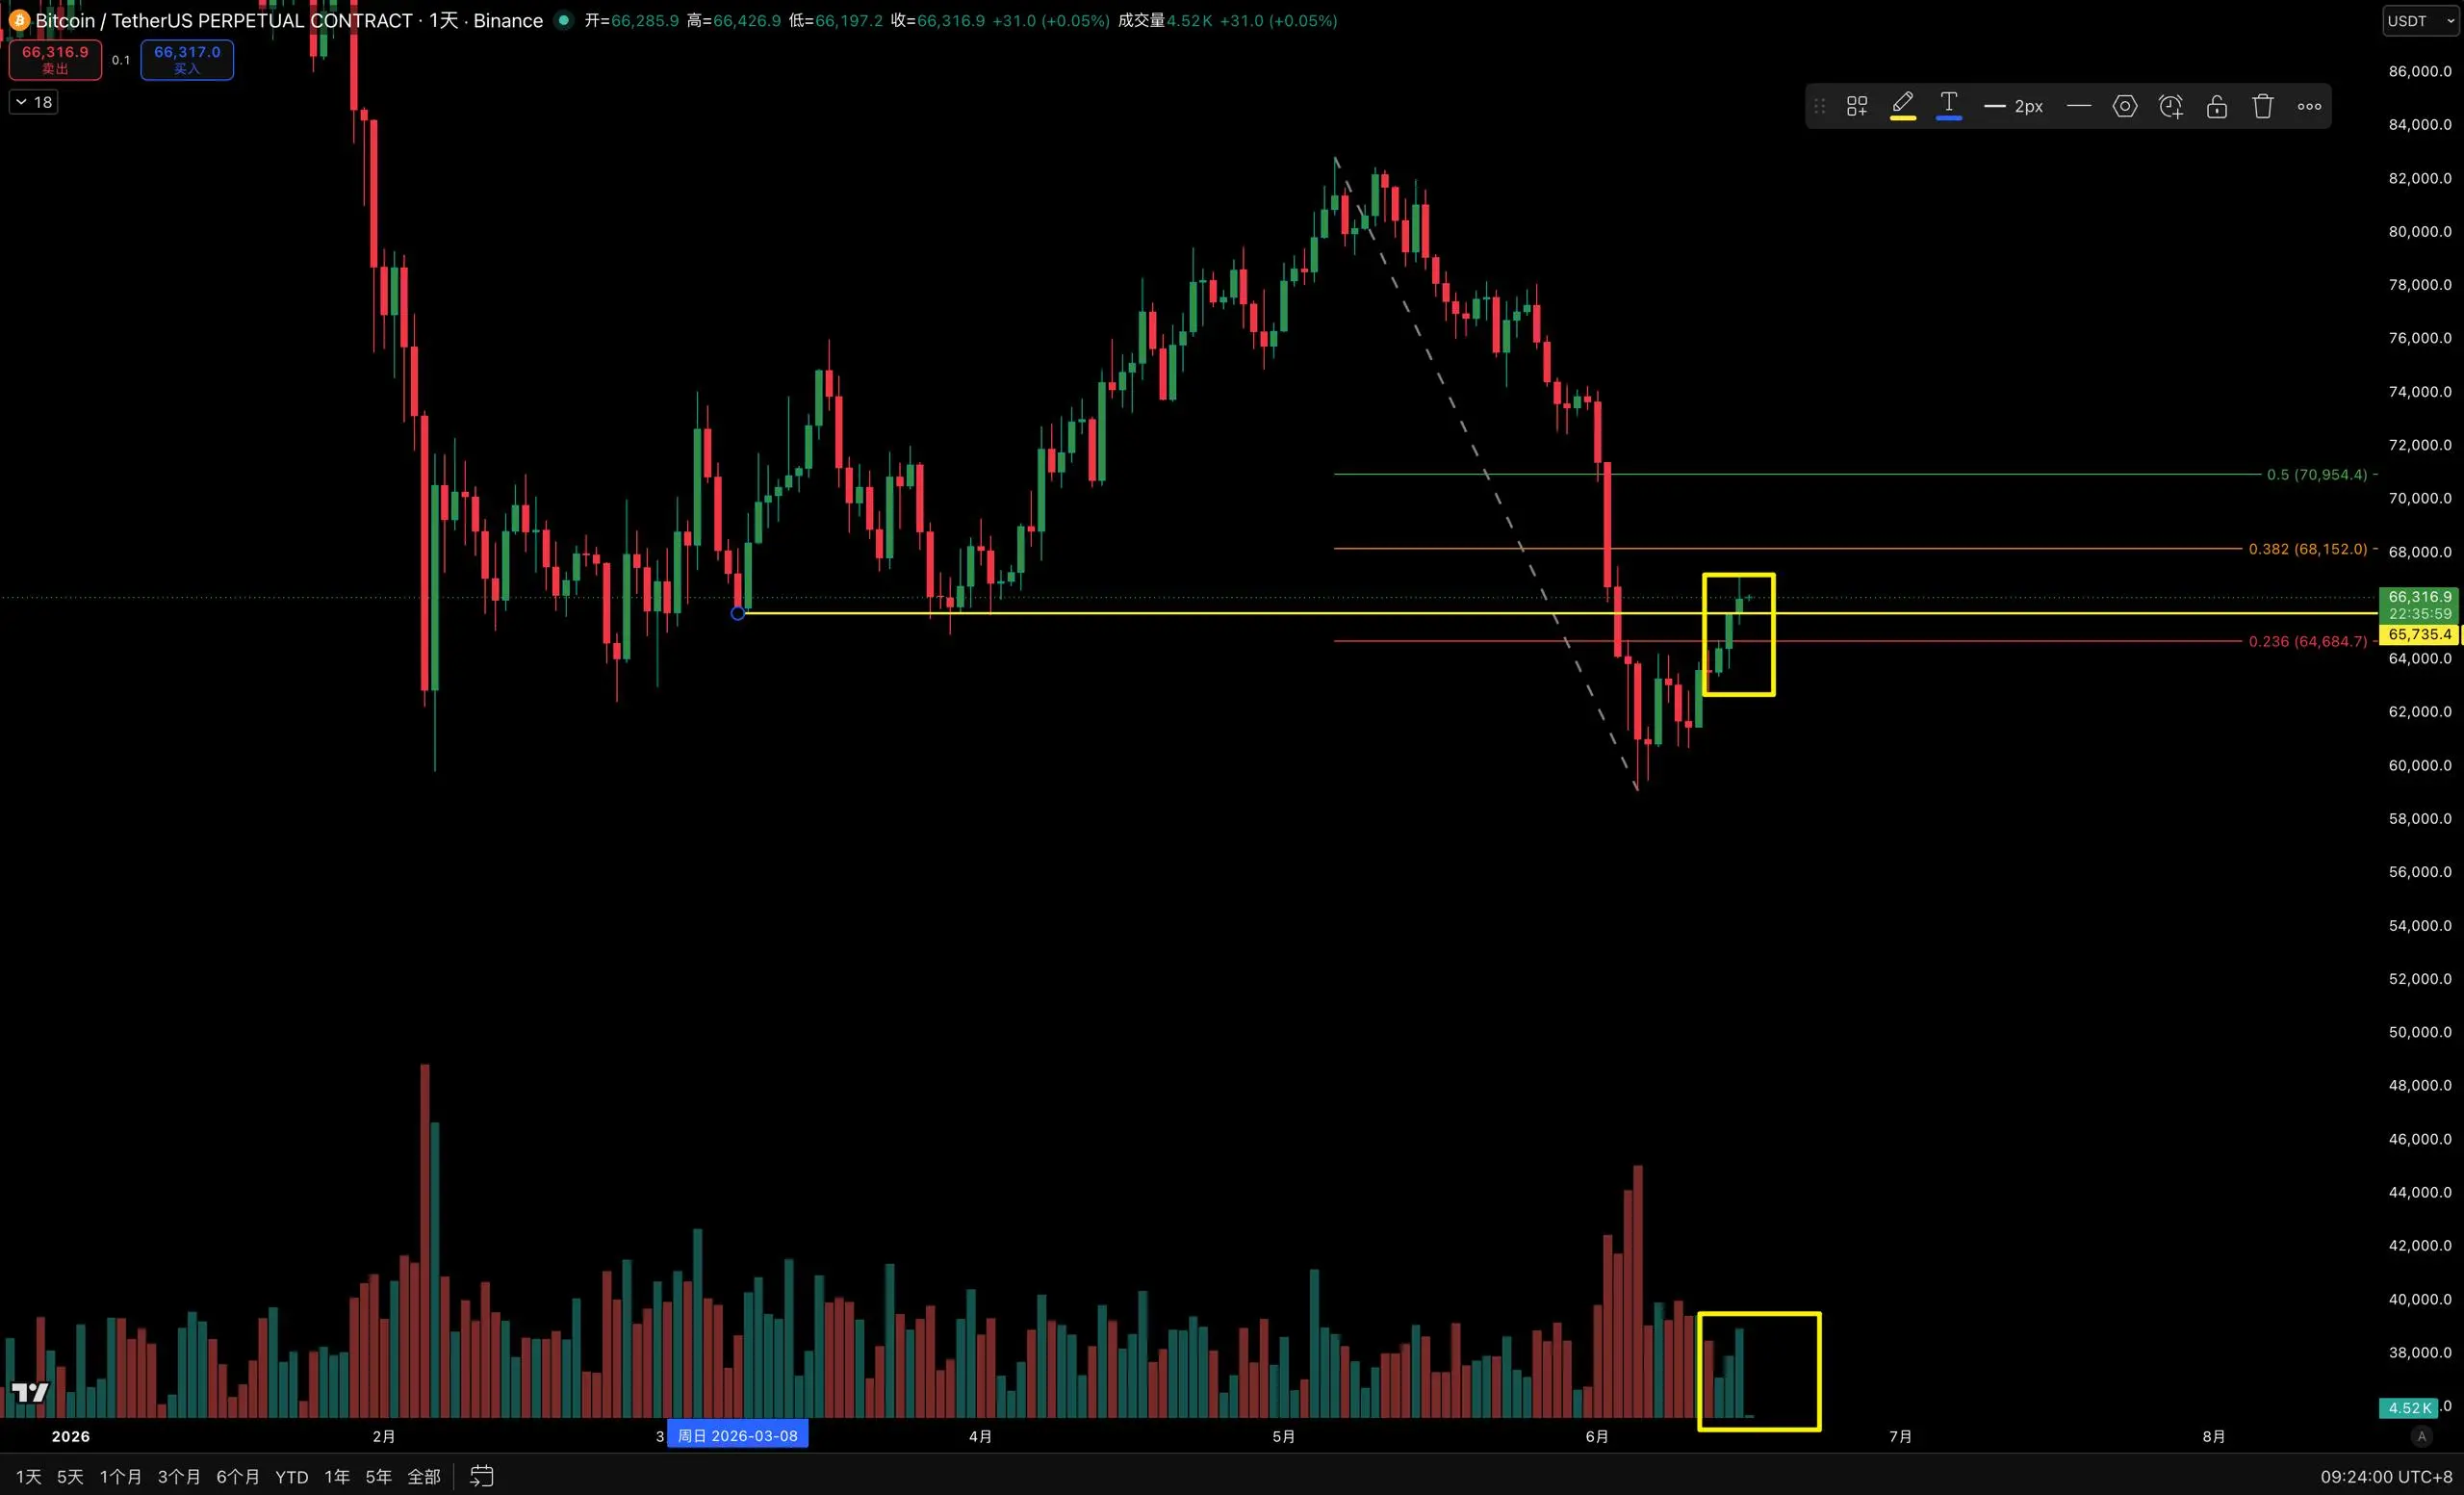
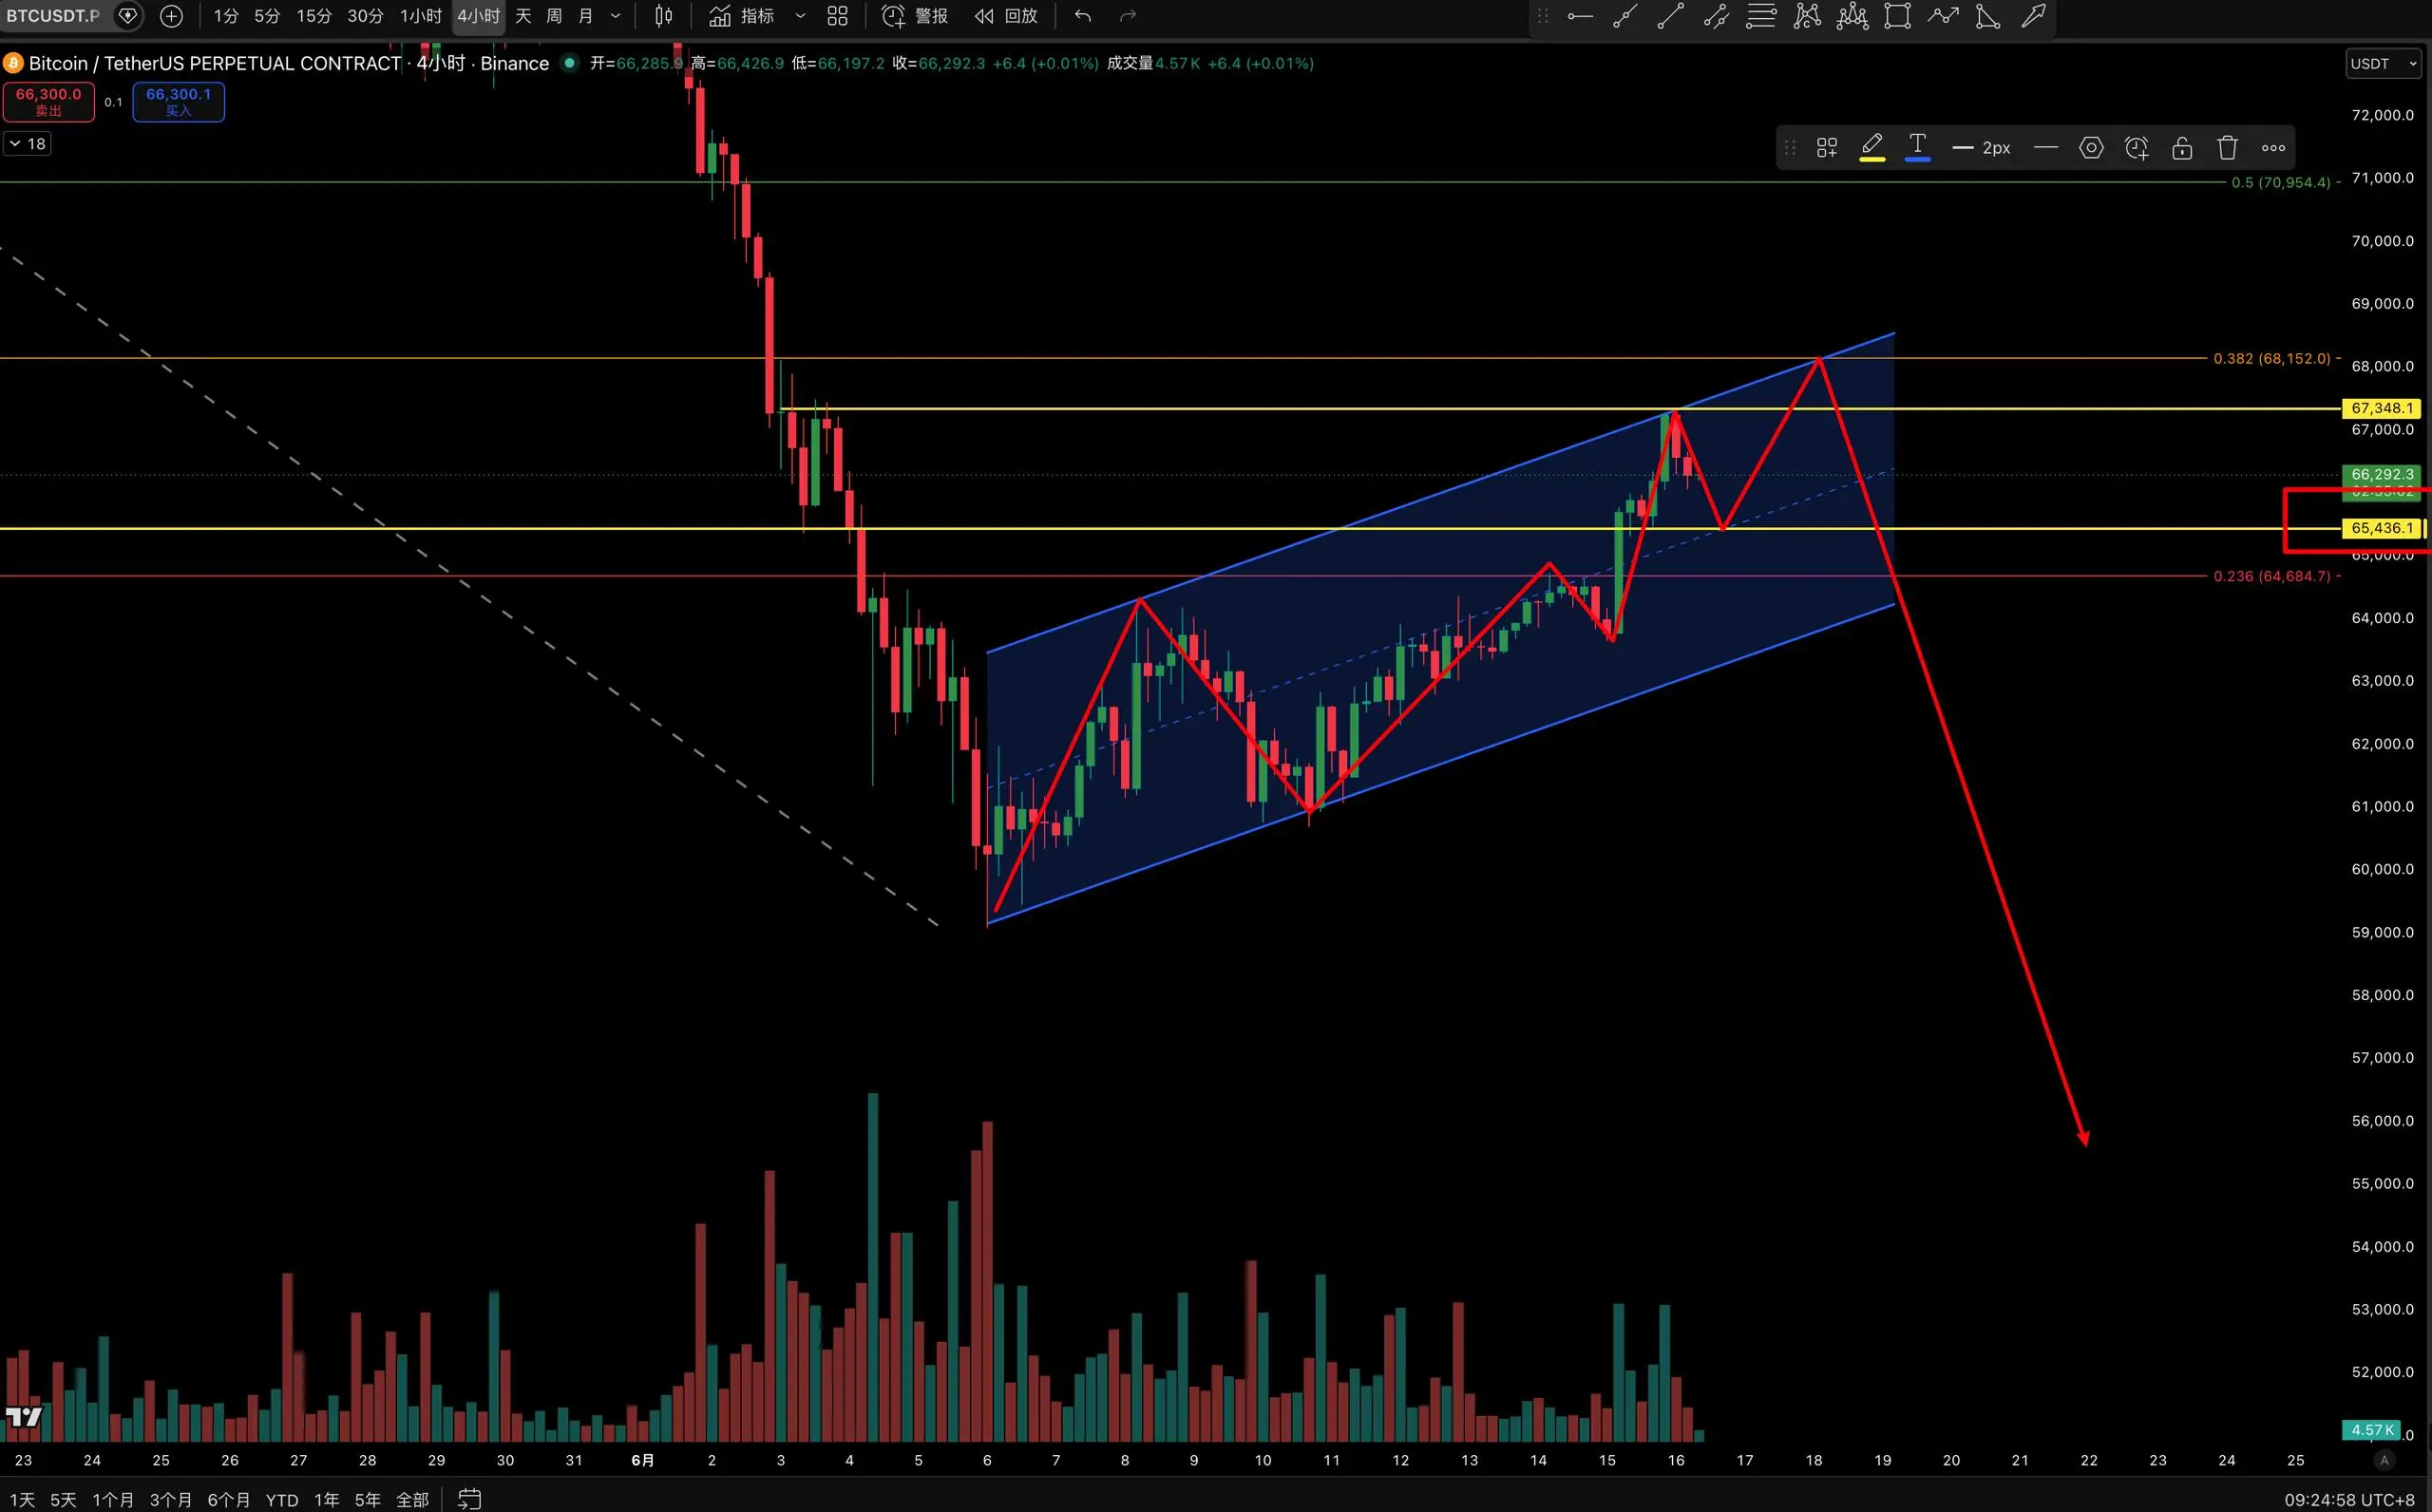
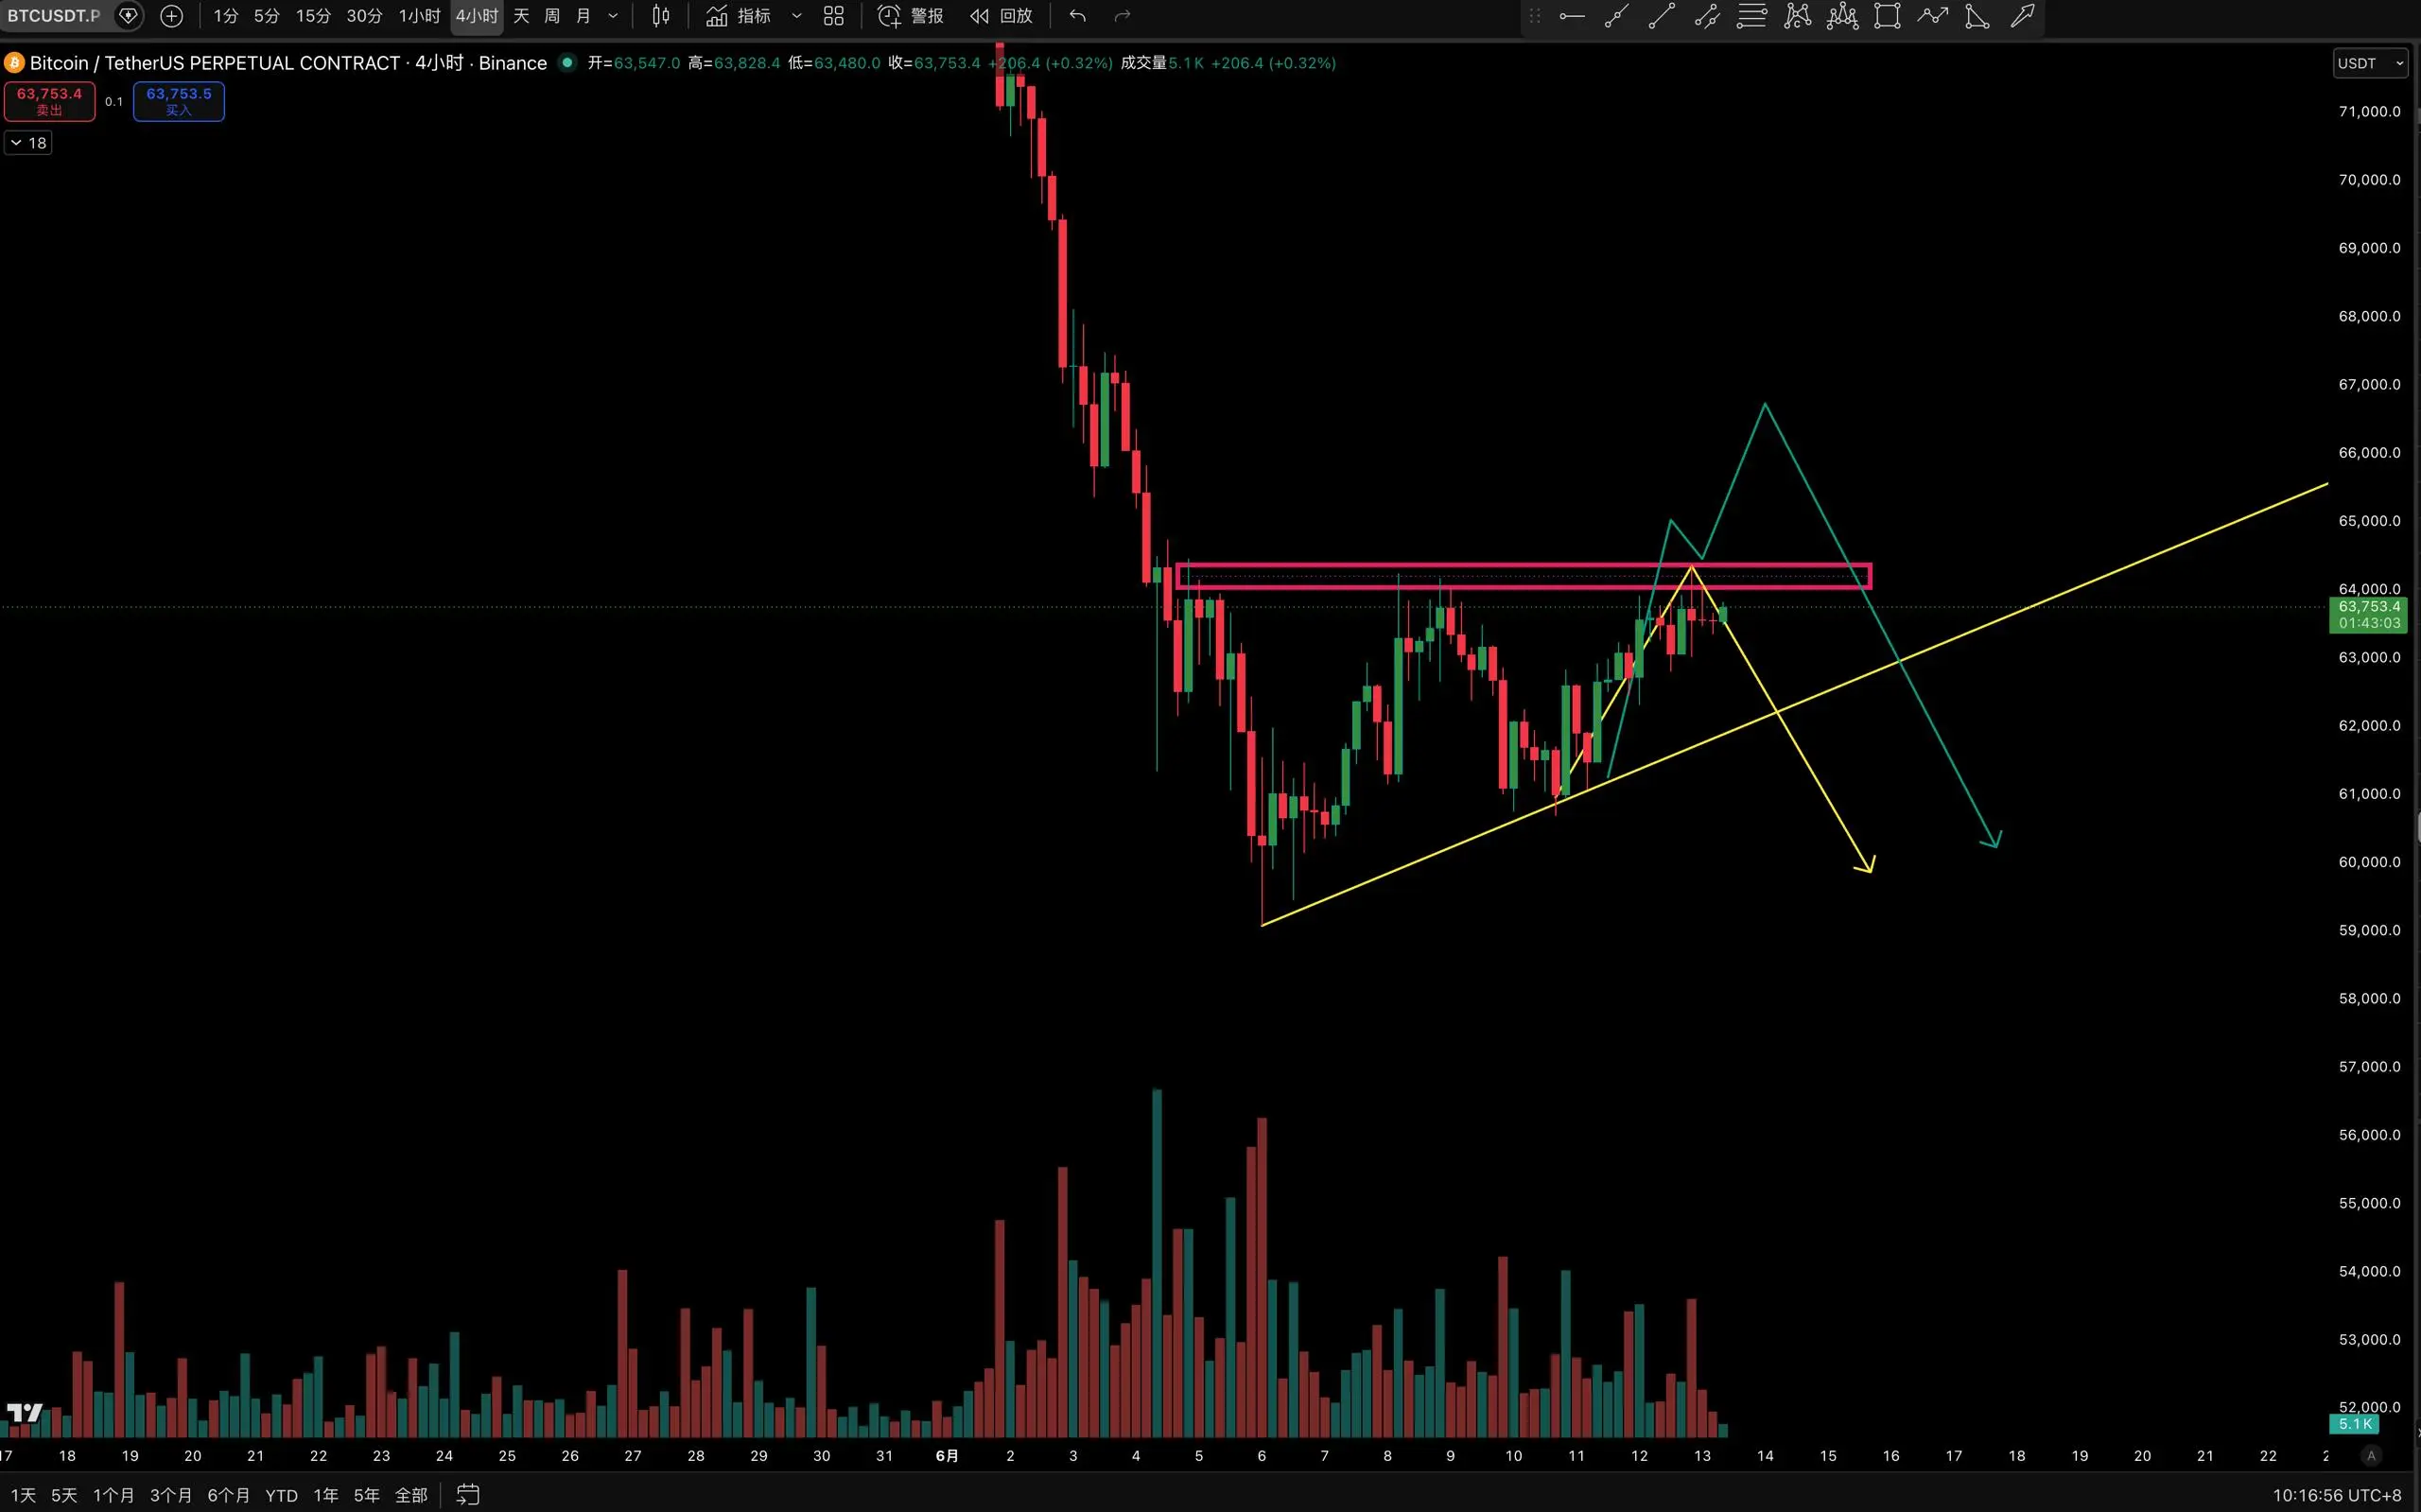
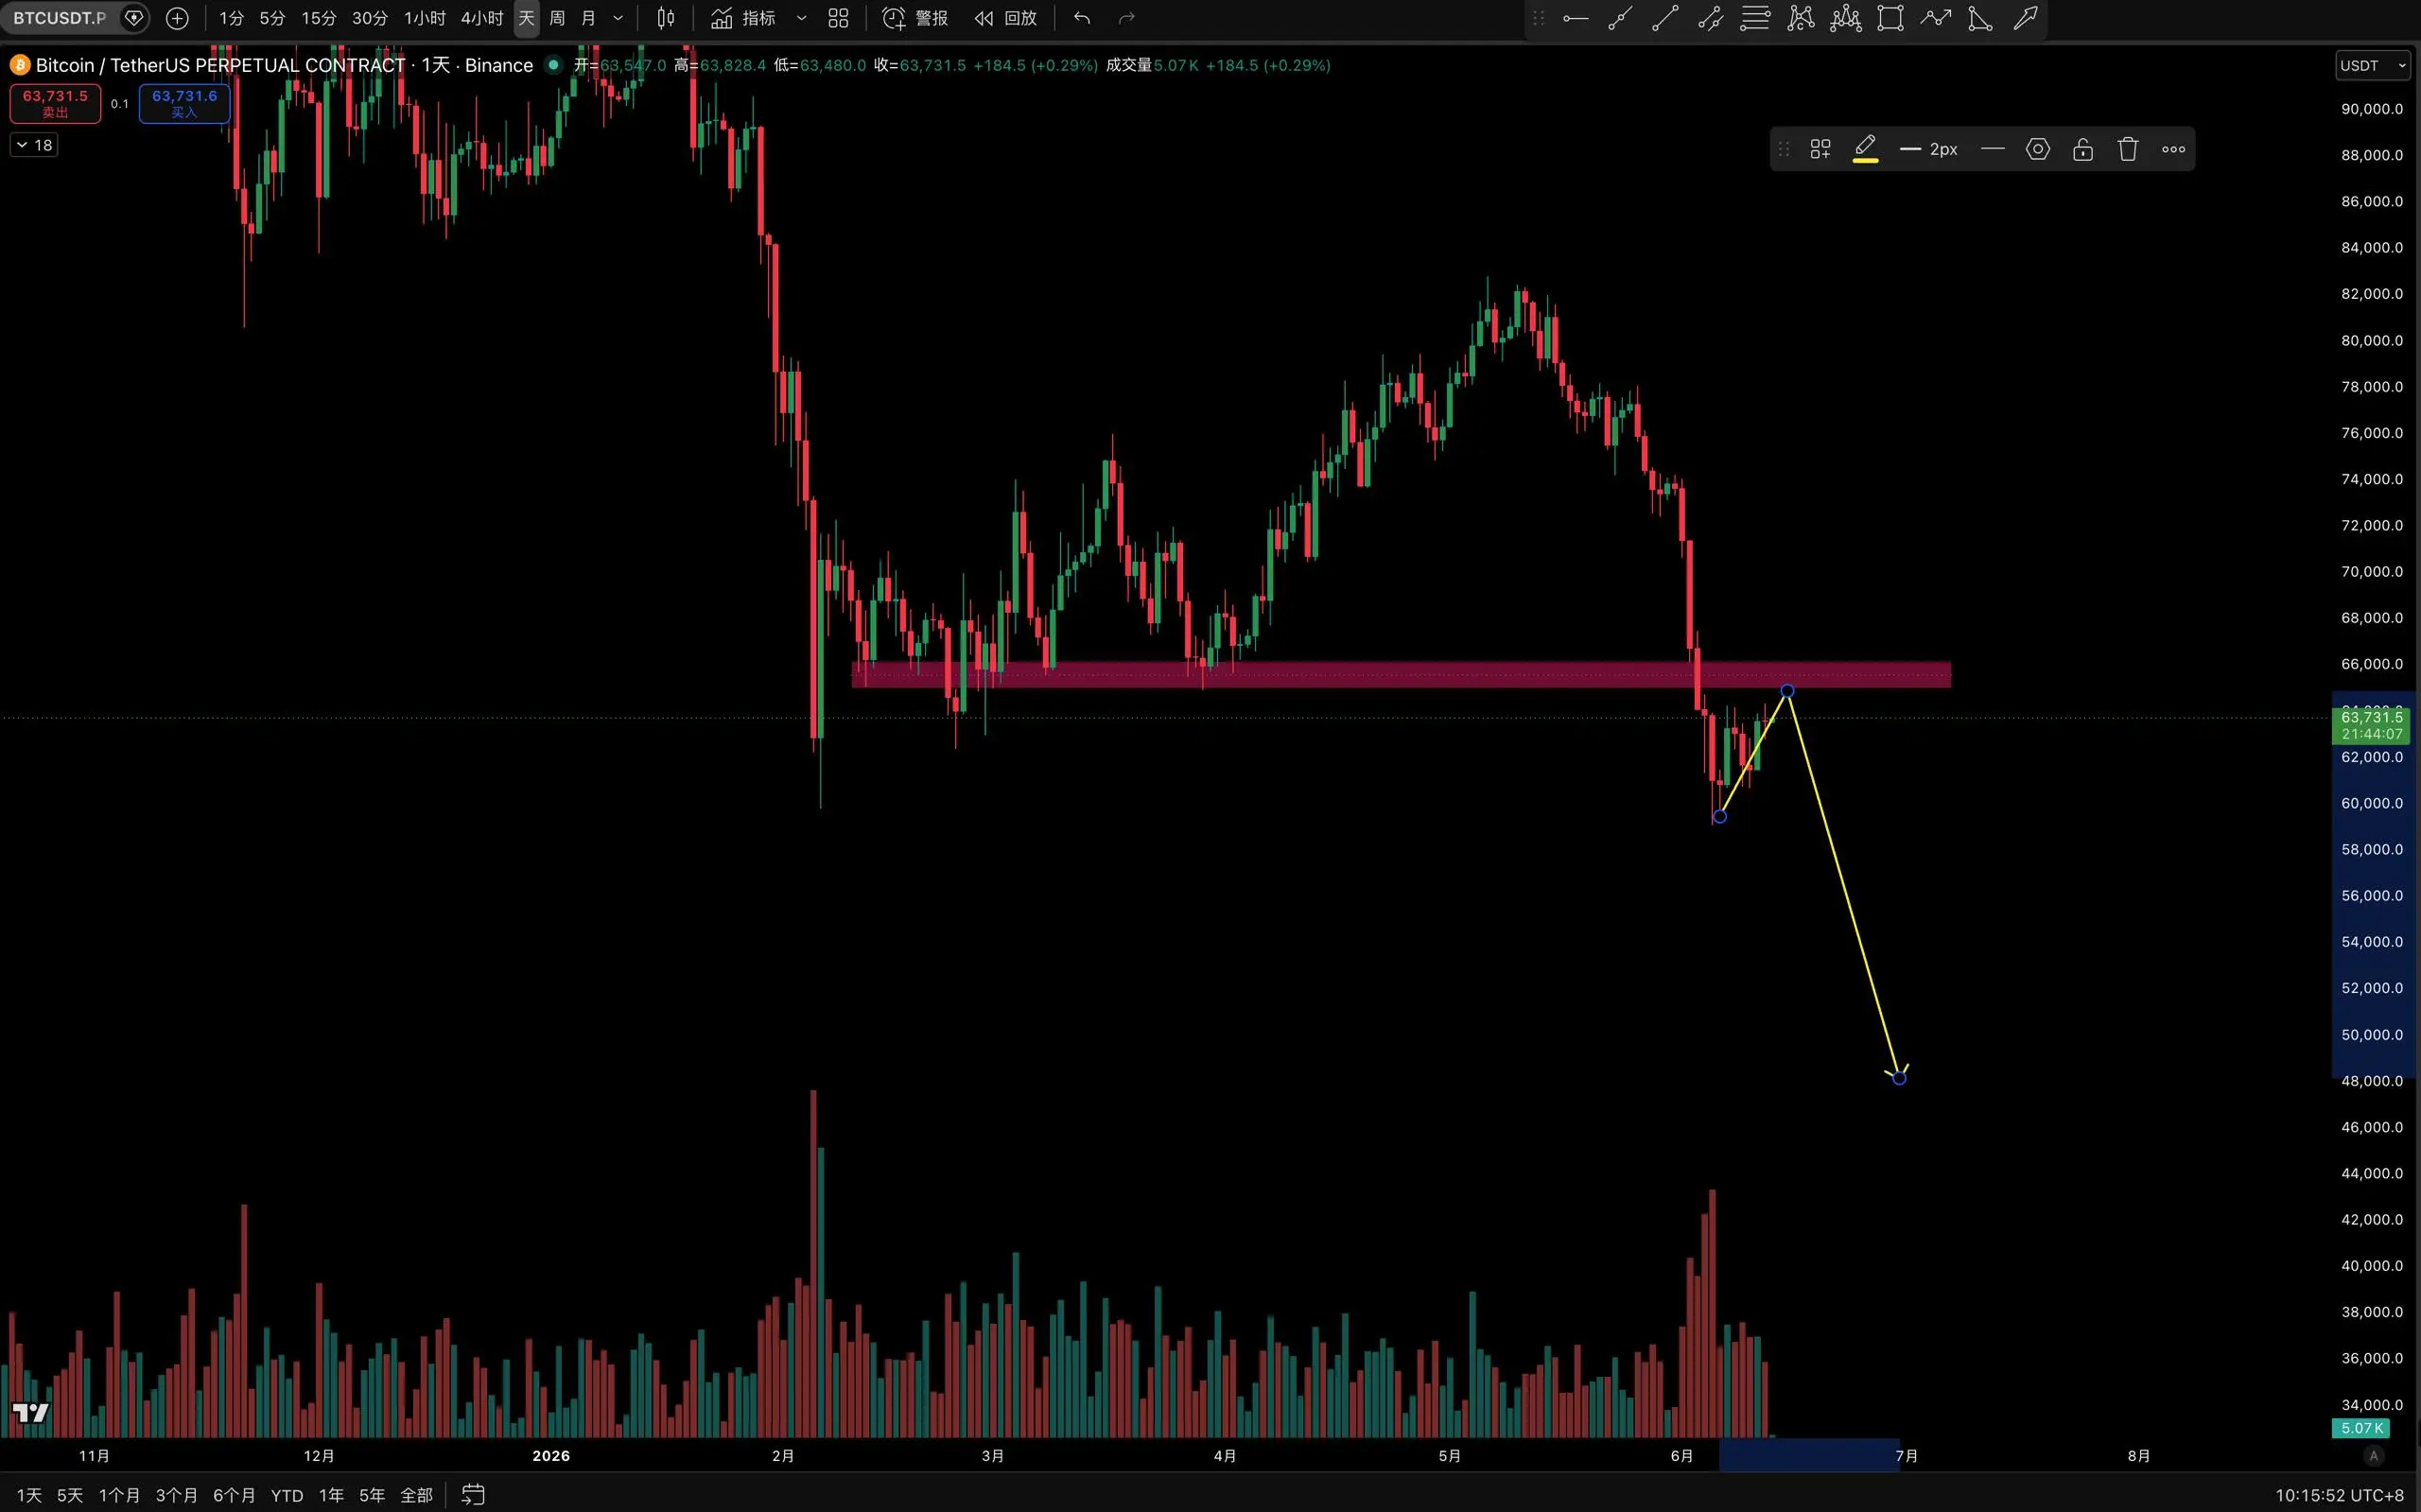
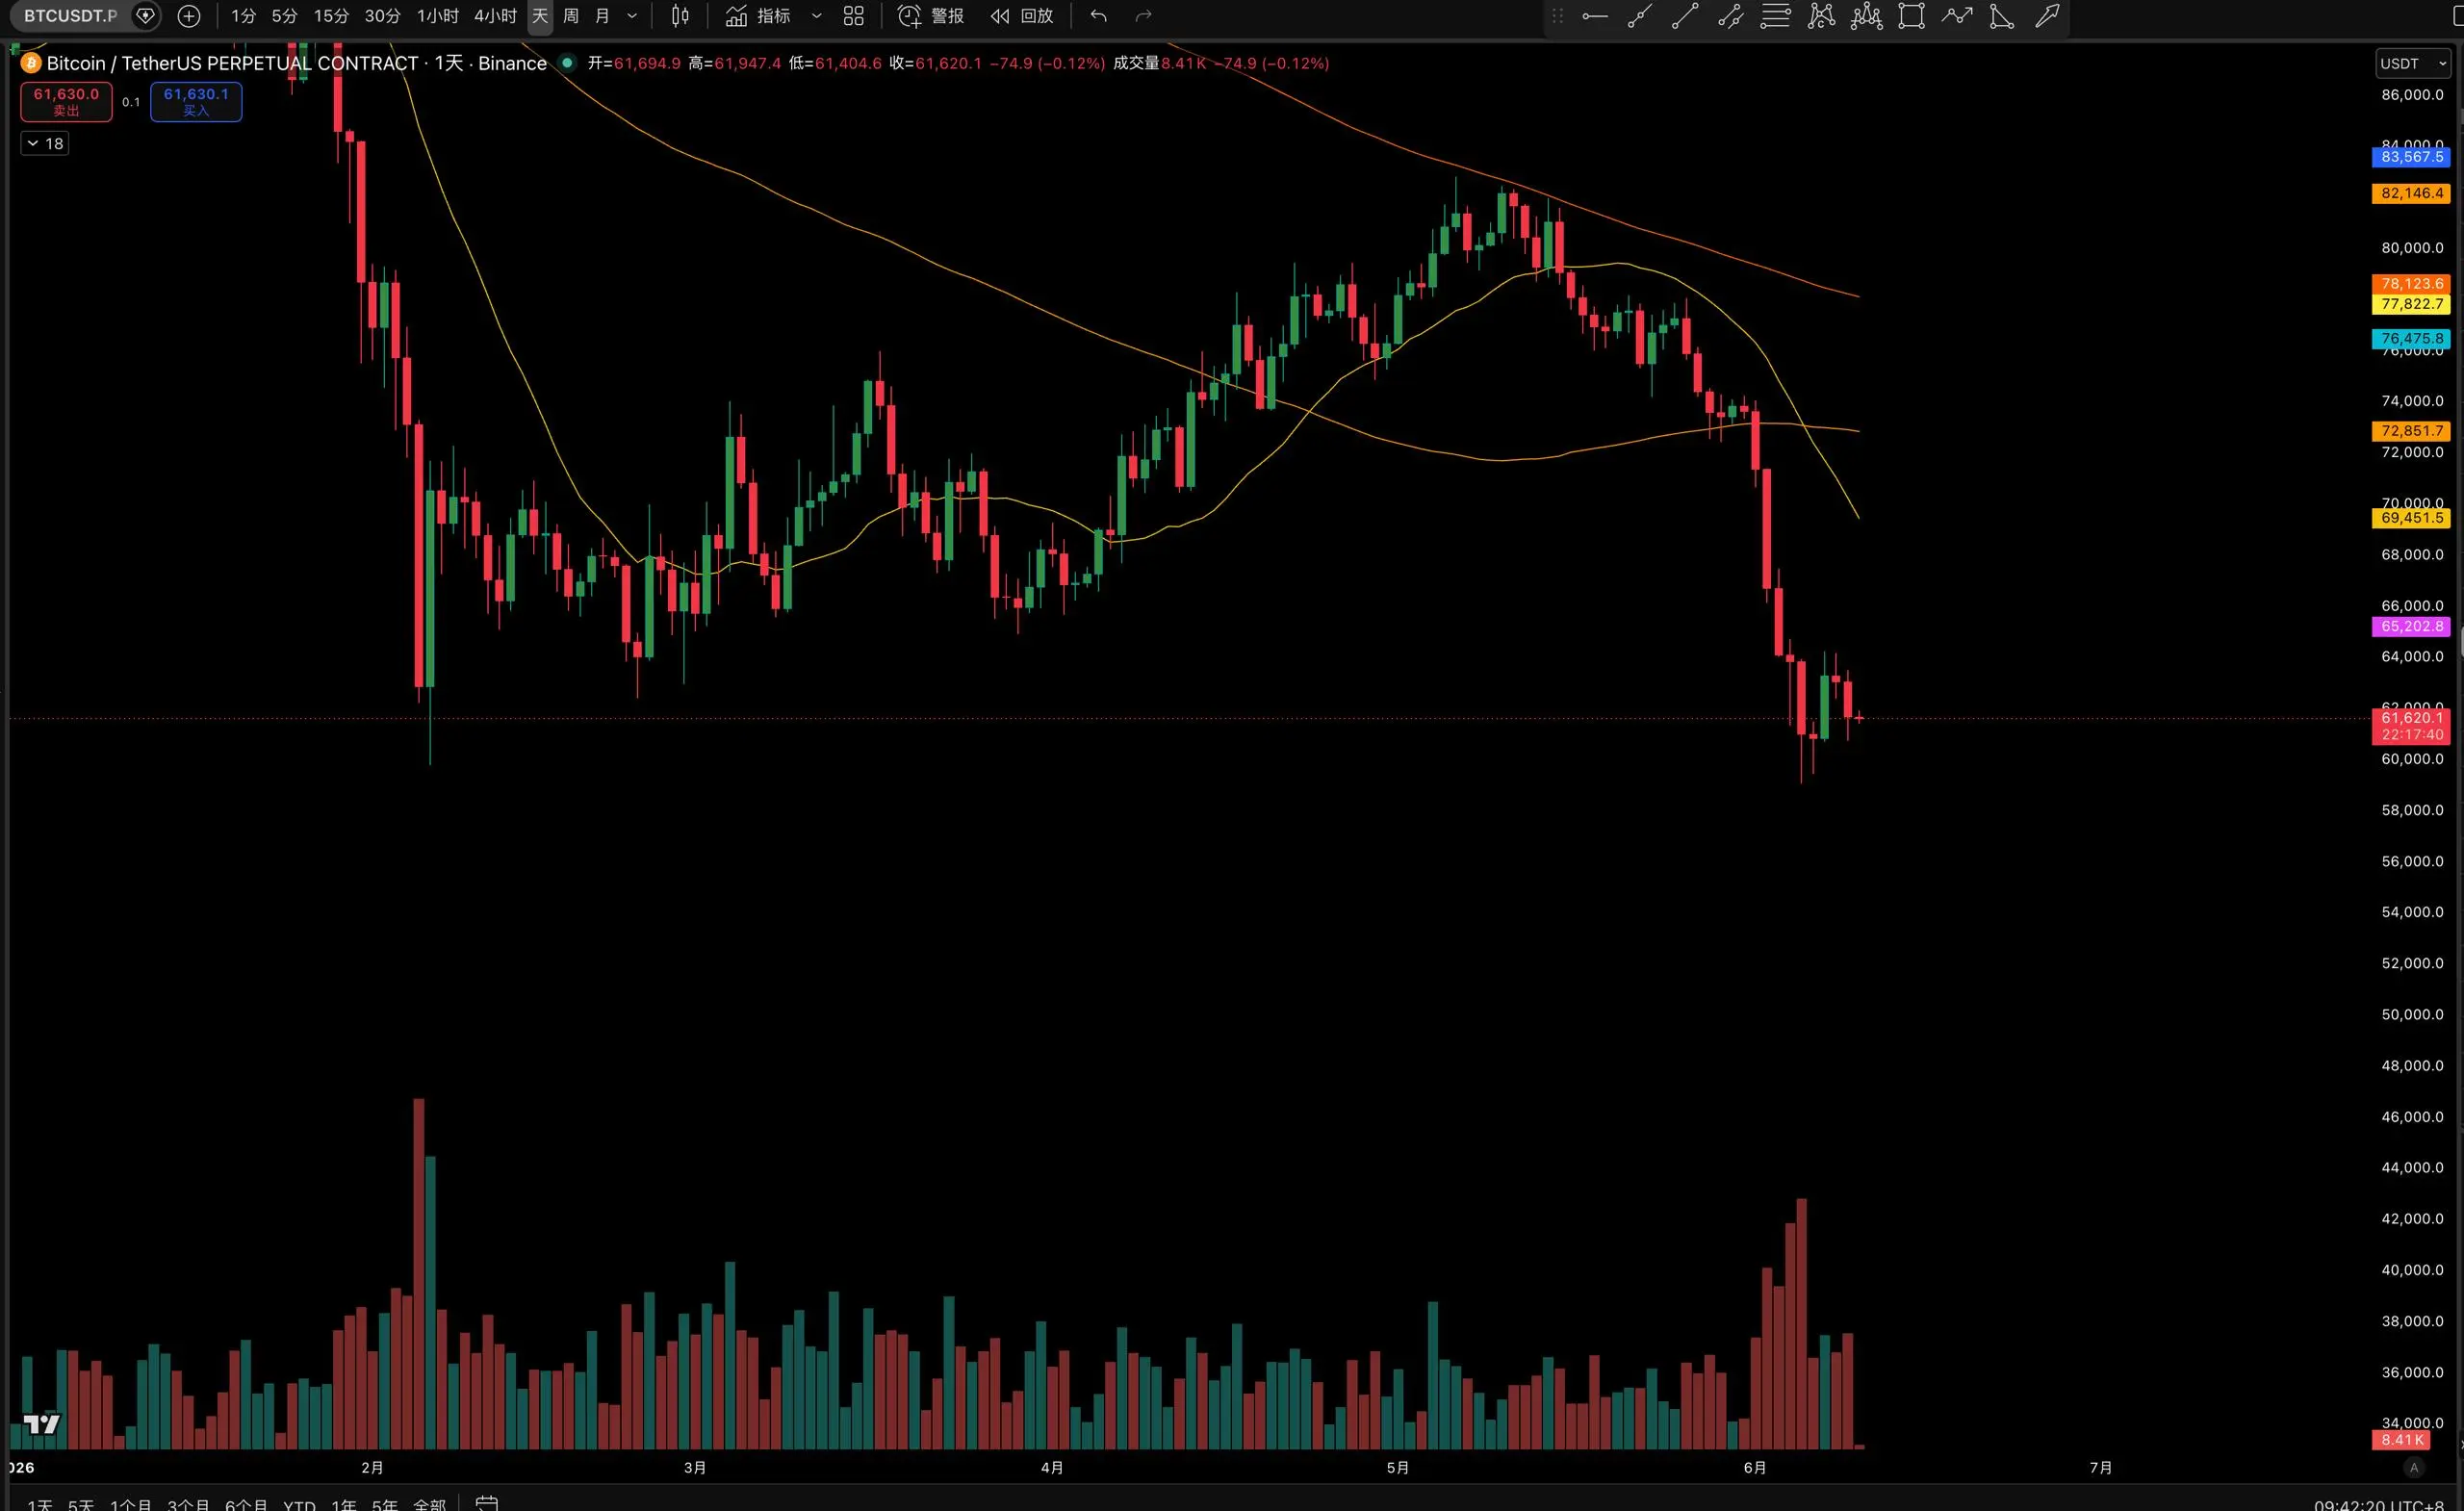
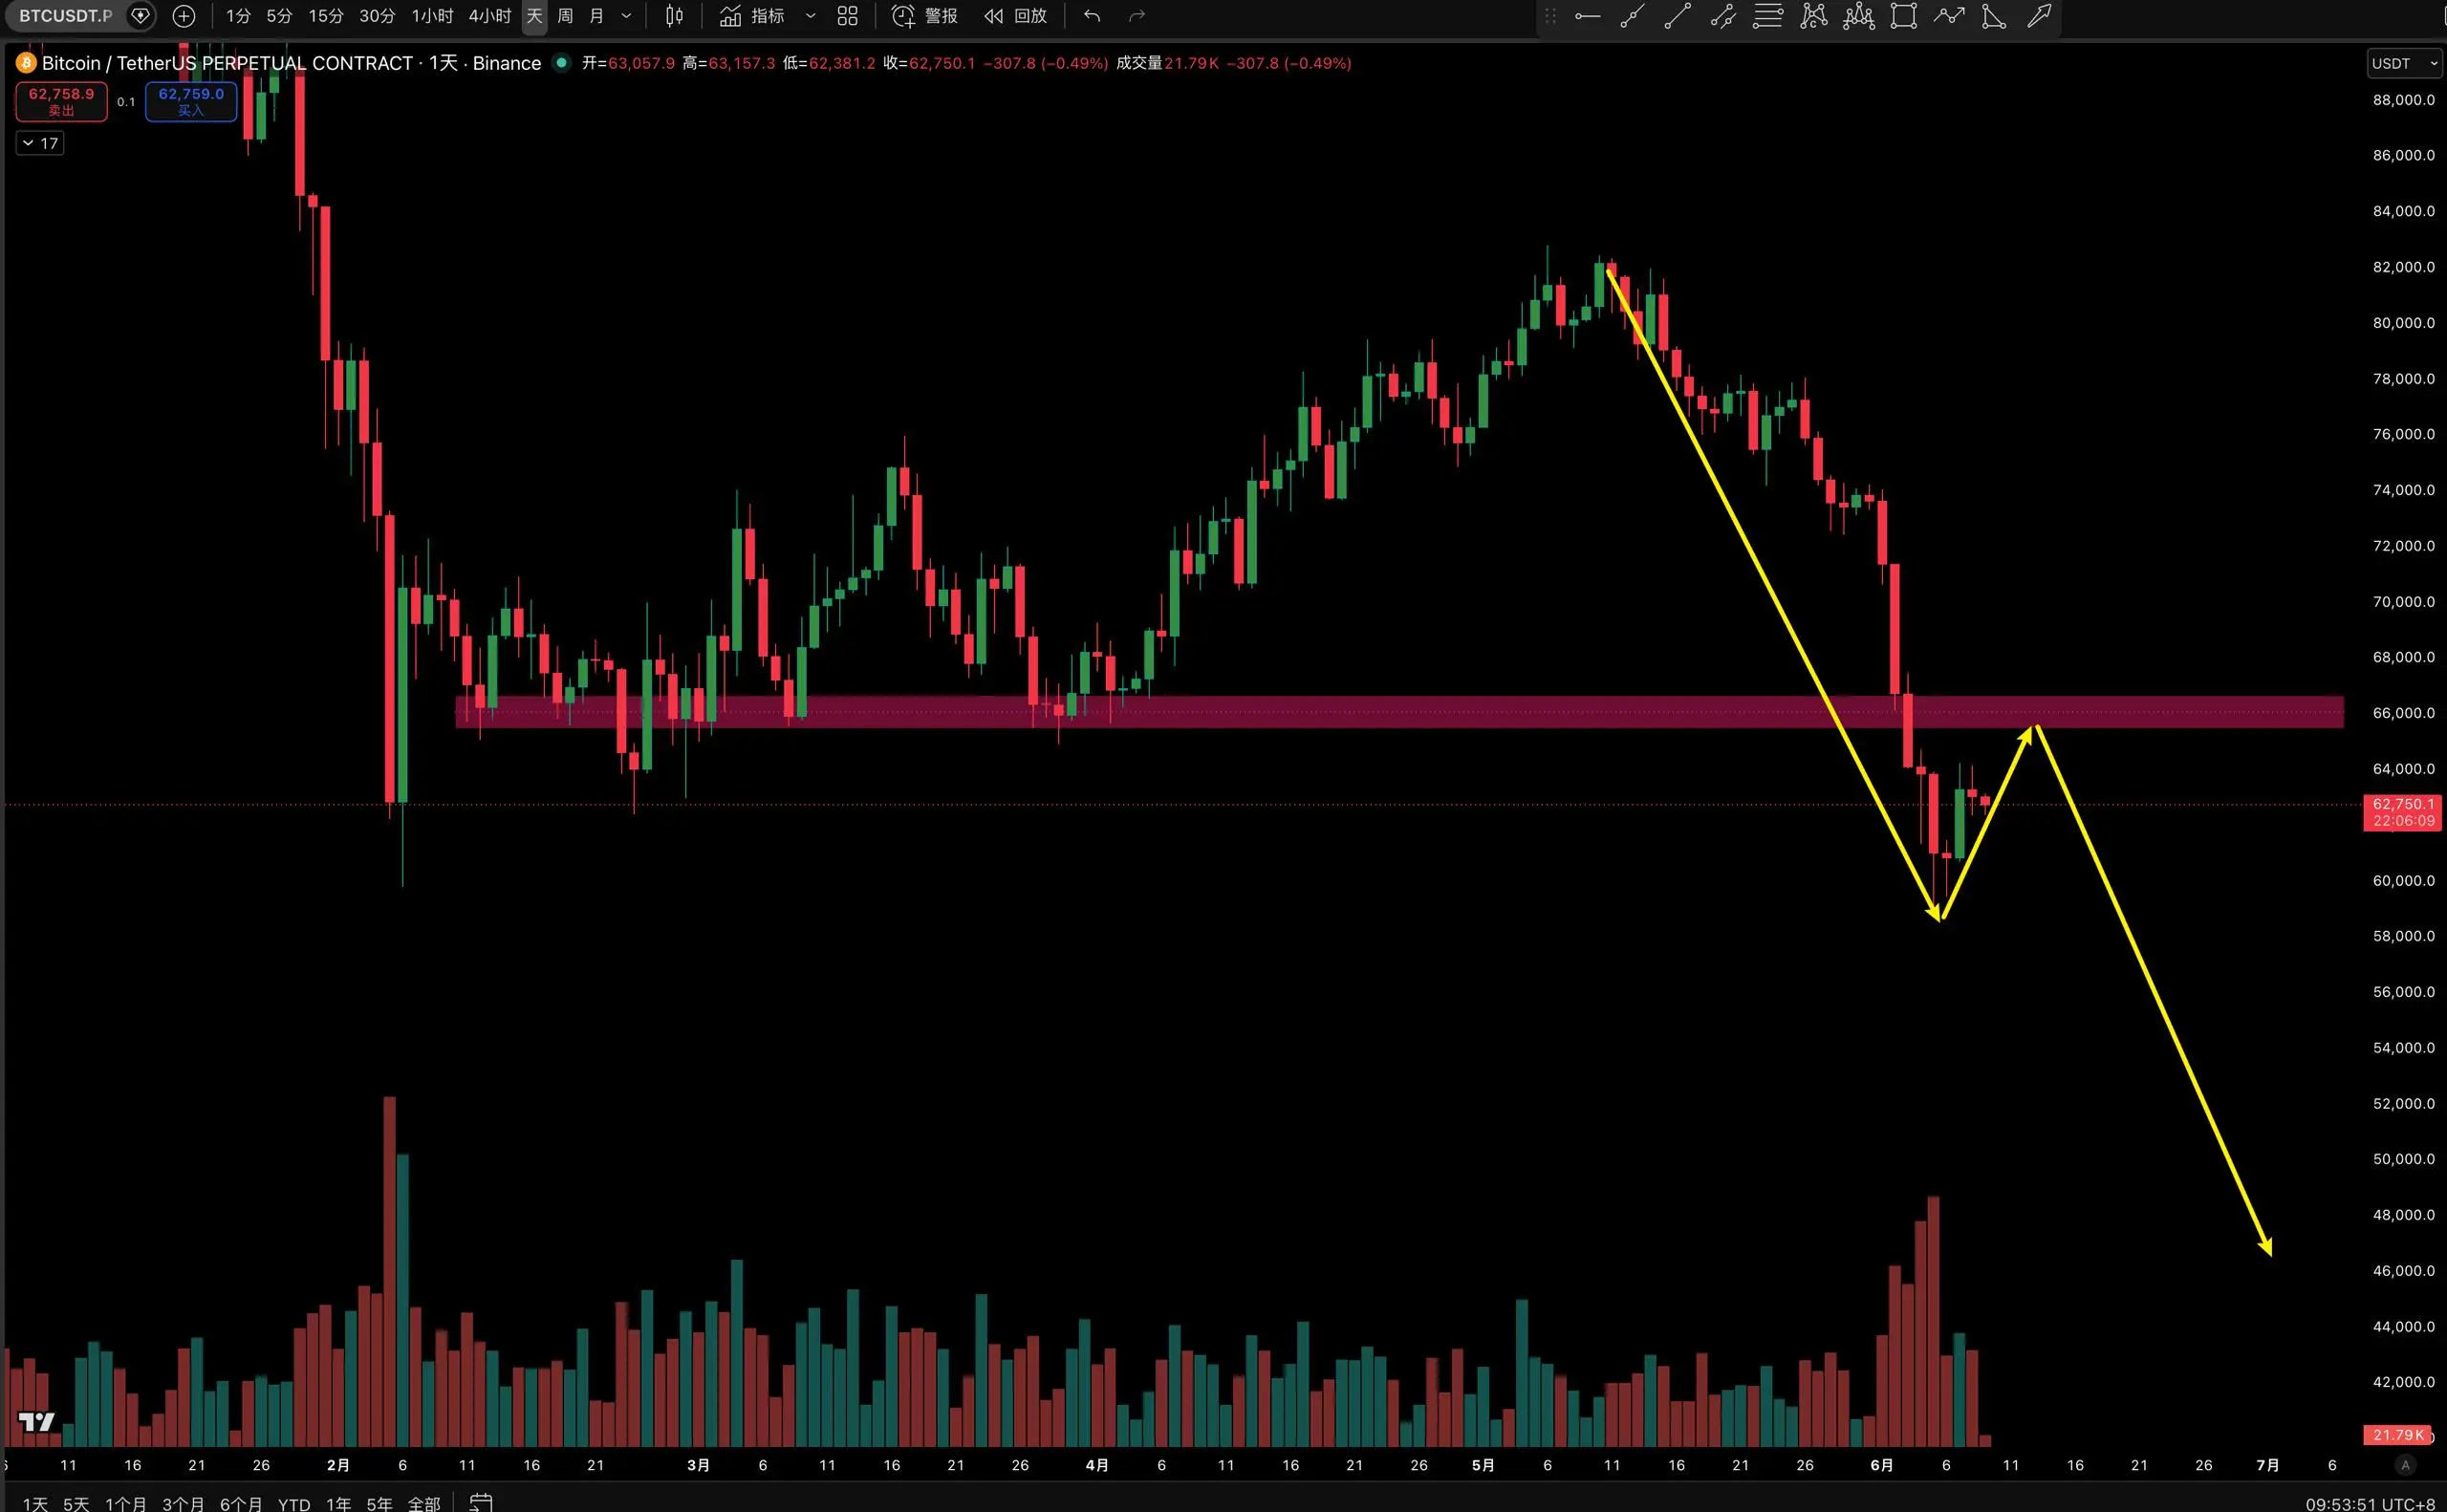
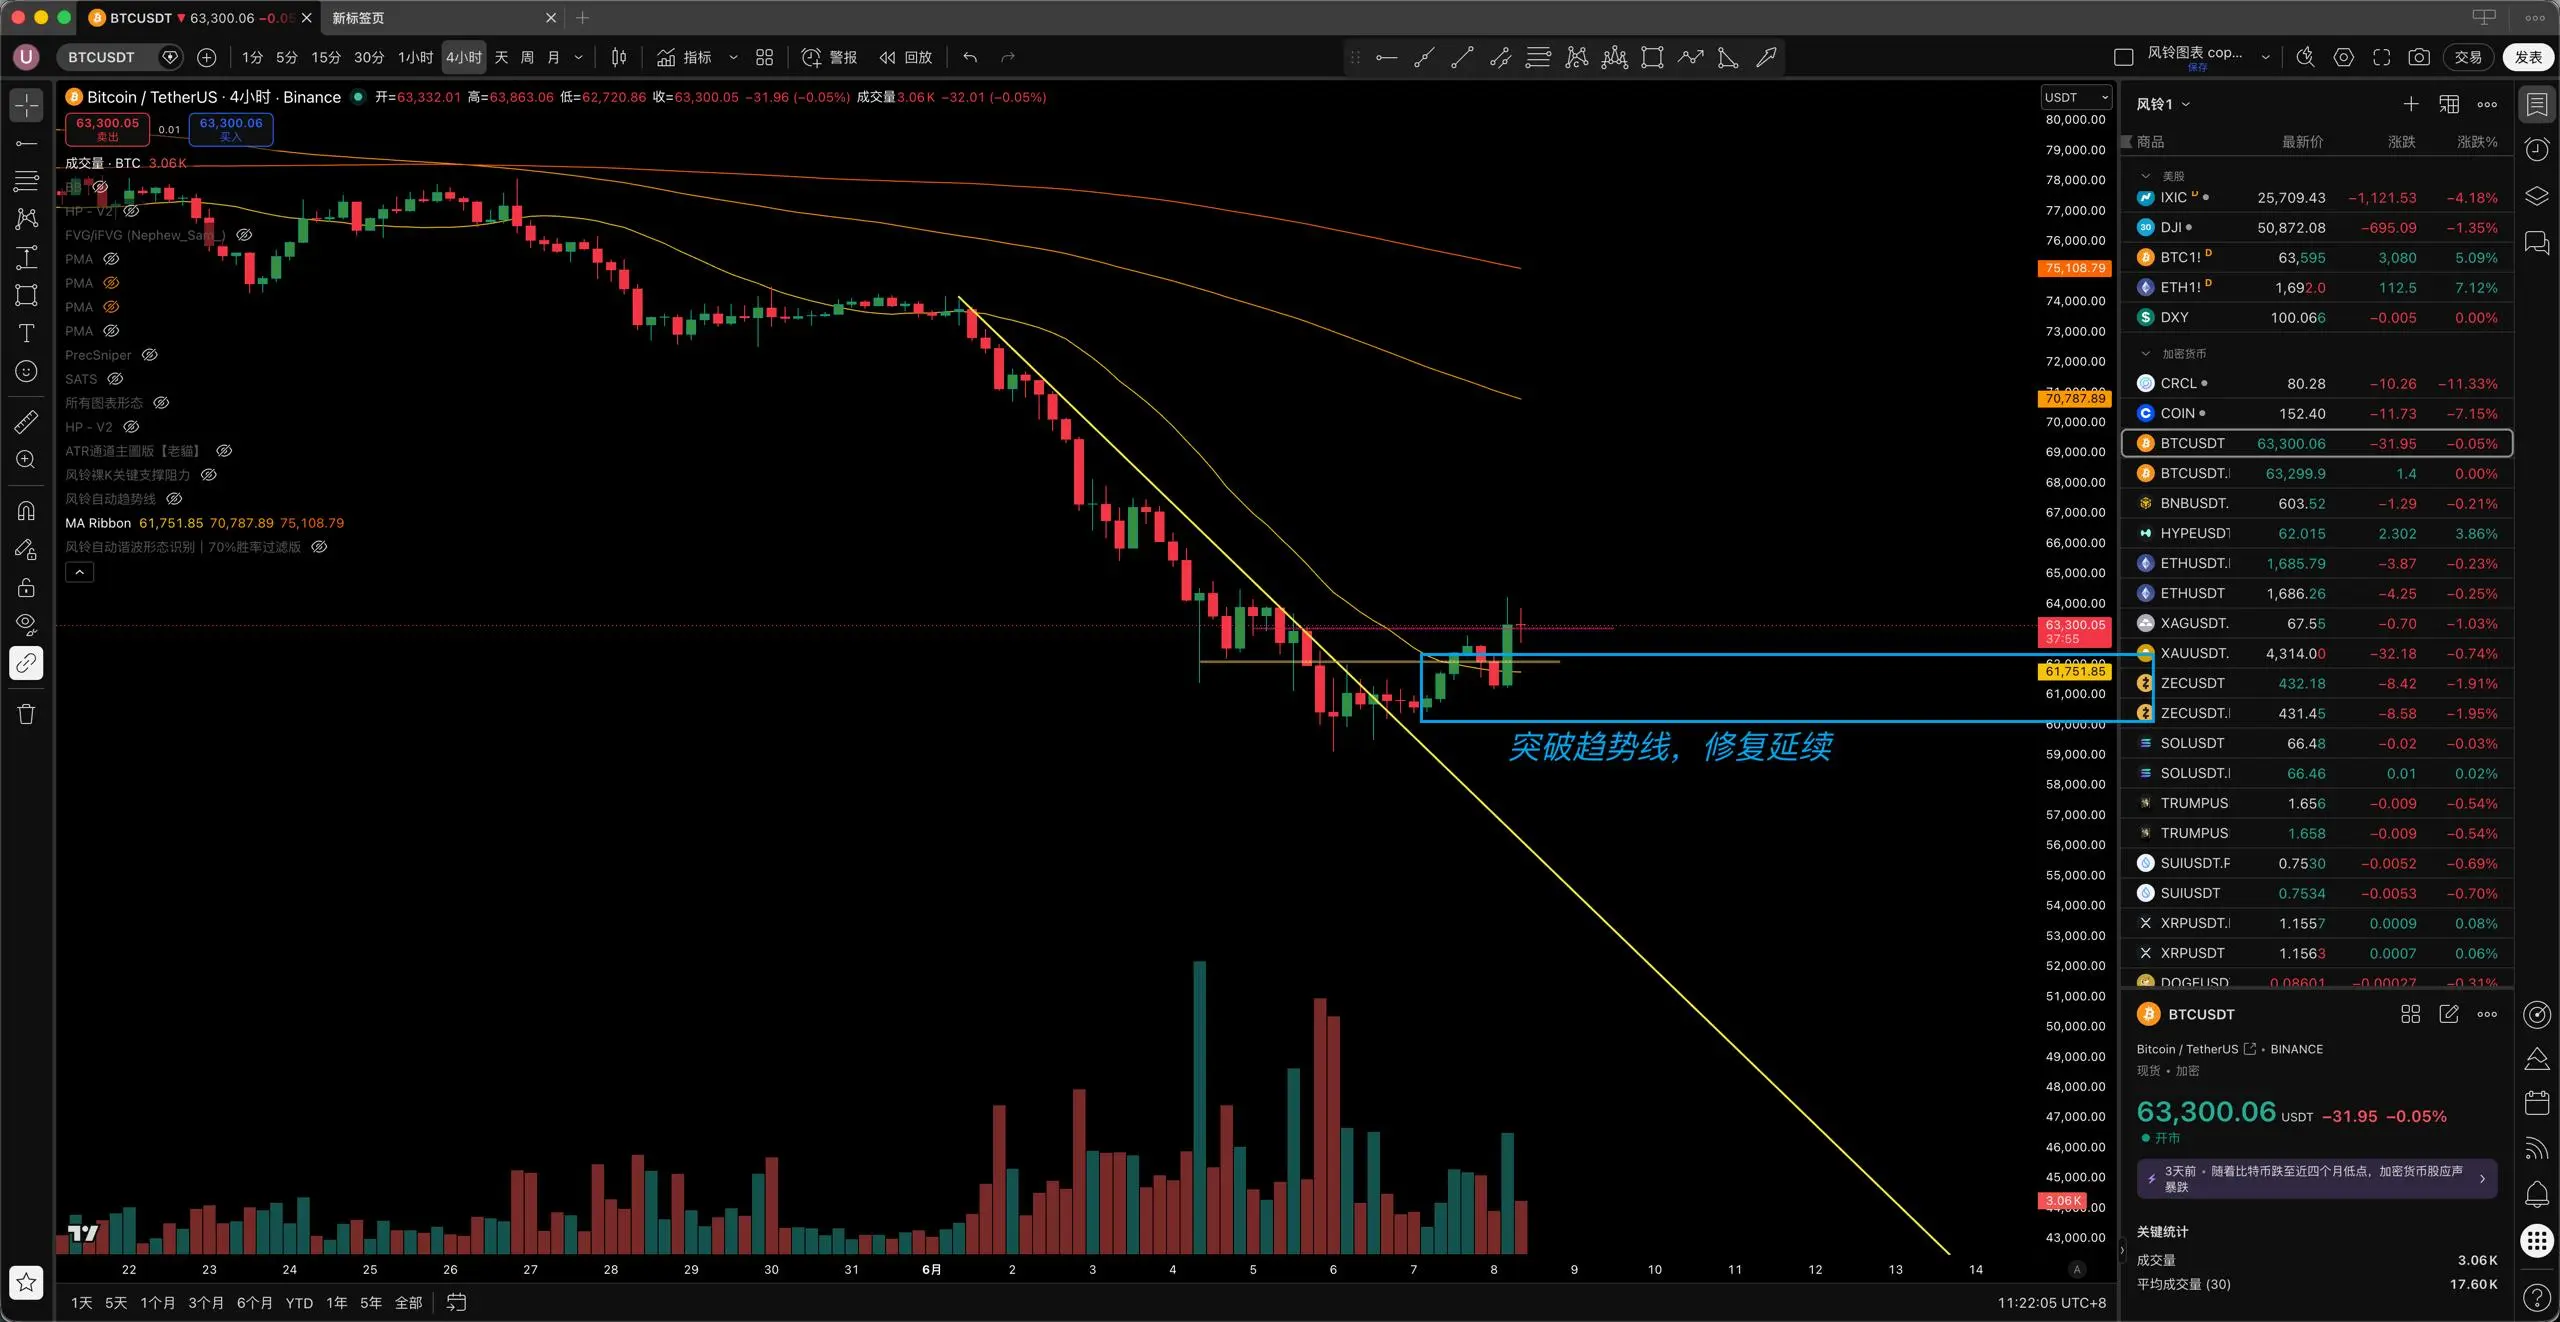
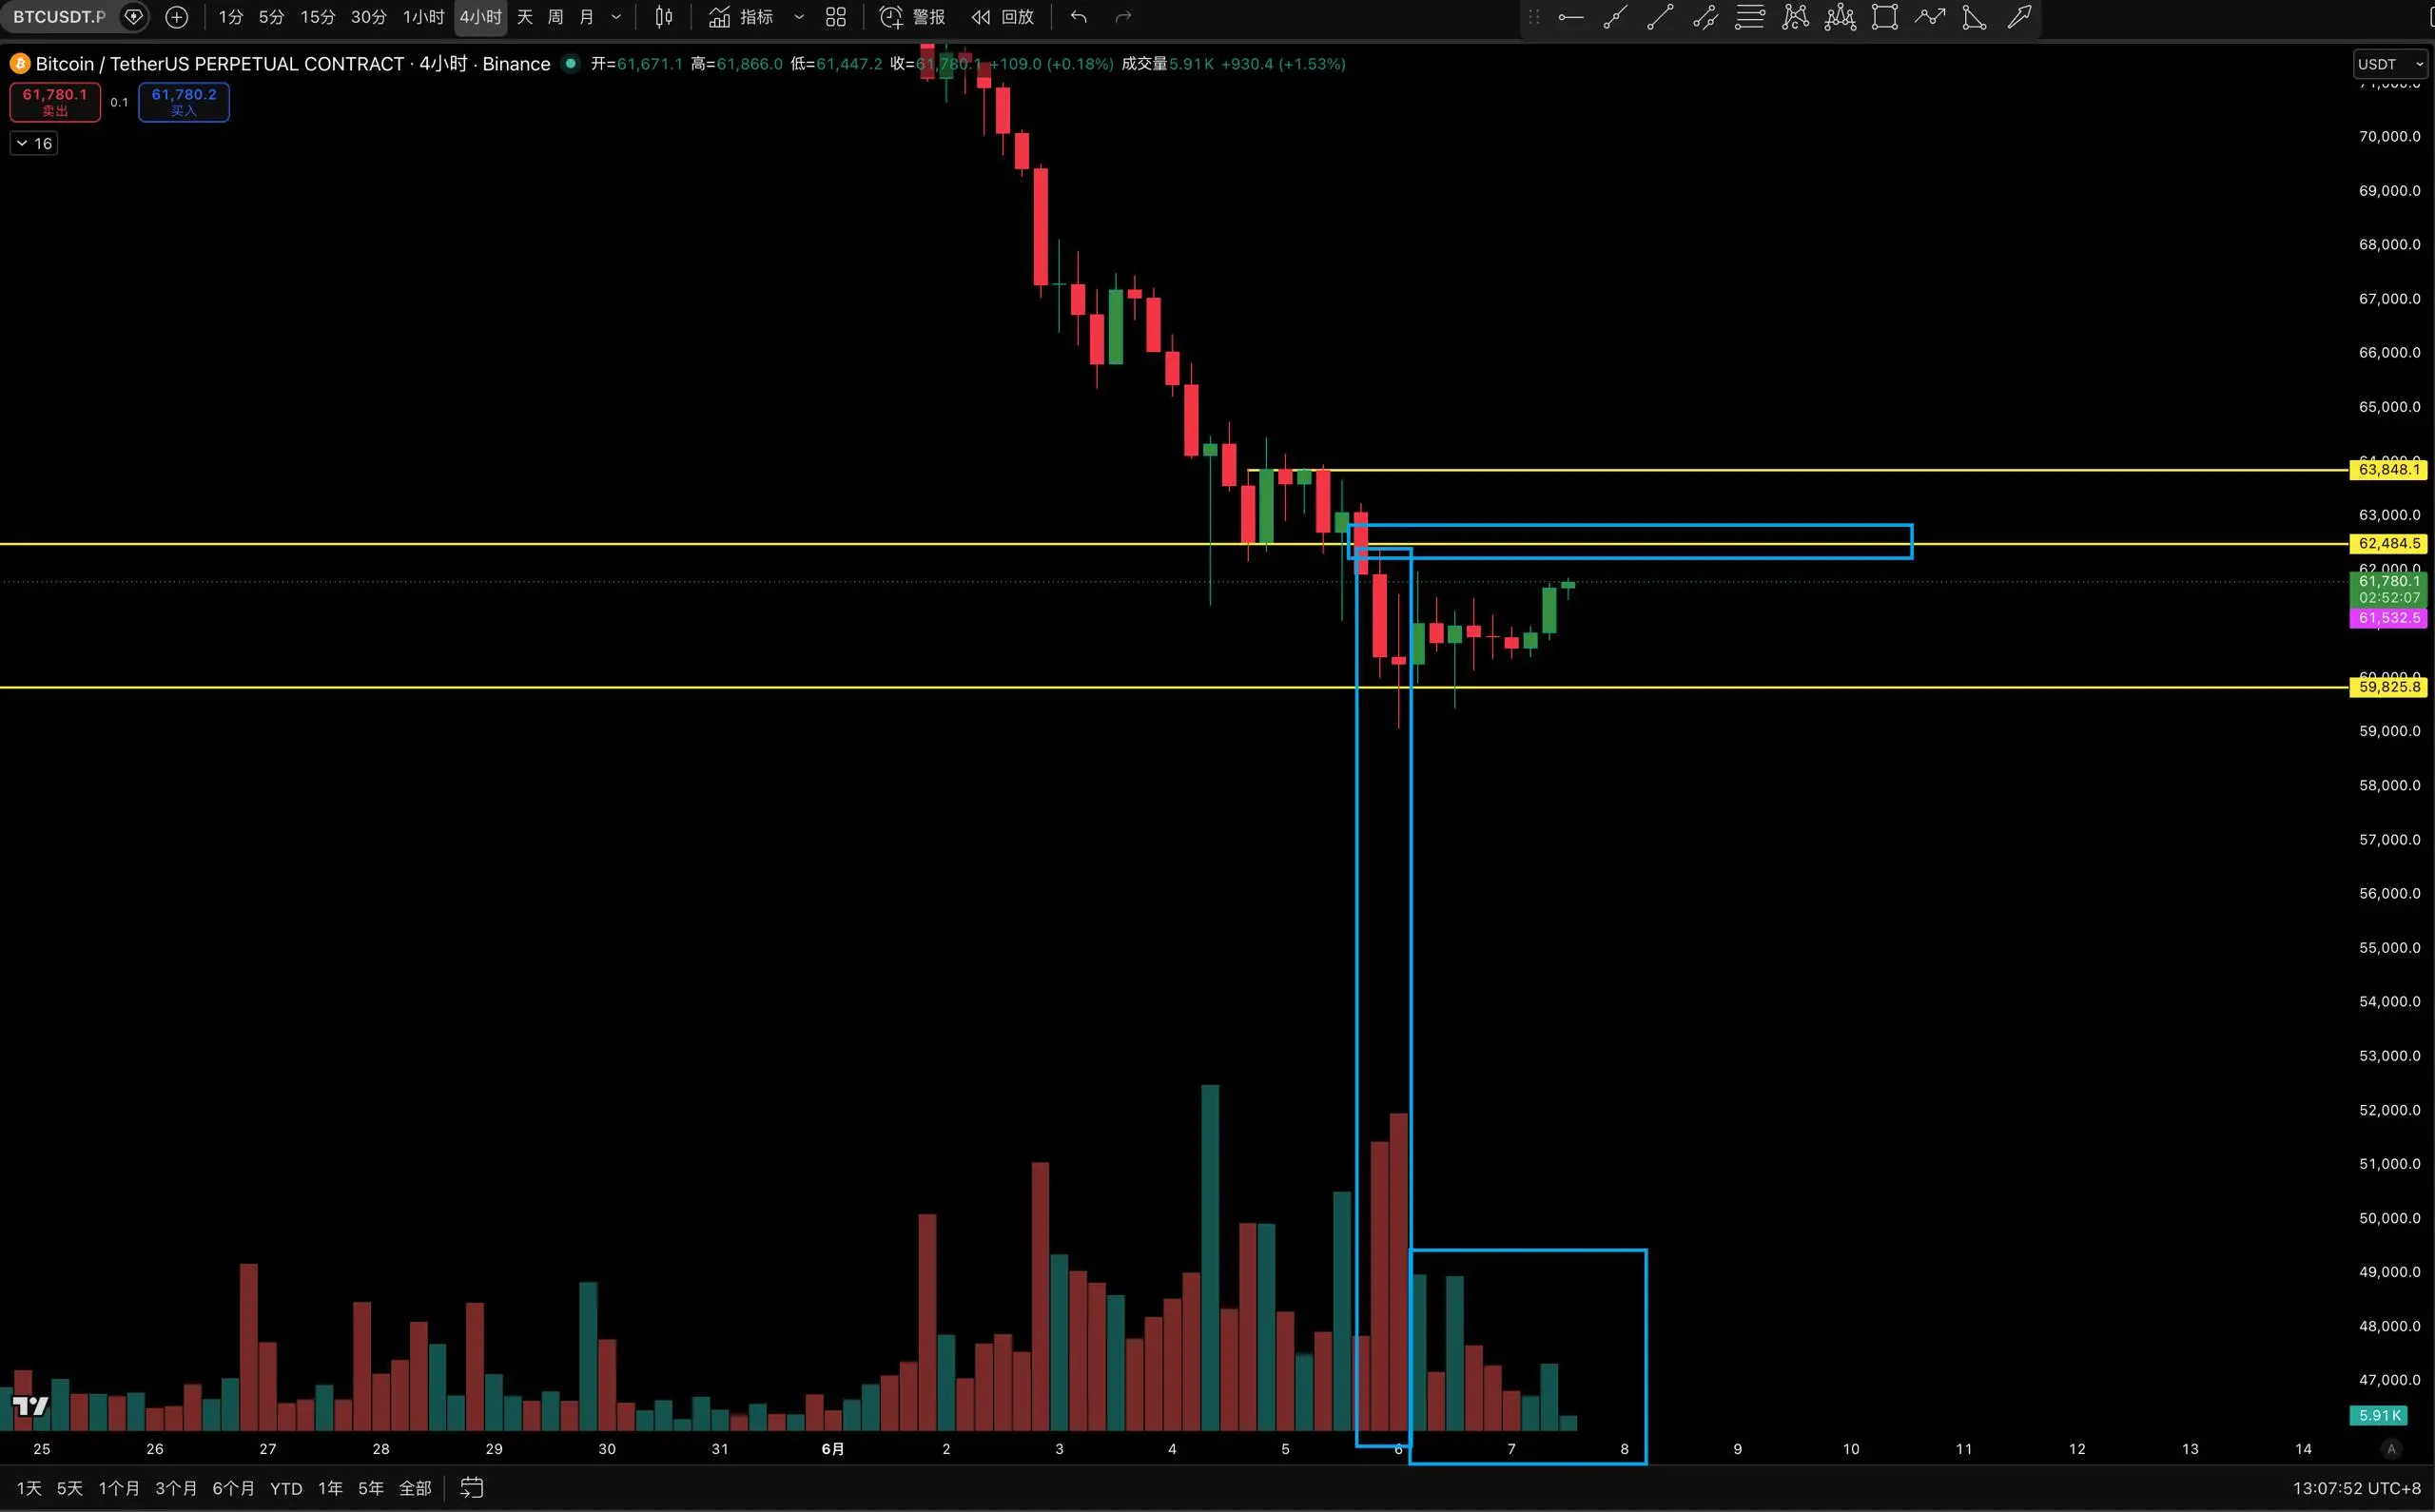
Yesterday early morning, Bitcoin hit a low of 59102, then rebounded slightly, retested the bottom, with support at the previous low. It is now back to 60834. Today it closed with a small bearish candle with a lower shadow and increased volume, which is a typical long squeeze pattern. The bearish trend remains unchanged, and a rectangular box structure has emerged.
Previously mentioned that the previous low of 60755 cannot be broken; if broken, it would trigger a cascading drop. Yesterday it broke and fell sharply. Although it recovered this morning at the close, the
View Original
post-image
post-image
  • Reward
  • Comment
  • Repost
  • Share
⭐ BTC Today's Market Update
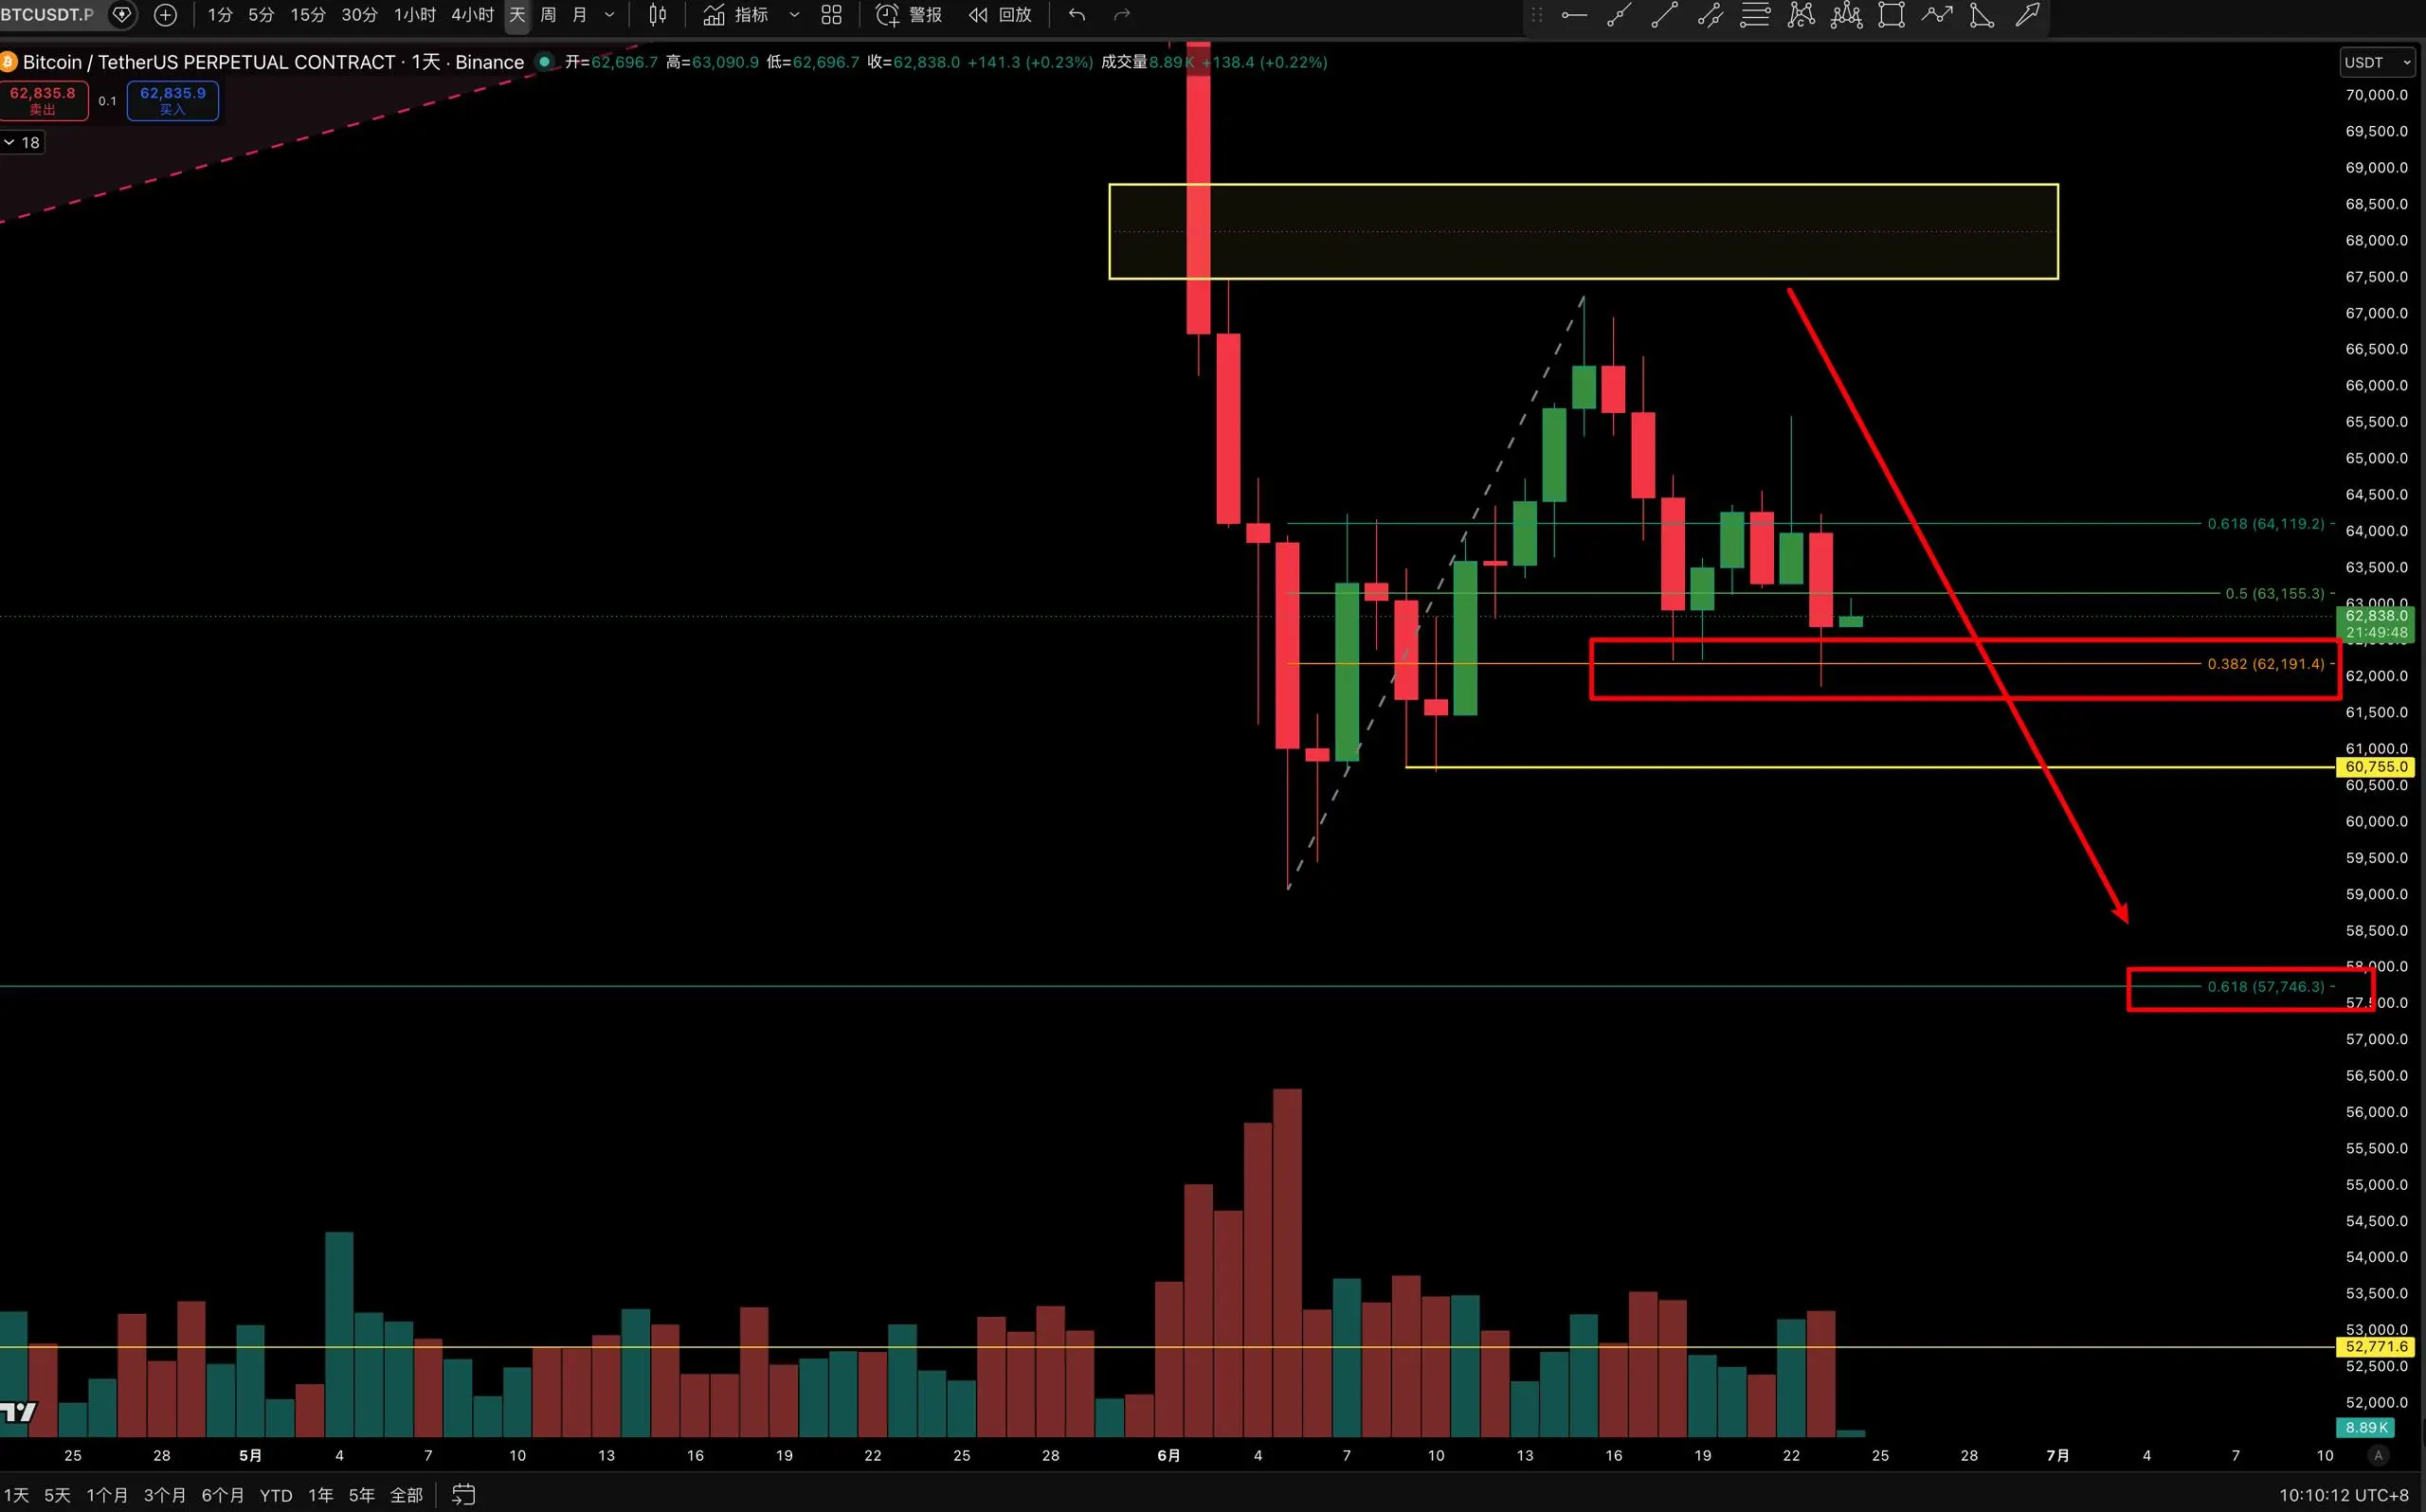
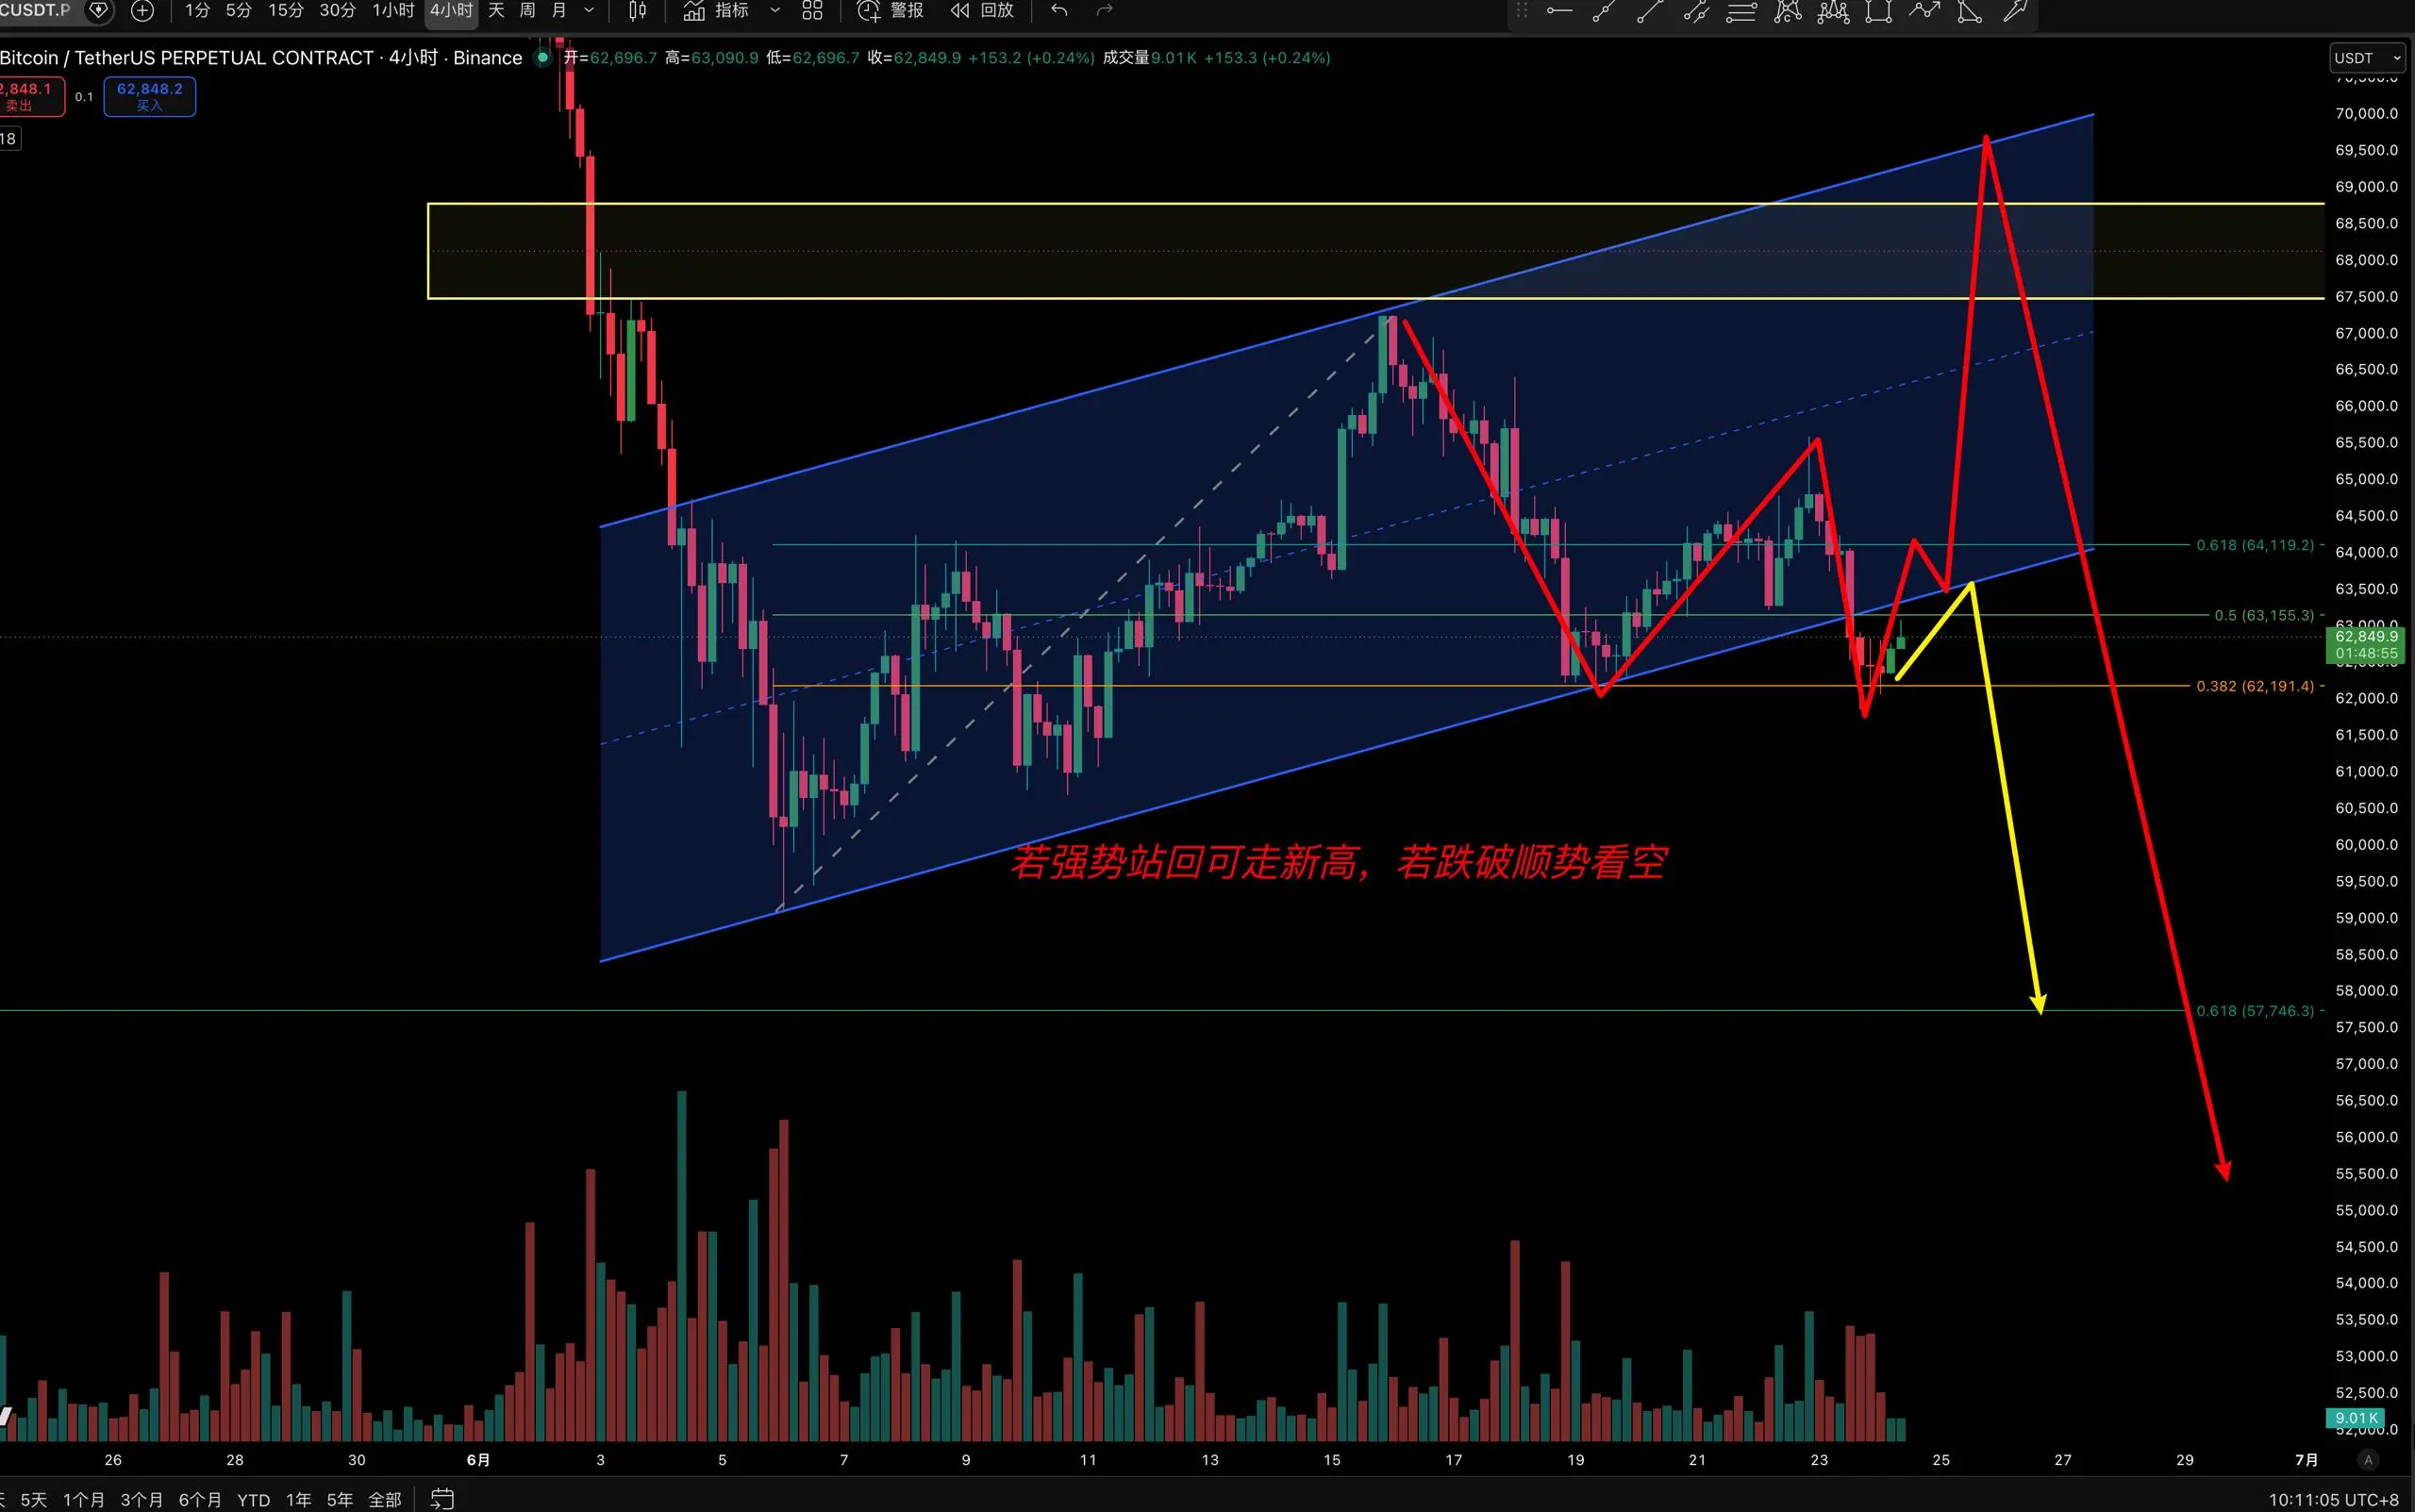
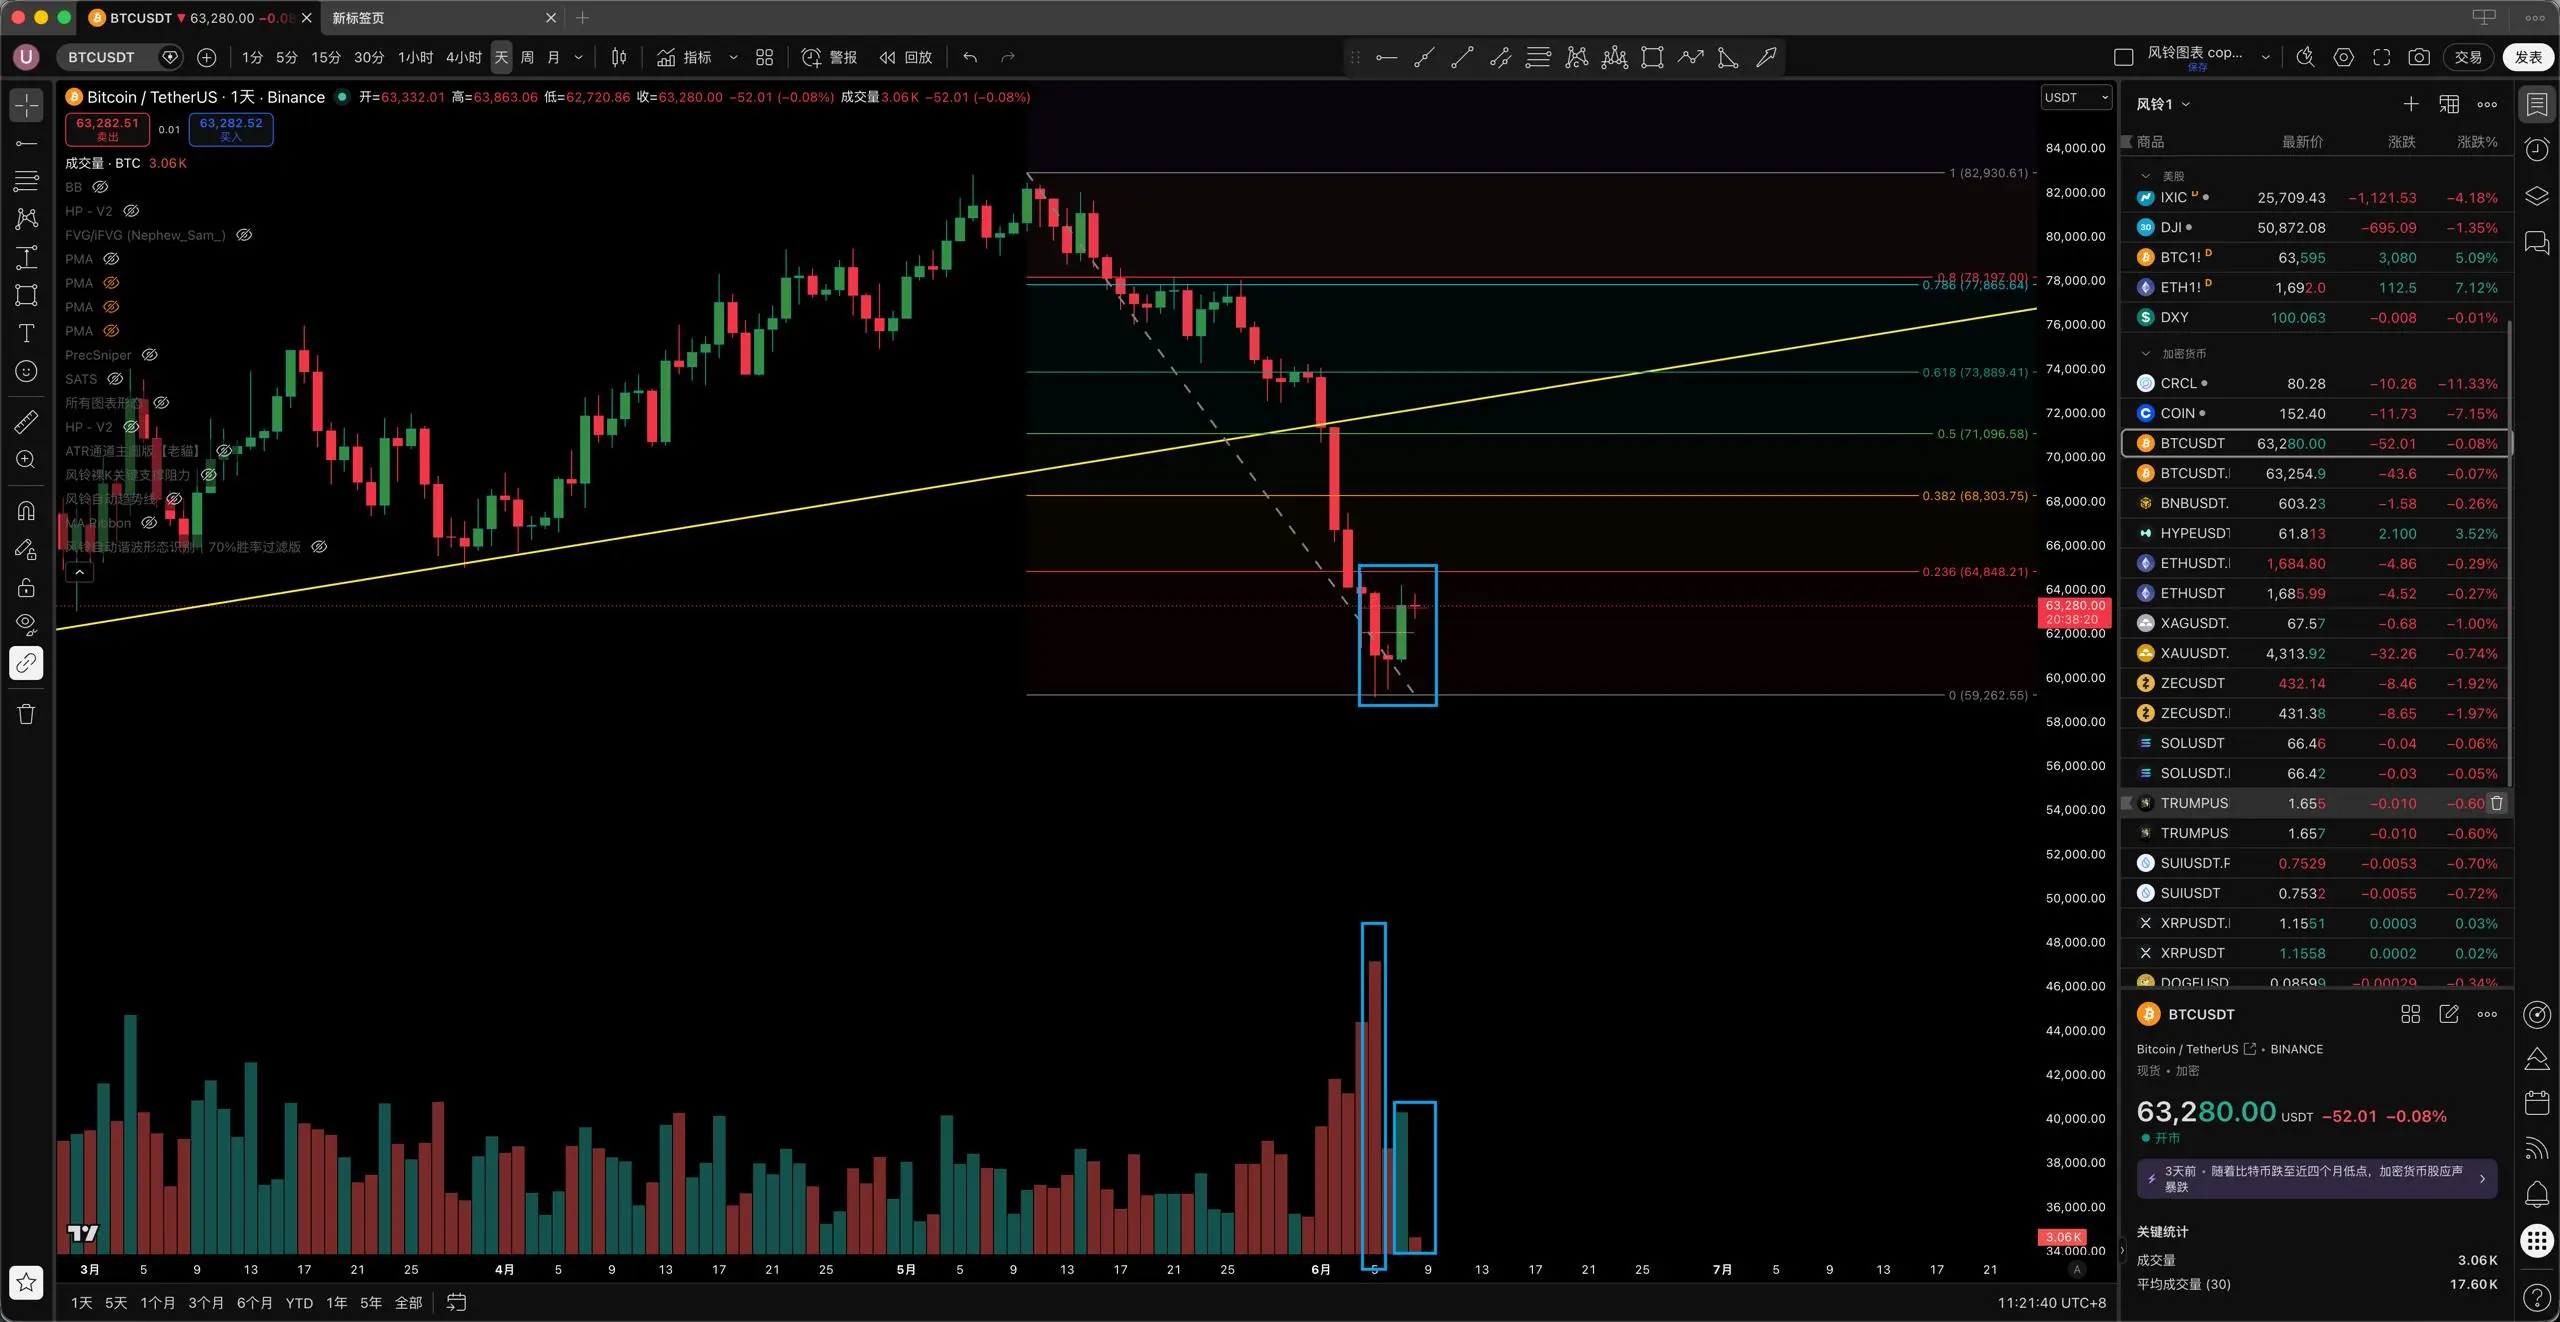
Bitcoin daily chart closes bearish, and the price breaks below the 0.5 Fibonacci support with increased volume, indicating short-term weakness. However, this morning's close is above 62,200, meaning that although the short-term trend is weak, it hasn't completely collapsed. Today’s key level is 63,200; if it can hold above, there is still potential for a rebound. If it strongly recovers back above 63,700, there’s a chance to challenge the high of >67,200. But if it drops below 60,755 today, then 67,200 becomes the top of this wave, and the market will start lookin
BTC2.27%
View Original
post-image
post-image
post-image
  • Reward
  • Comment
  • Repost
  • Share
⭐ BTC Today's Market Update
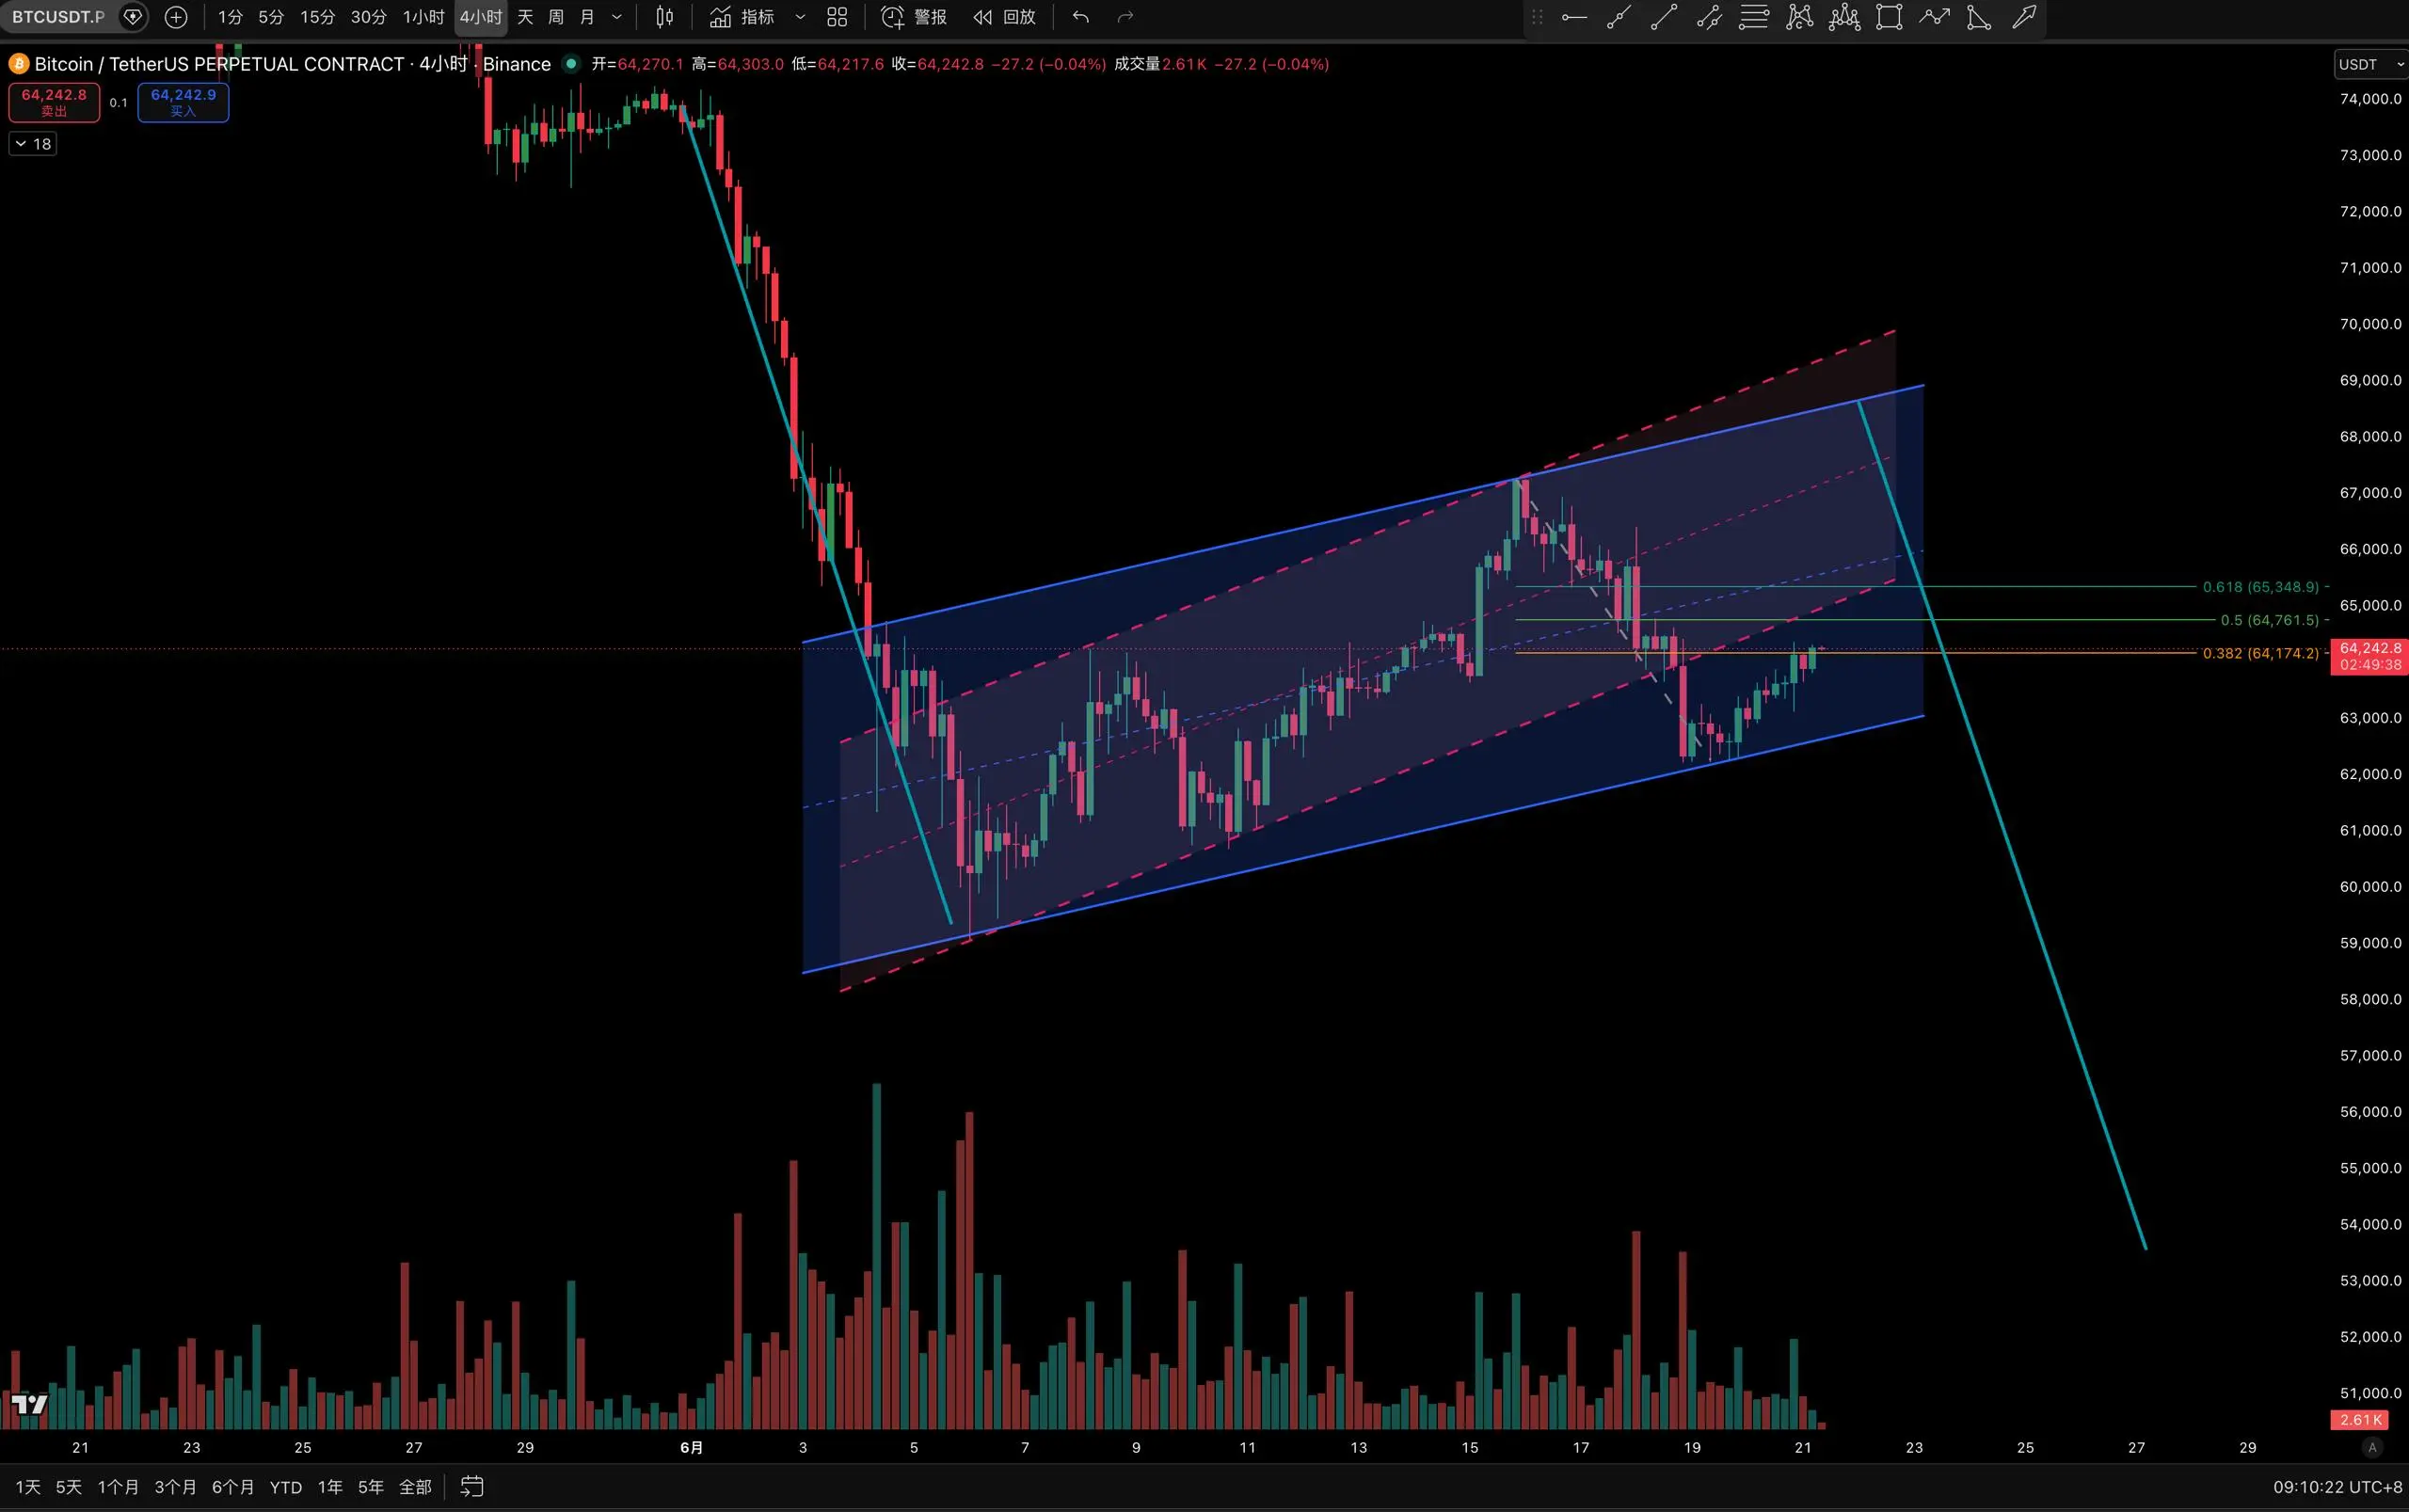
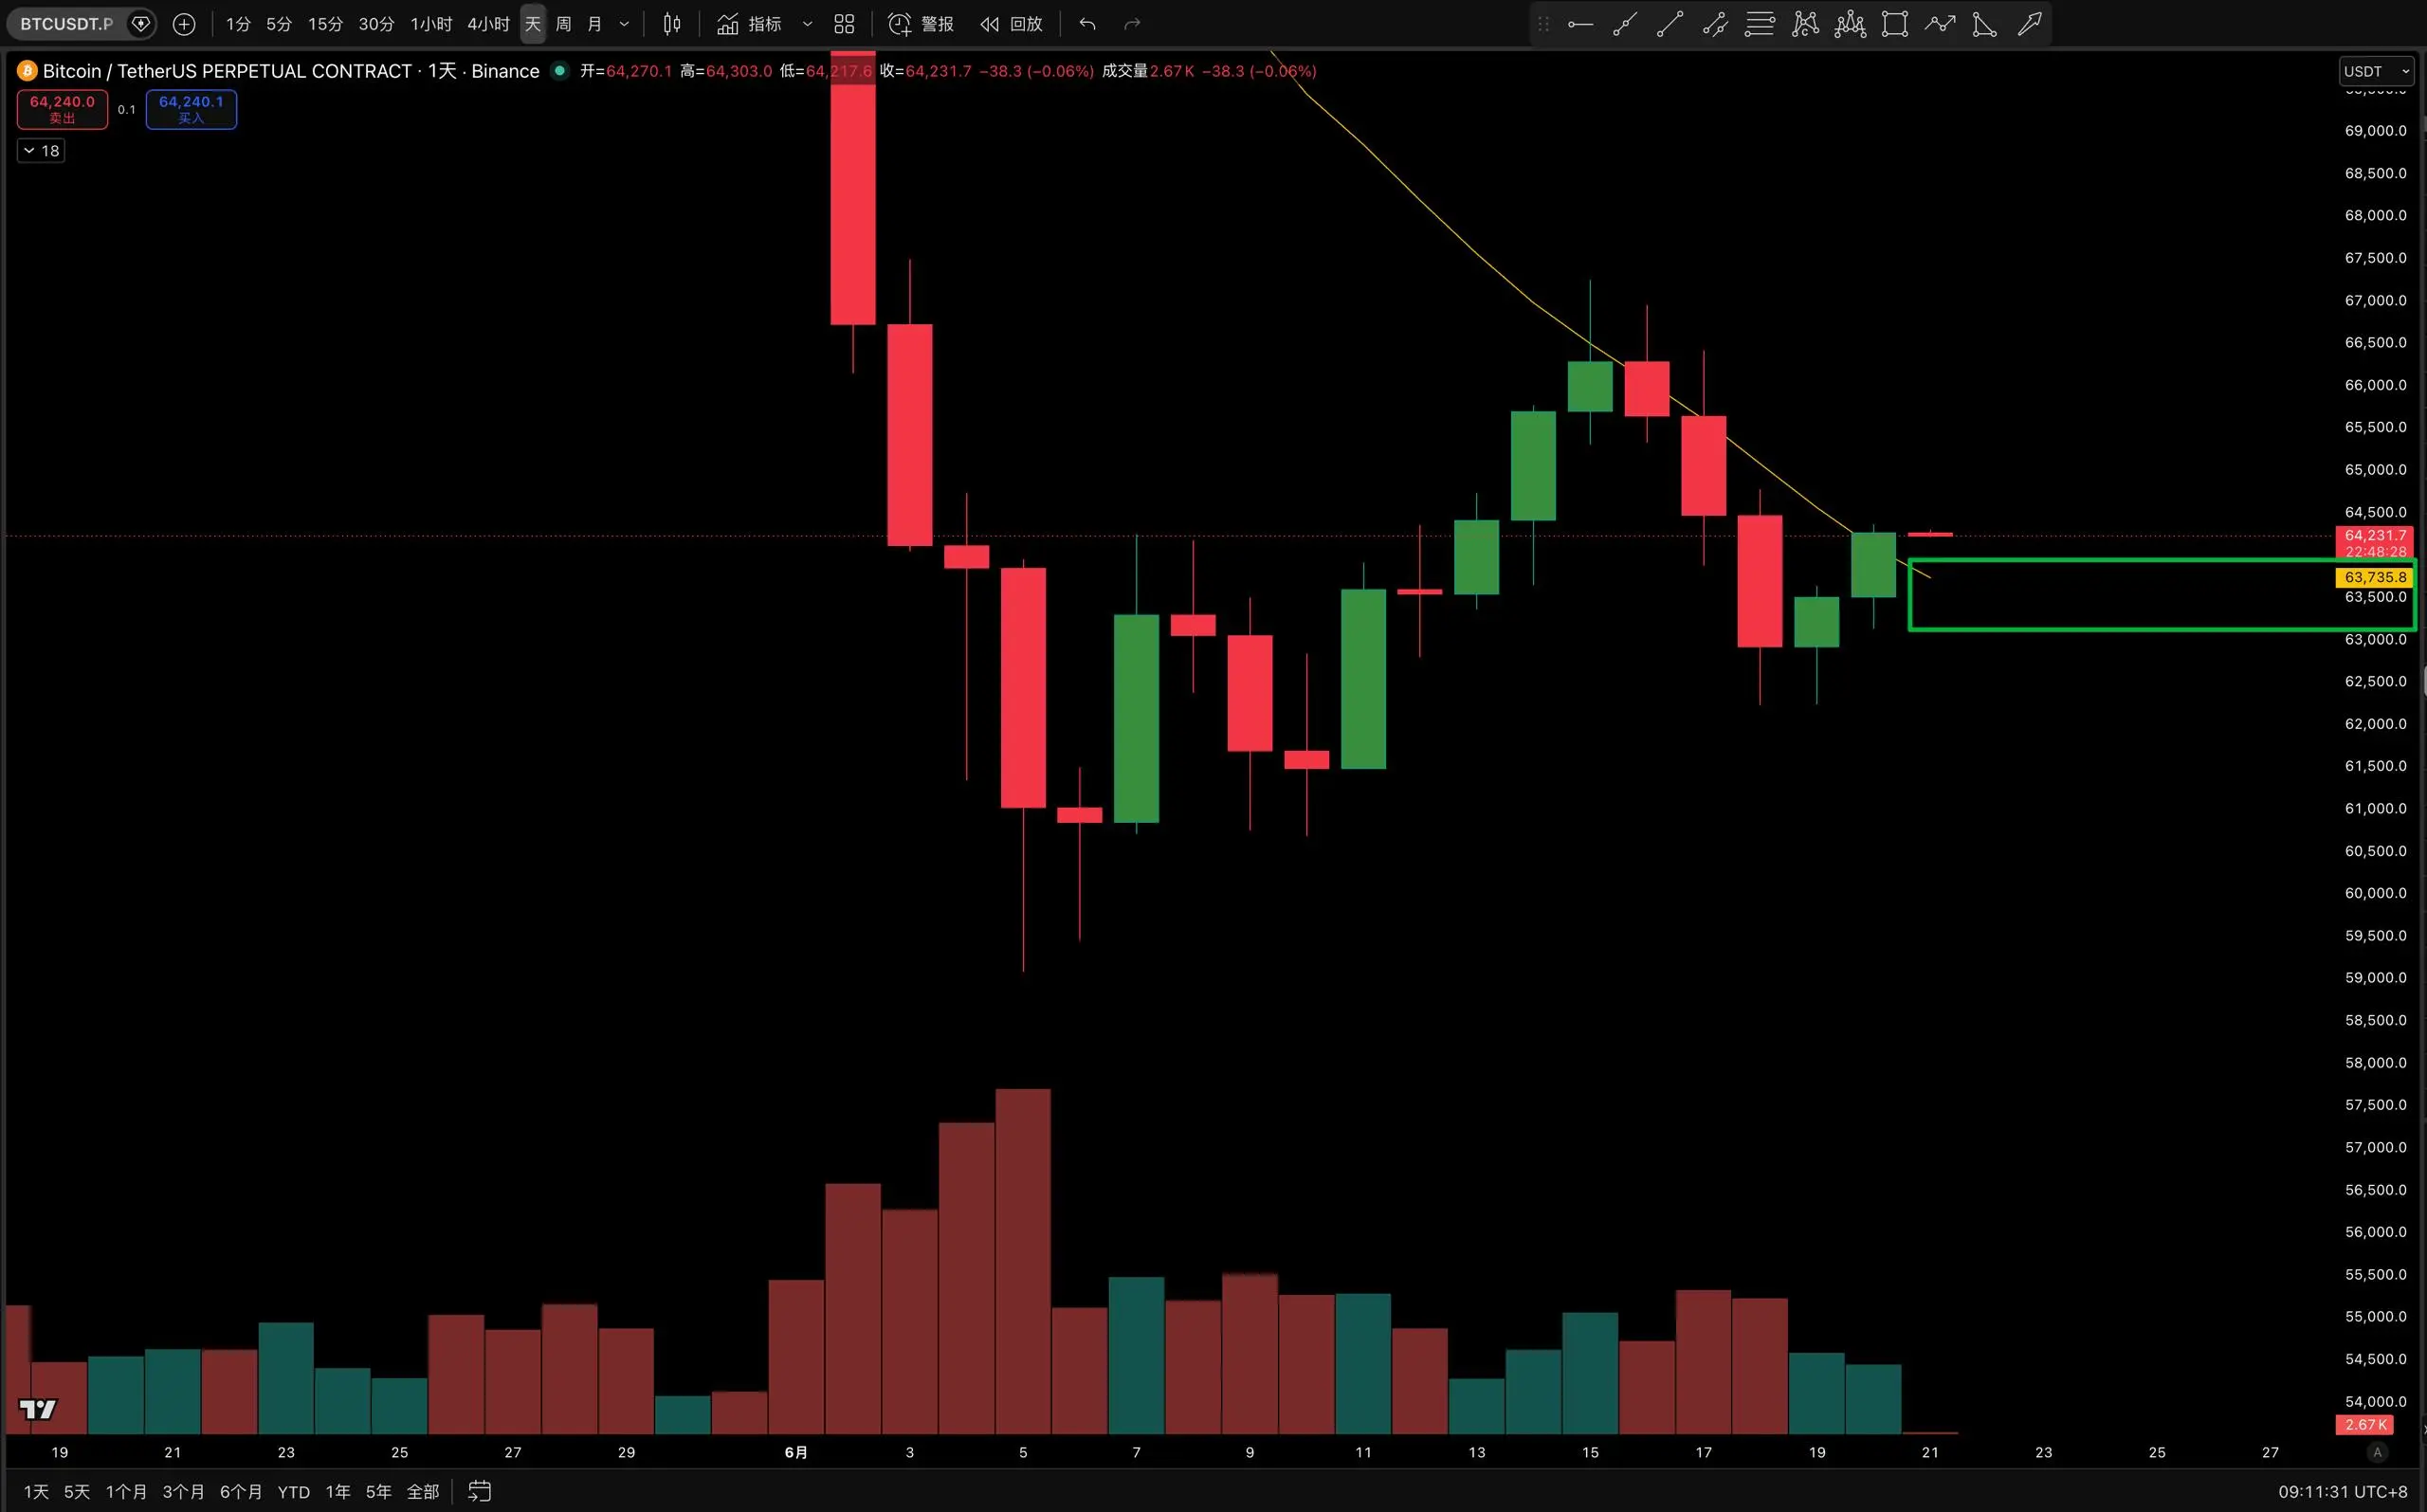
Yesterday, we mentioned that Bitcoin found support around 63k and entered a consolidation correction, with the core idea being to wait for a pullback to confirm a low-buying opportunity.
The previous day, the price tested support near 63,800 and rebounded to 65,400 before pulling back, and this morning's close was below 64,200. Overall, it is in a tug-of-war between bulls and bears.
Although the daily chart remains in a downtrend, the MA20 has started to flatten, and the price has risen above this moving average, which is a short-term sign of a trend reversal.
BTC2.27%
View Original
post-image
post-image
  • Reward
  • Comment
  • Repost
  • Share
⭐ BTC Today’s Market Update
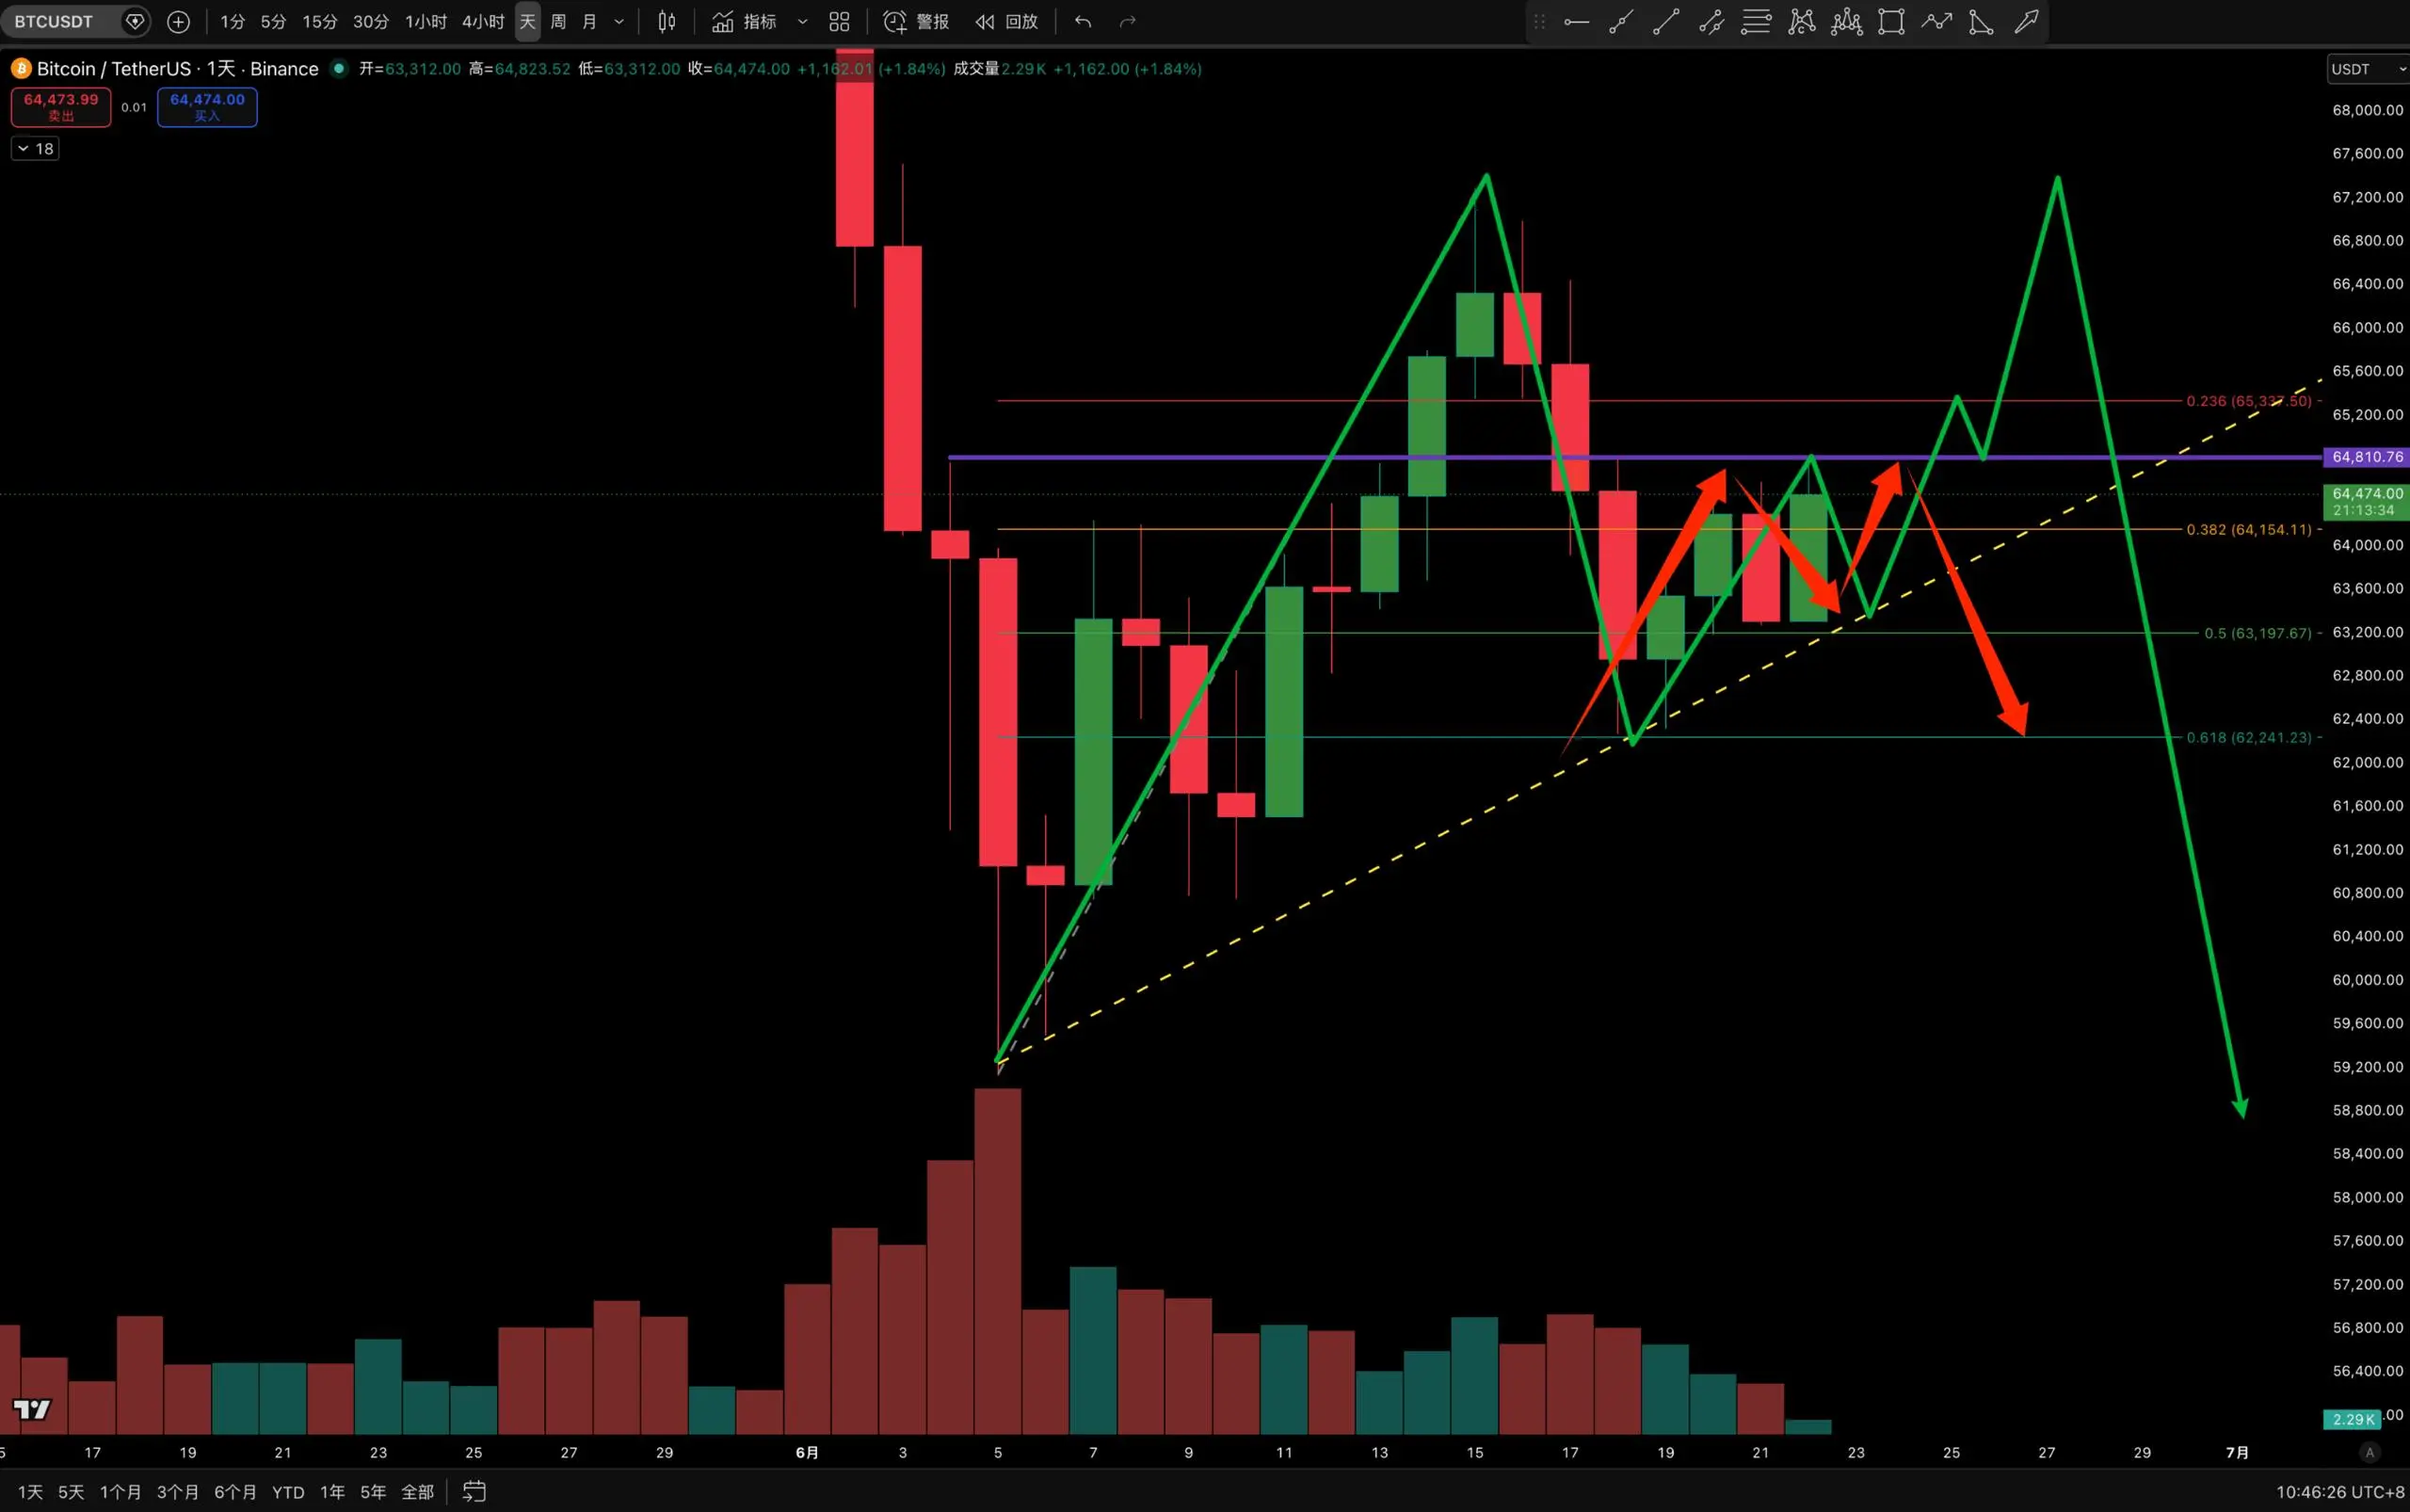
As we mentioned yesterday, the short-term outlook is bullish, with a focus on buying dips. Early this morning, due to tensions related to US-Iran negotiations, BTC briefly fell below 64,000, hitting a low of 63,312. After that, Iran released a favorable signal indicating that the blockade would be lifted and that some frozen assets would be released. Bitcoin immediately began to rebound, with the rebound reaching the pressure level of 64,800 that we mentioned, and it is currently testing that level.
On the weekly structure, the cumulative decline in June is nearing
BTC2.27%
View Original
post-image
  • Reward
  • Comment
  • Repost
  • Share
⭐ BTC Today's Market Update
Bitcoin shows signs of stabilization on the daily chart, with bulls attempting to digest previous selling pressure.
From a fundamental perspective, long-term holders' positions have reached a new all-time high, and institutional buyers like Capital B and Franklin Templeton's increased holdings support long-term confidence, but short-term negative factors such as hawkish signals from the Federal Reserve and Bitdeer's liquidation still suppress market sentiment. The market remains in a stalemate between bulls and bears.
On the daily chart, the current price of 64,
BTC2.27%
View Original
post-image
post-image
  • Reward
  • Comment
  • Repost
  • Share
⭐ BTC Today's Market Update
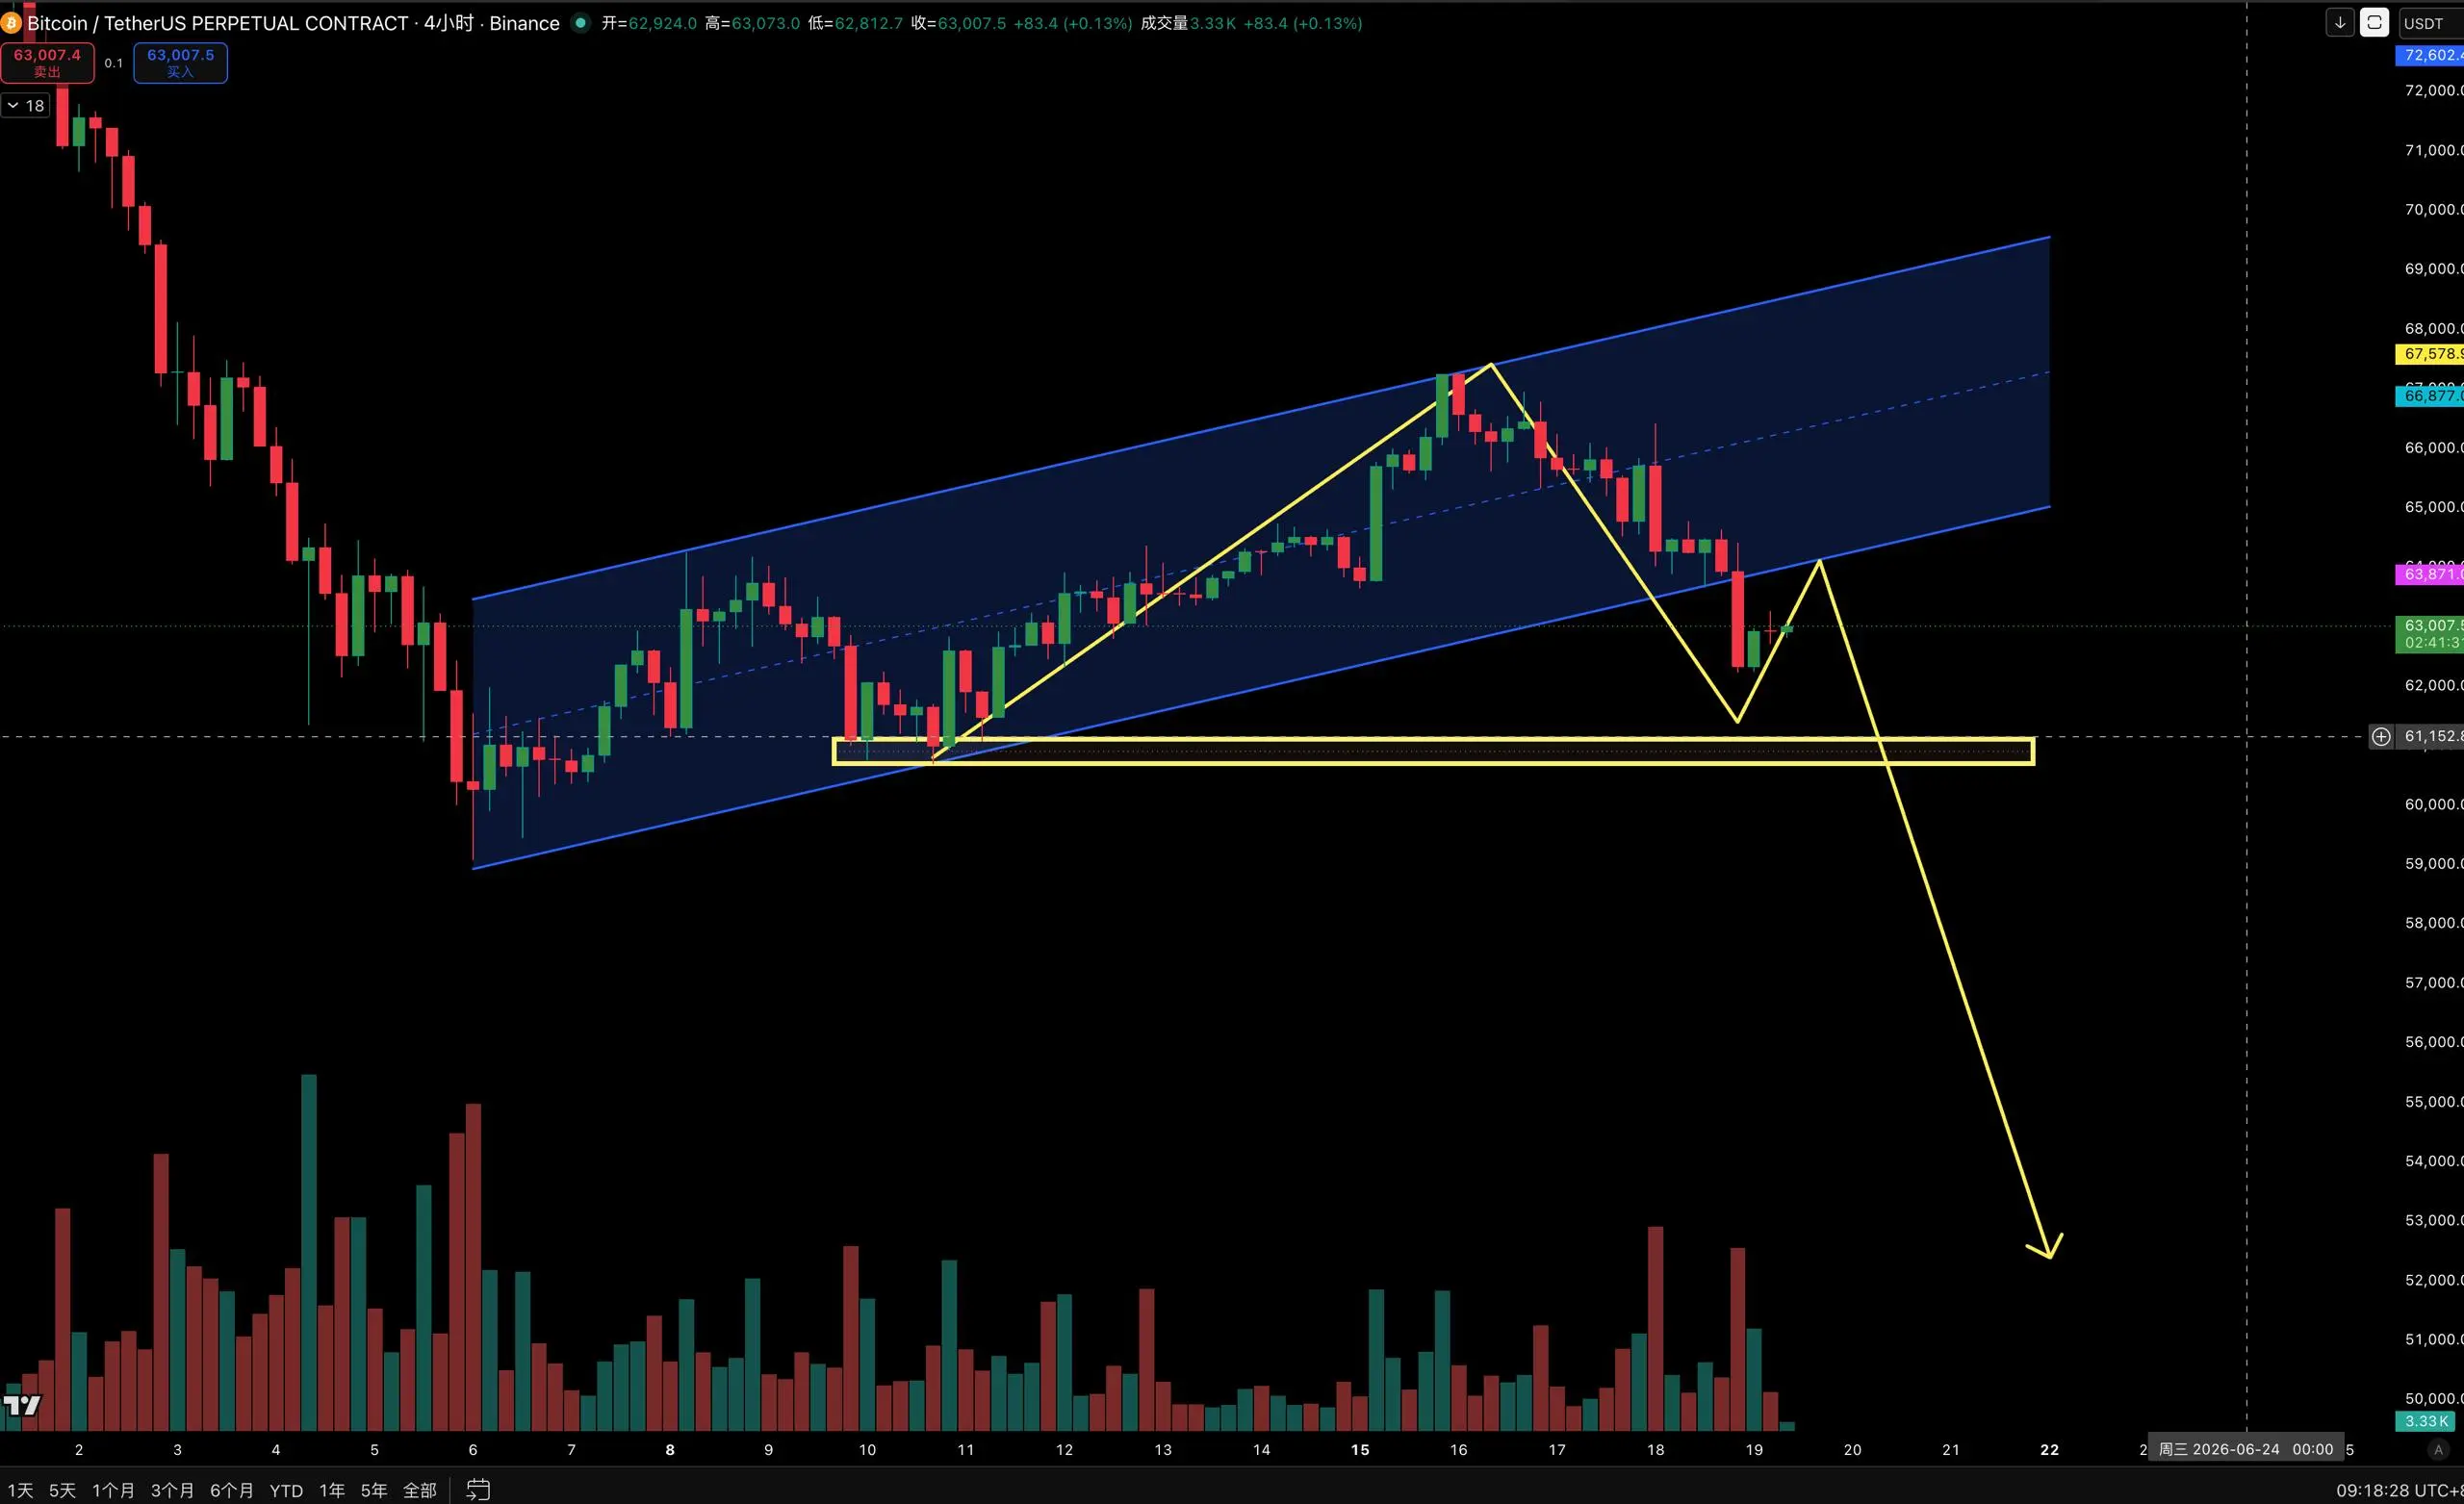
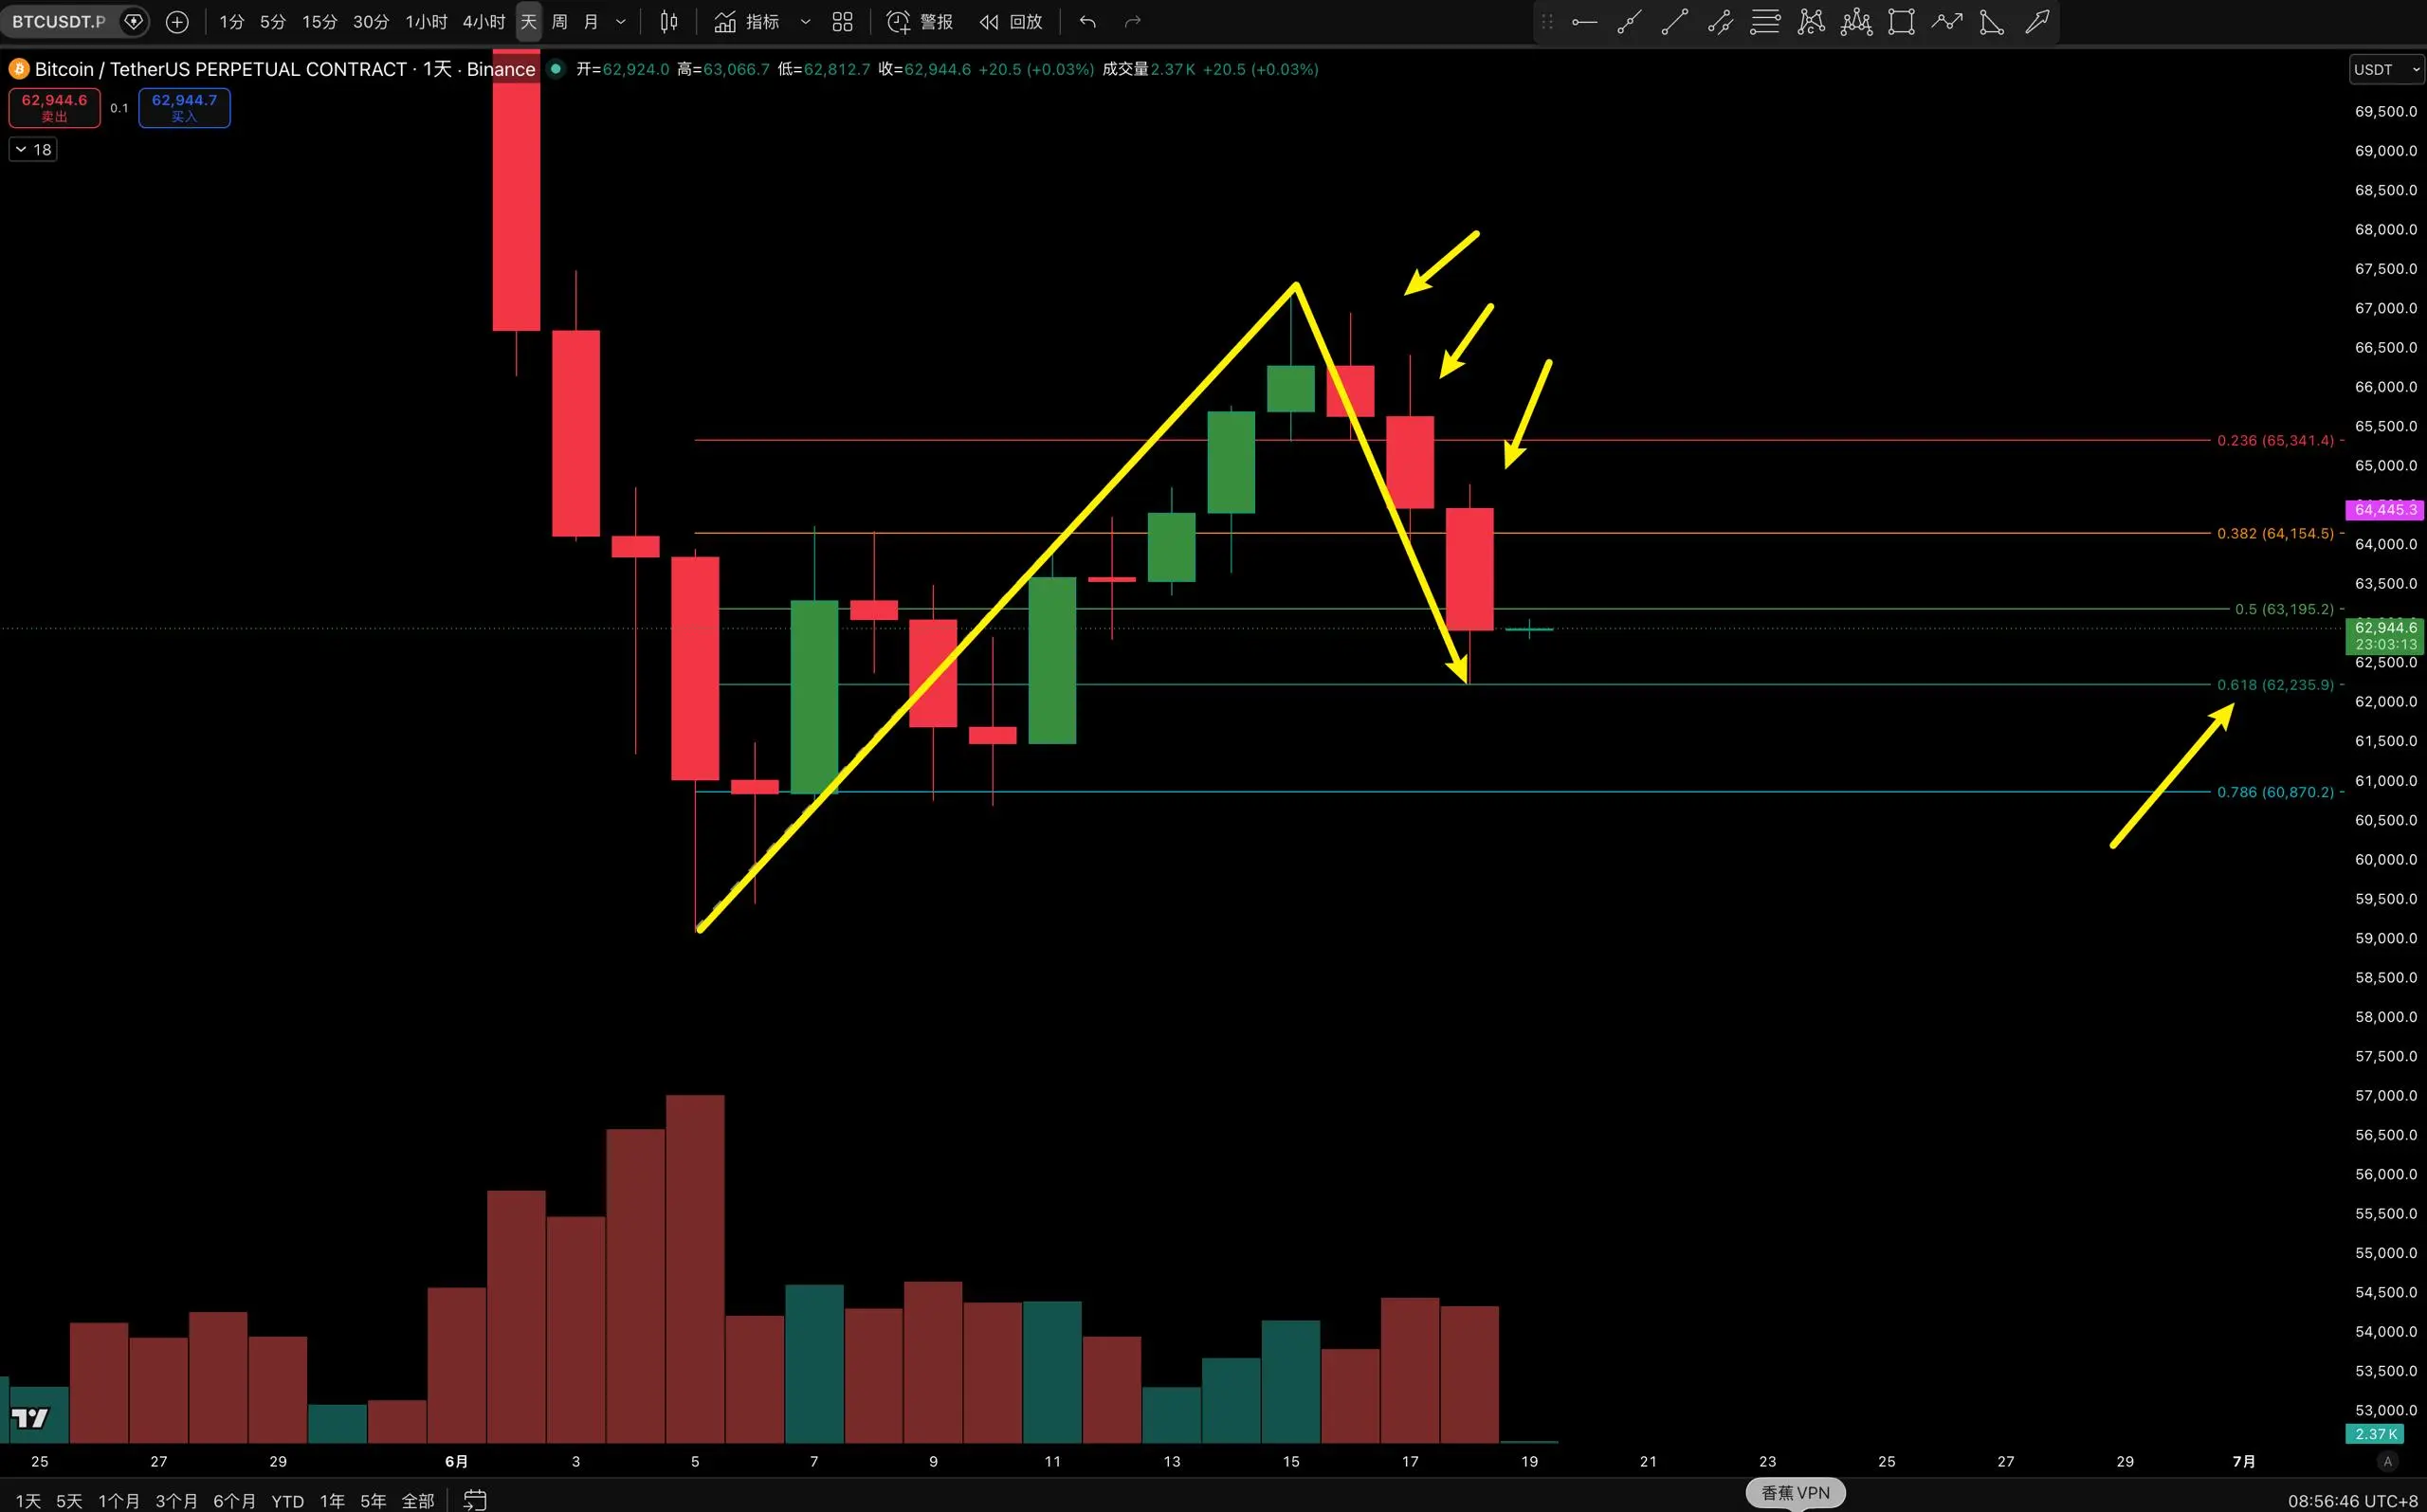
Bitcoin is in a weak consolidation within a downtrend on the daily chart, with support after testing Fibonacci 0.618 yesterday. During the night, it fluctuated between 62,200 and 63,000, with no signs of a valid reversal. Additionally, this morning's close was below 63,200, forming three black crows, indicating a clear bearish trend.
On the 4-hour chart, after hitting a bottom at 62,232, the price rebounded slightly, but the rebound high only reached 63,266, failing to regain the previous level. The rebound momentum has weakened, and the 4-hour channel has broken
BTC2.27%
View Original
post-image
post-image
  • Reward
  • Comment
  • Repost
  • Share
⭐ Bitcoin Market Update Today
Bitcoin sharply declined to around 638M under the impact of hawkish signals from the FOMC, with a short-term bearish structure. Currently, the price is consolidating around 64,500, but the rebound strength is weak, and market sentiment remains extremely fearful. On the daily chart, the price has broken below the MA20 (65,190) and continues to face pressure. A bearish engulfing pattern has formed on the daily, accompanied by increased volume. From 65,746 down to 64,530, the high points are gradually decreasing, indicating a clear dominance of the bears.
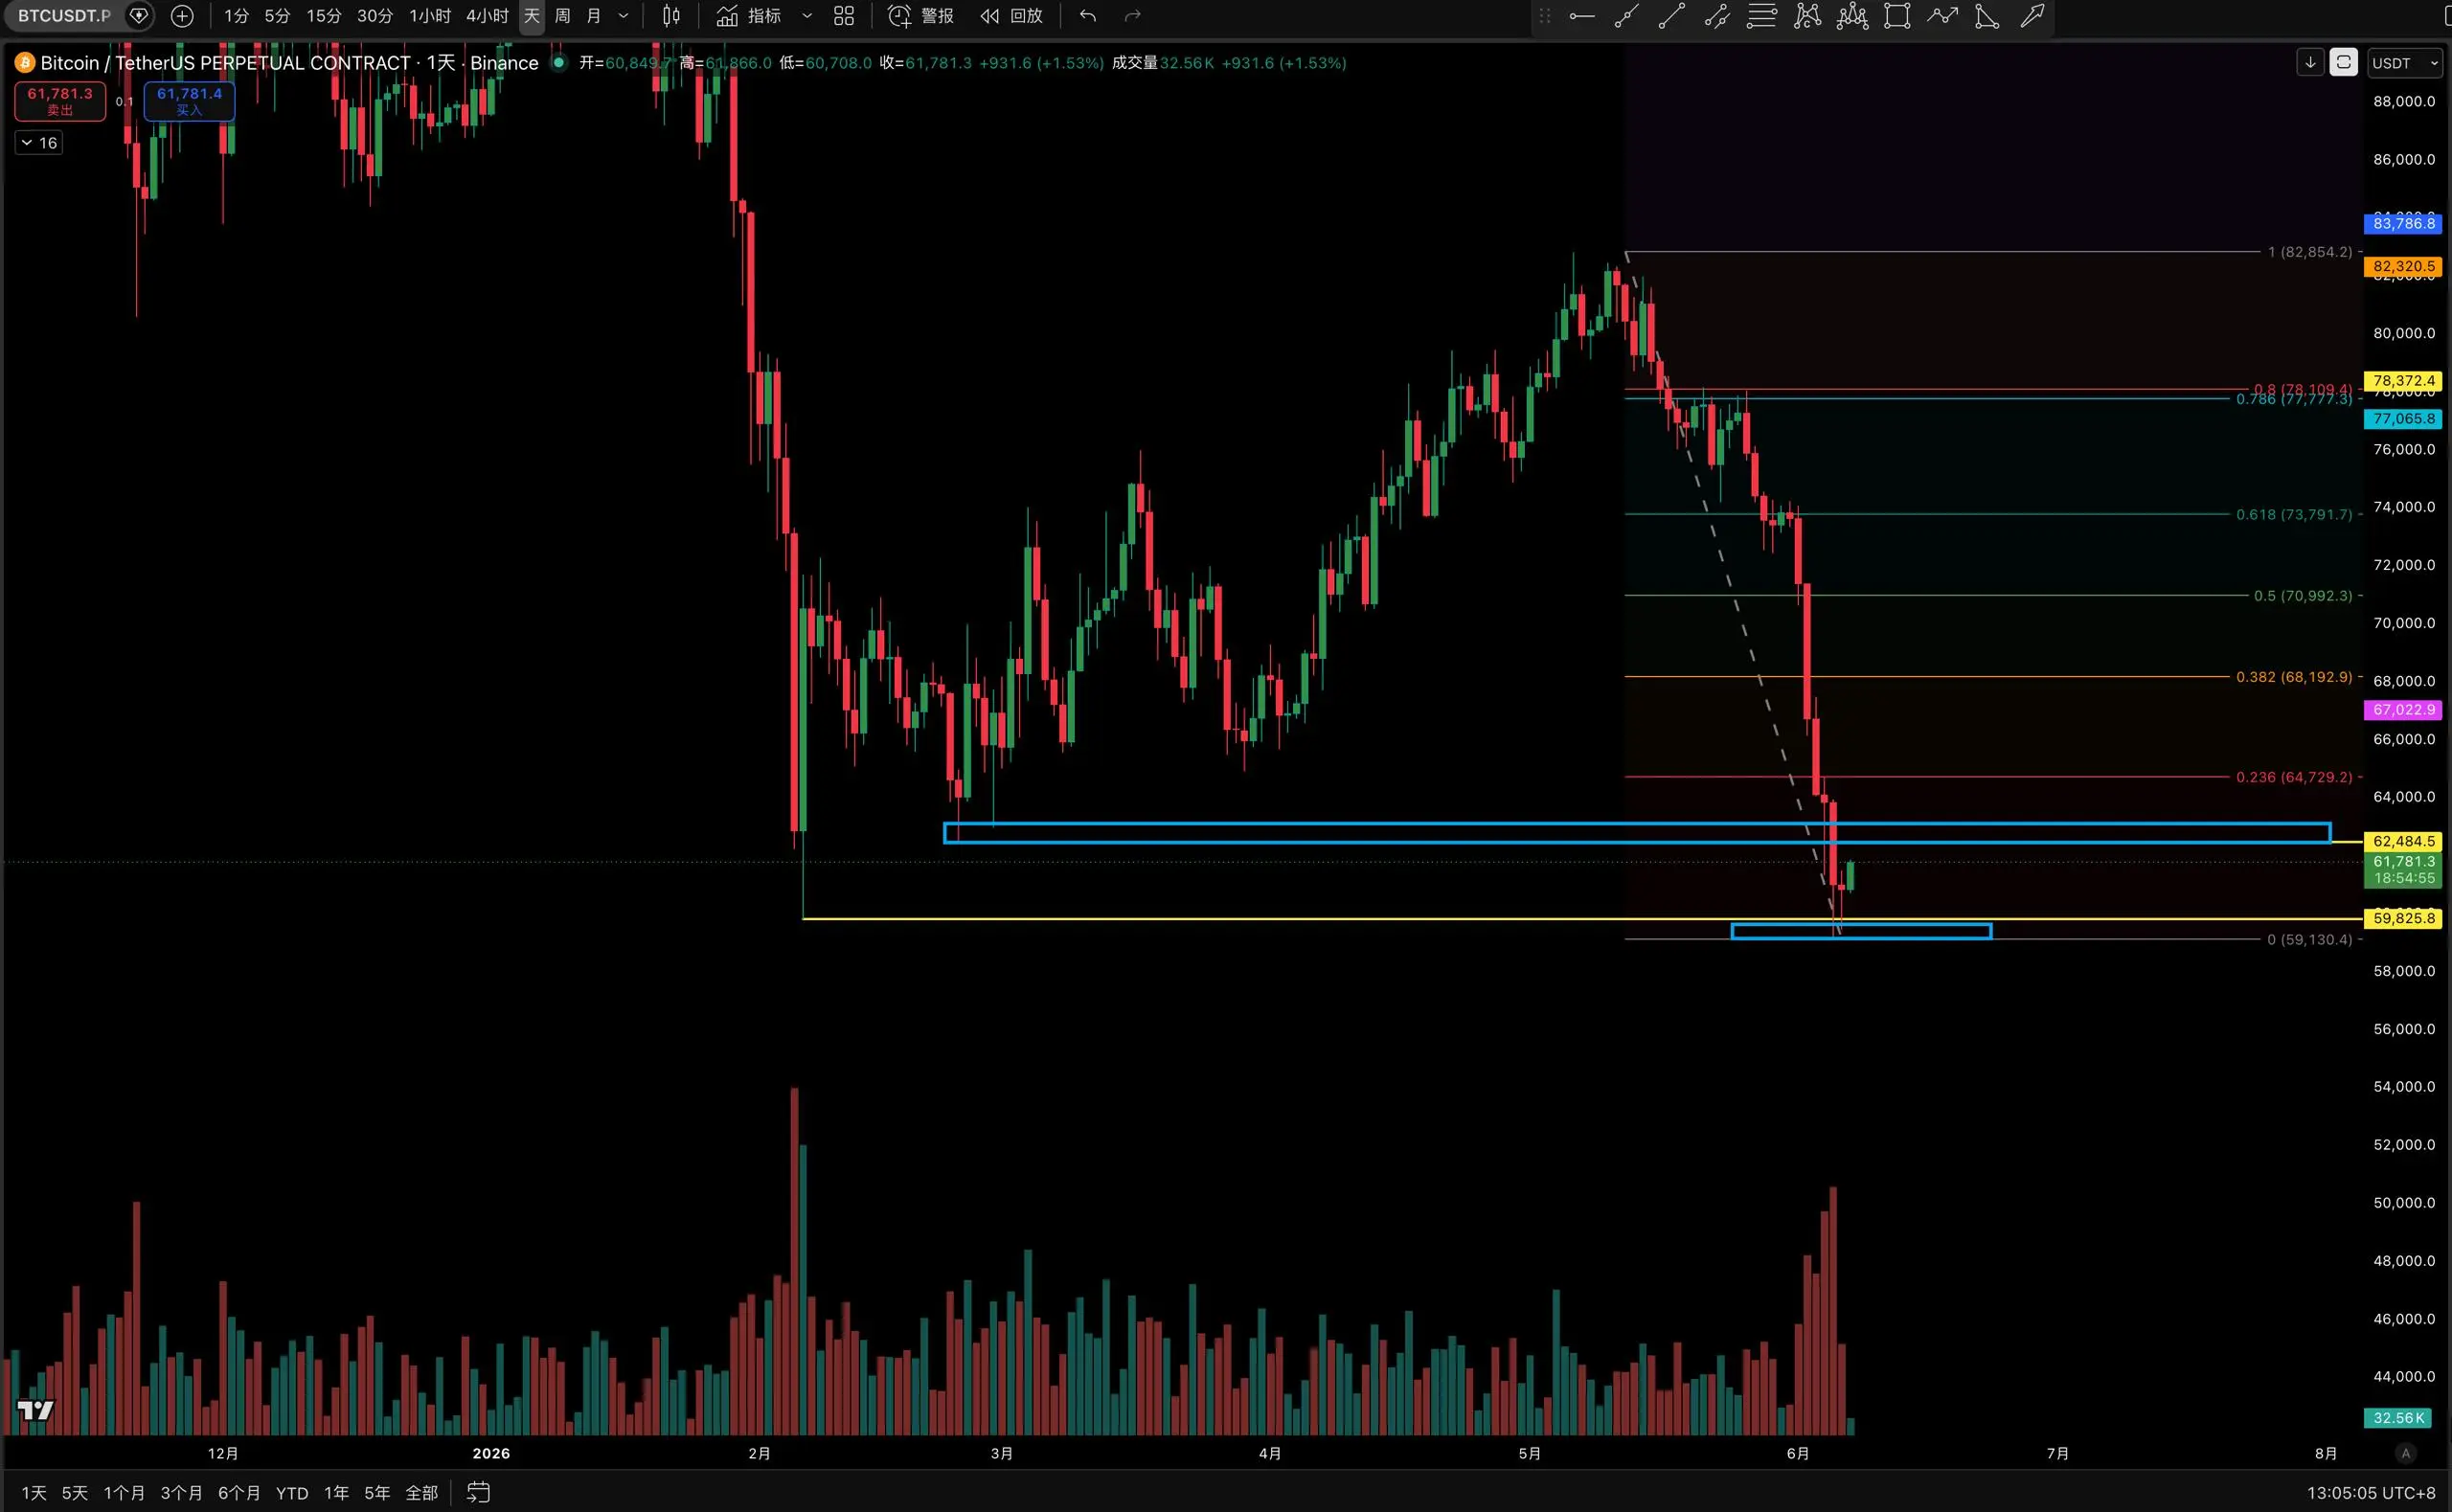
The 4-h
BTC2.32%
View Original
post-image
post-image
  • Reward
  • Comment
  • Repost
  • Share
##⭐ BTC Today's Market Update
Yesterday we mentioned that the trend is leaning bullish, and the rebound pattern remains good.
Operationally, it is recommended to focus on buying on dips.
Yesterday, Bitcoin retreated to 65,400 and stabilized before rising again.
Driven by the news of BlackRock's BITA ETF listing, the price surged above 67k, reaching a high of 67,292, then slightly pulled back to around 66,442 for consolidation.
Fundamentally, the Standard Chartered report stating the "crypto winter is over" and the launch of BlackRock's new ETF have indeed injected short-term confiden
BTC2.32%
View Original
post-image
post-image
  • Reward
  • Comment
  • Repost
  • Share
⭐ BTC Today's Market Update ⭐
Bitcoin found support near 63,600, then rebounded, with easing geopolitical tensions as the main driver. Today's market continued this trend, currently oscillating around 65,620. Short-term bullish momentum has slowed, but the overall rebound structure remains intact.
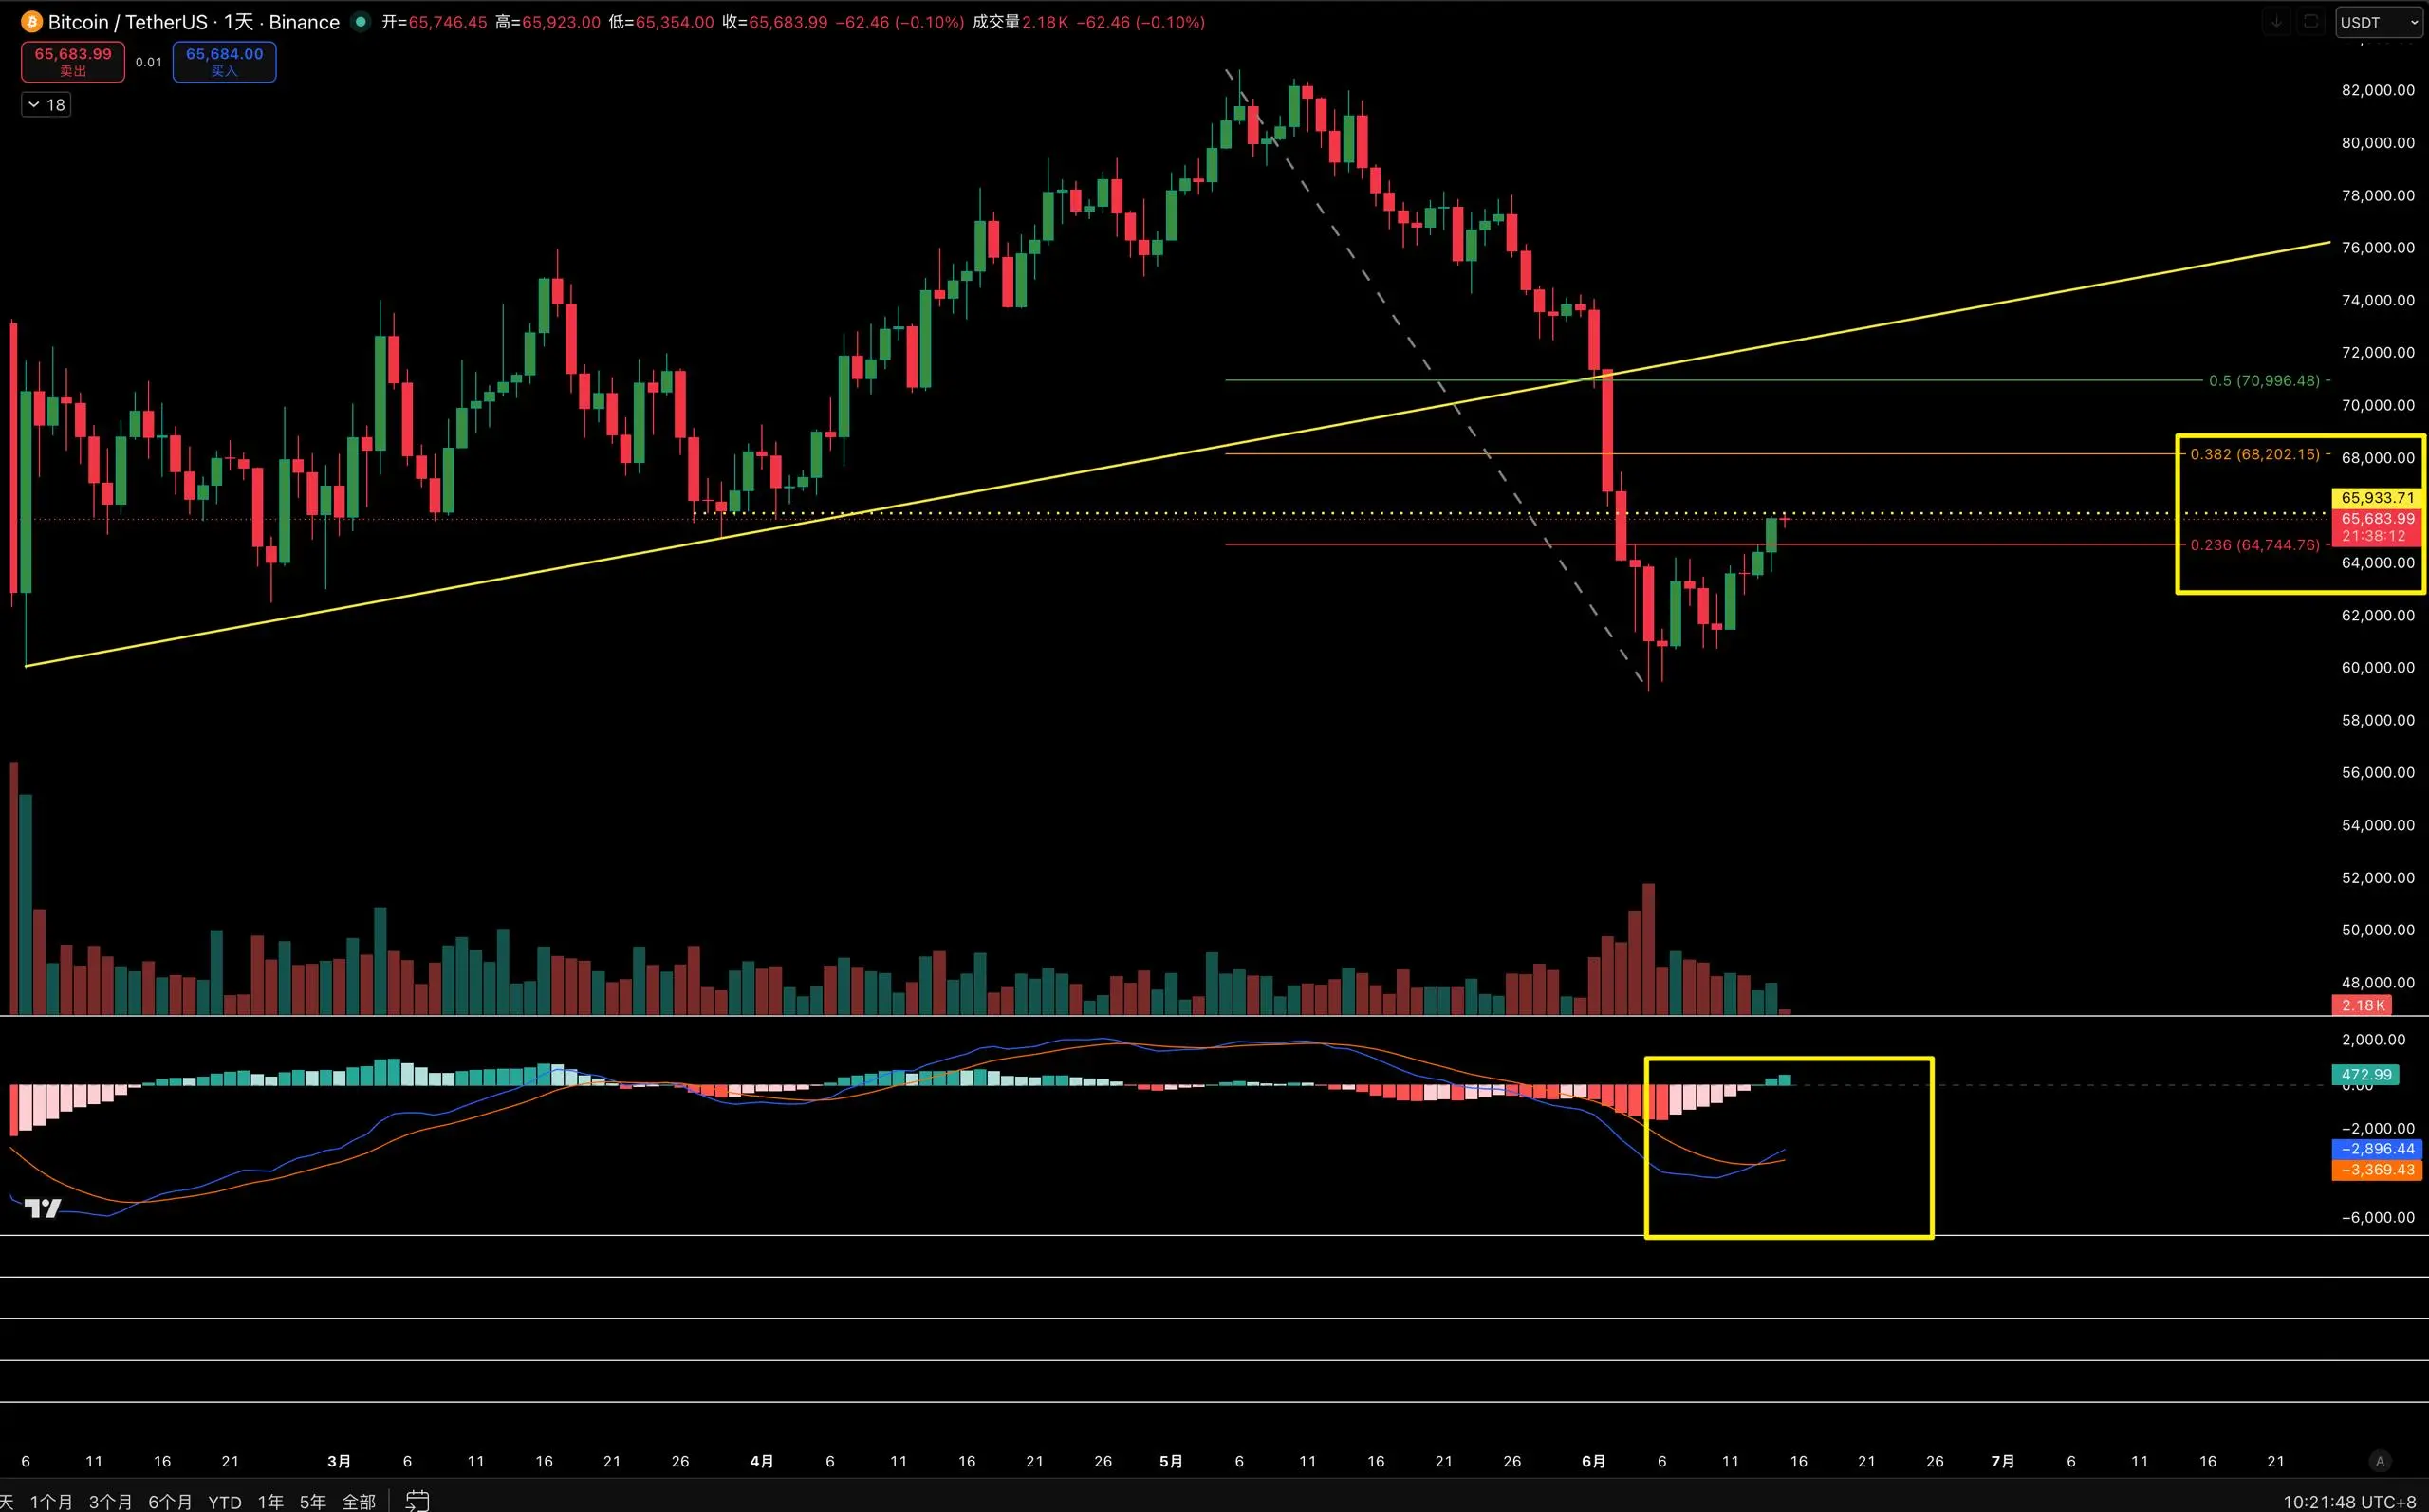
On the daily chart, a medium-sized bullish candle was formed yesterday, breaking above the key area around 64,800, and we can see that the MACD is forming a golden cross below the waterline.
Since this golden cross is still below the zero axis, the short-term rebound is valid, but it does not m
BTC2.27%
View Original
post-image
  • Reward
  • Comment
  • Repost
  • Share
⭐ Bitcoin BTC Today's Market Update ⭐
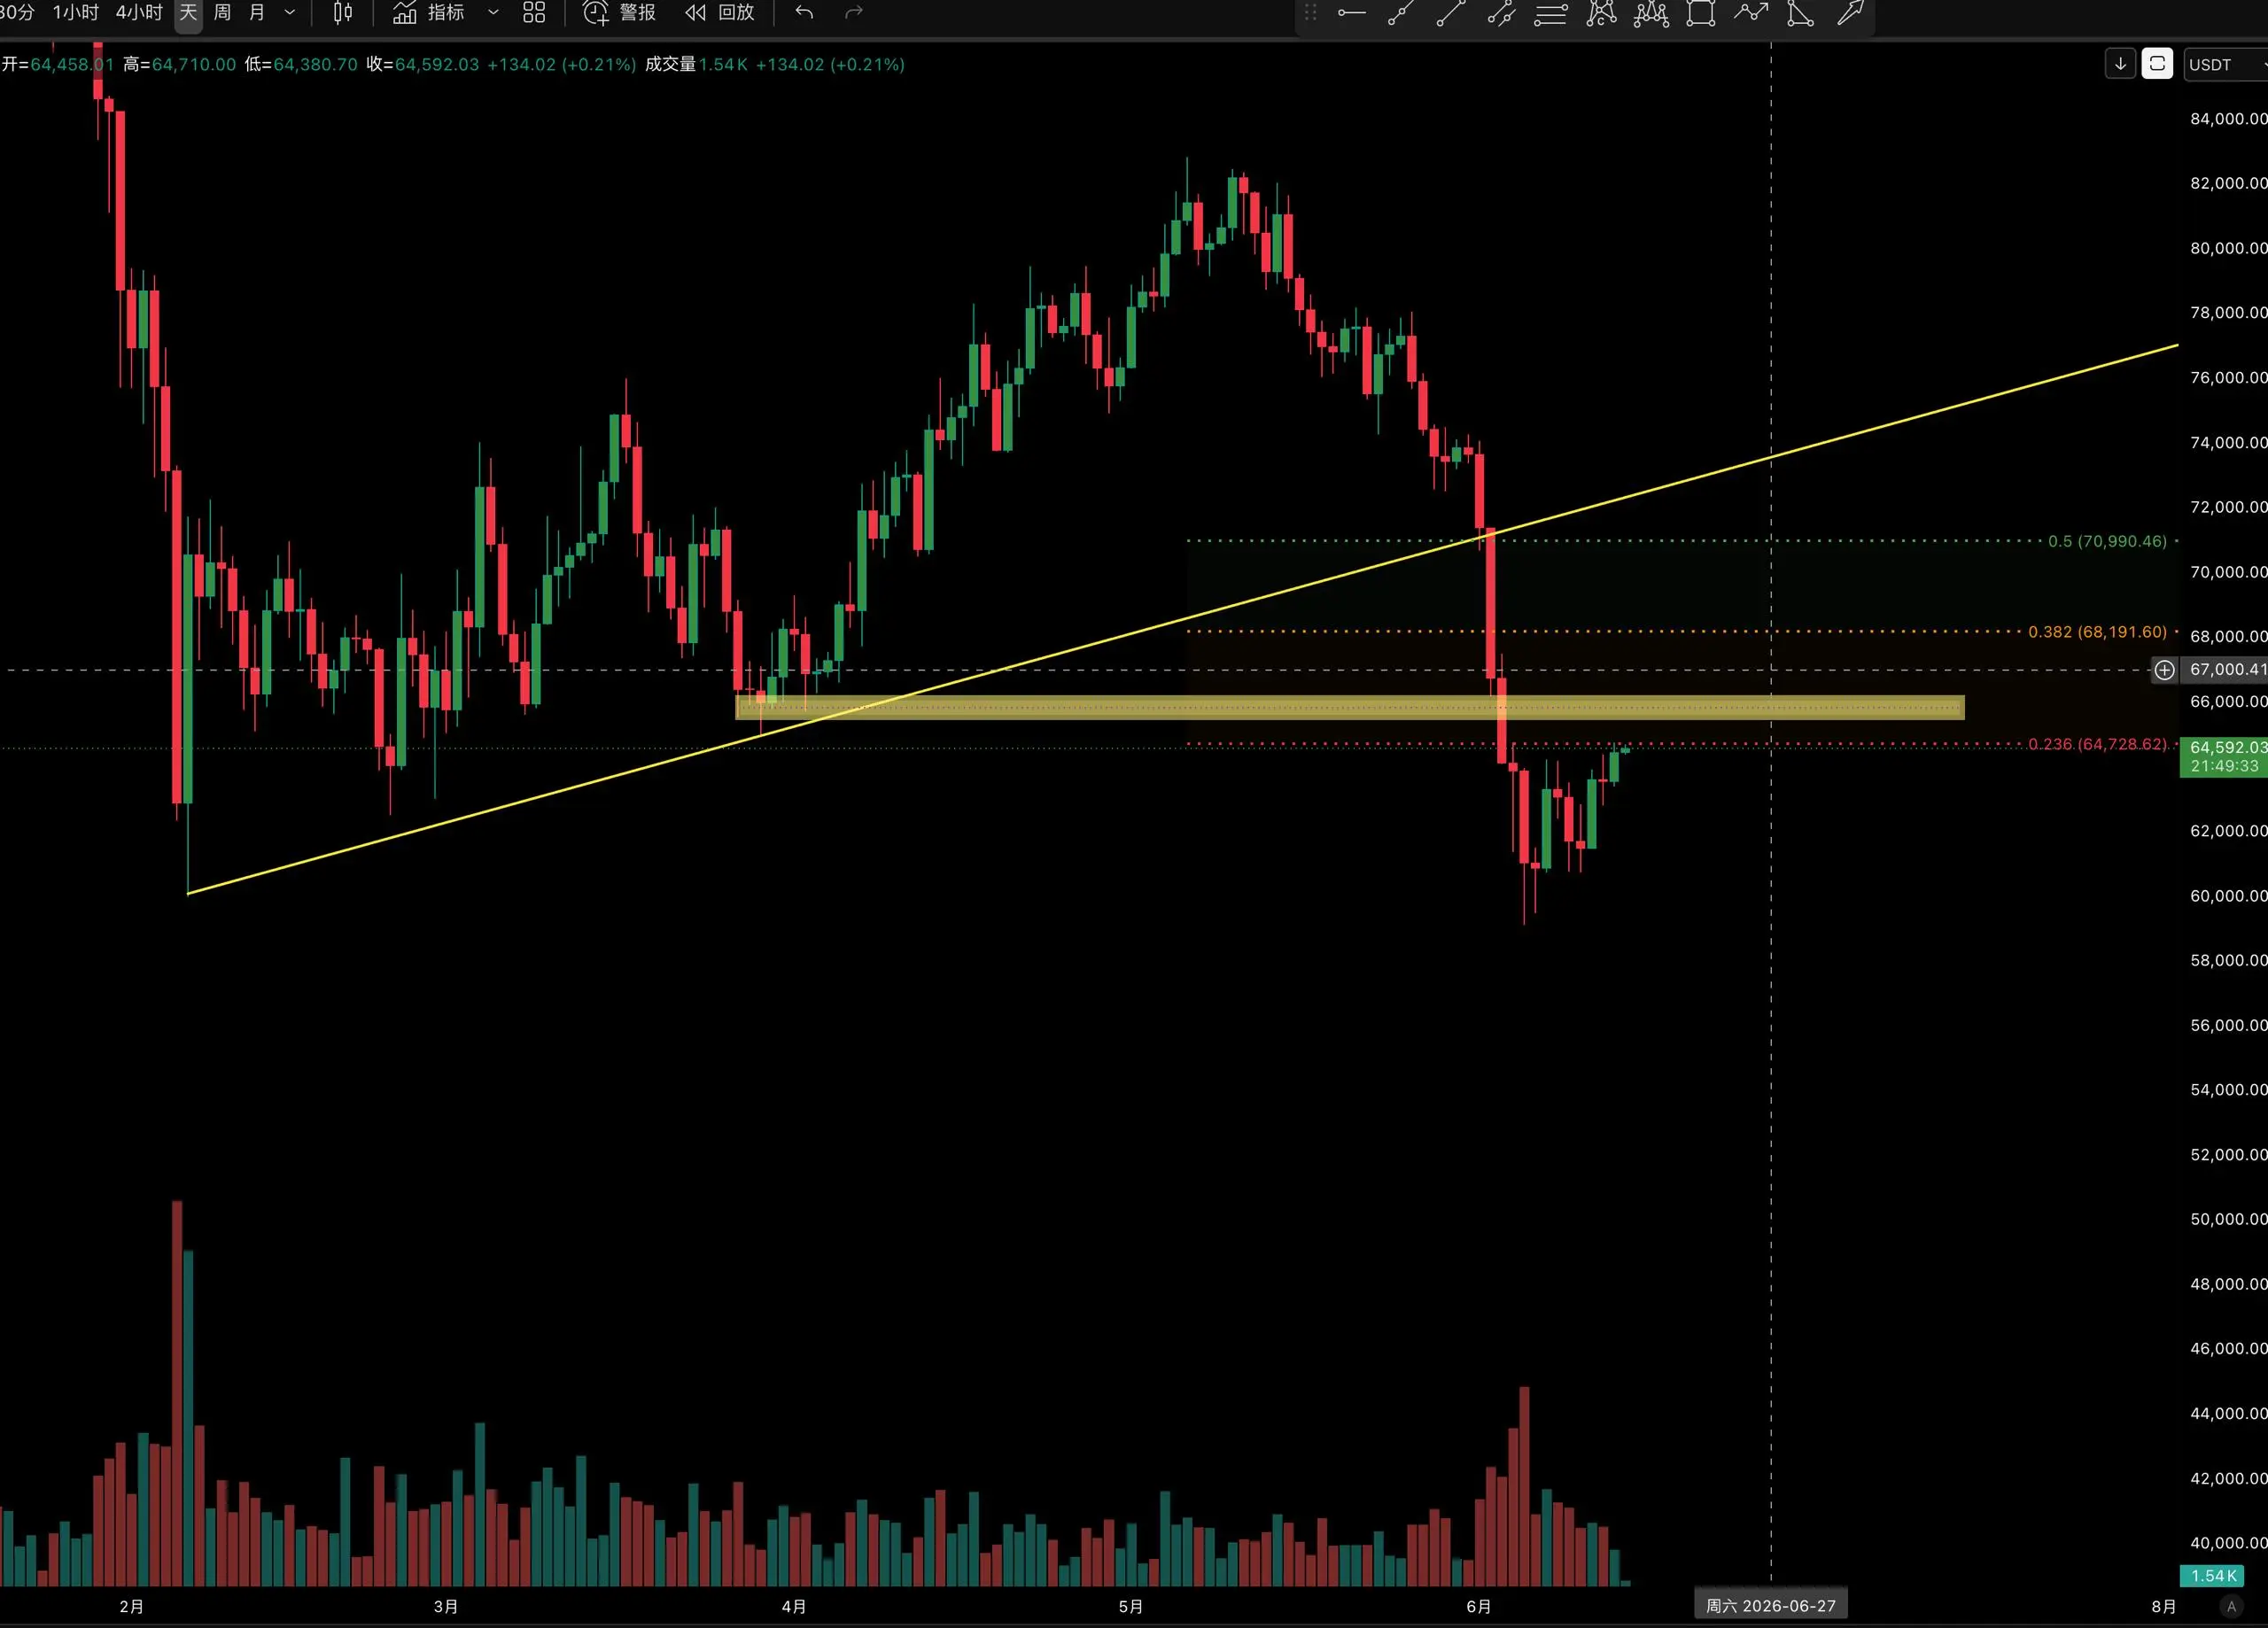
Bitcoin touched the bear market valuation bottom area around 59,000, with the fear and greed index dropping to 9. Market sentiment is pessimistic, but signs of ETF replenishment are beginning to appear. Today, the price has climbed from the bottom all the way to 64,600, with several small green candles steadily pushing upward, temporarily halting the decline. This recovery is stronger than expected.
However, the overall trend is still a rebound within a downward channel, not a trend reversal, more like a correction after an oversell.
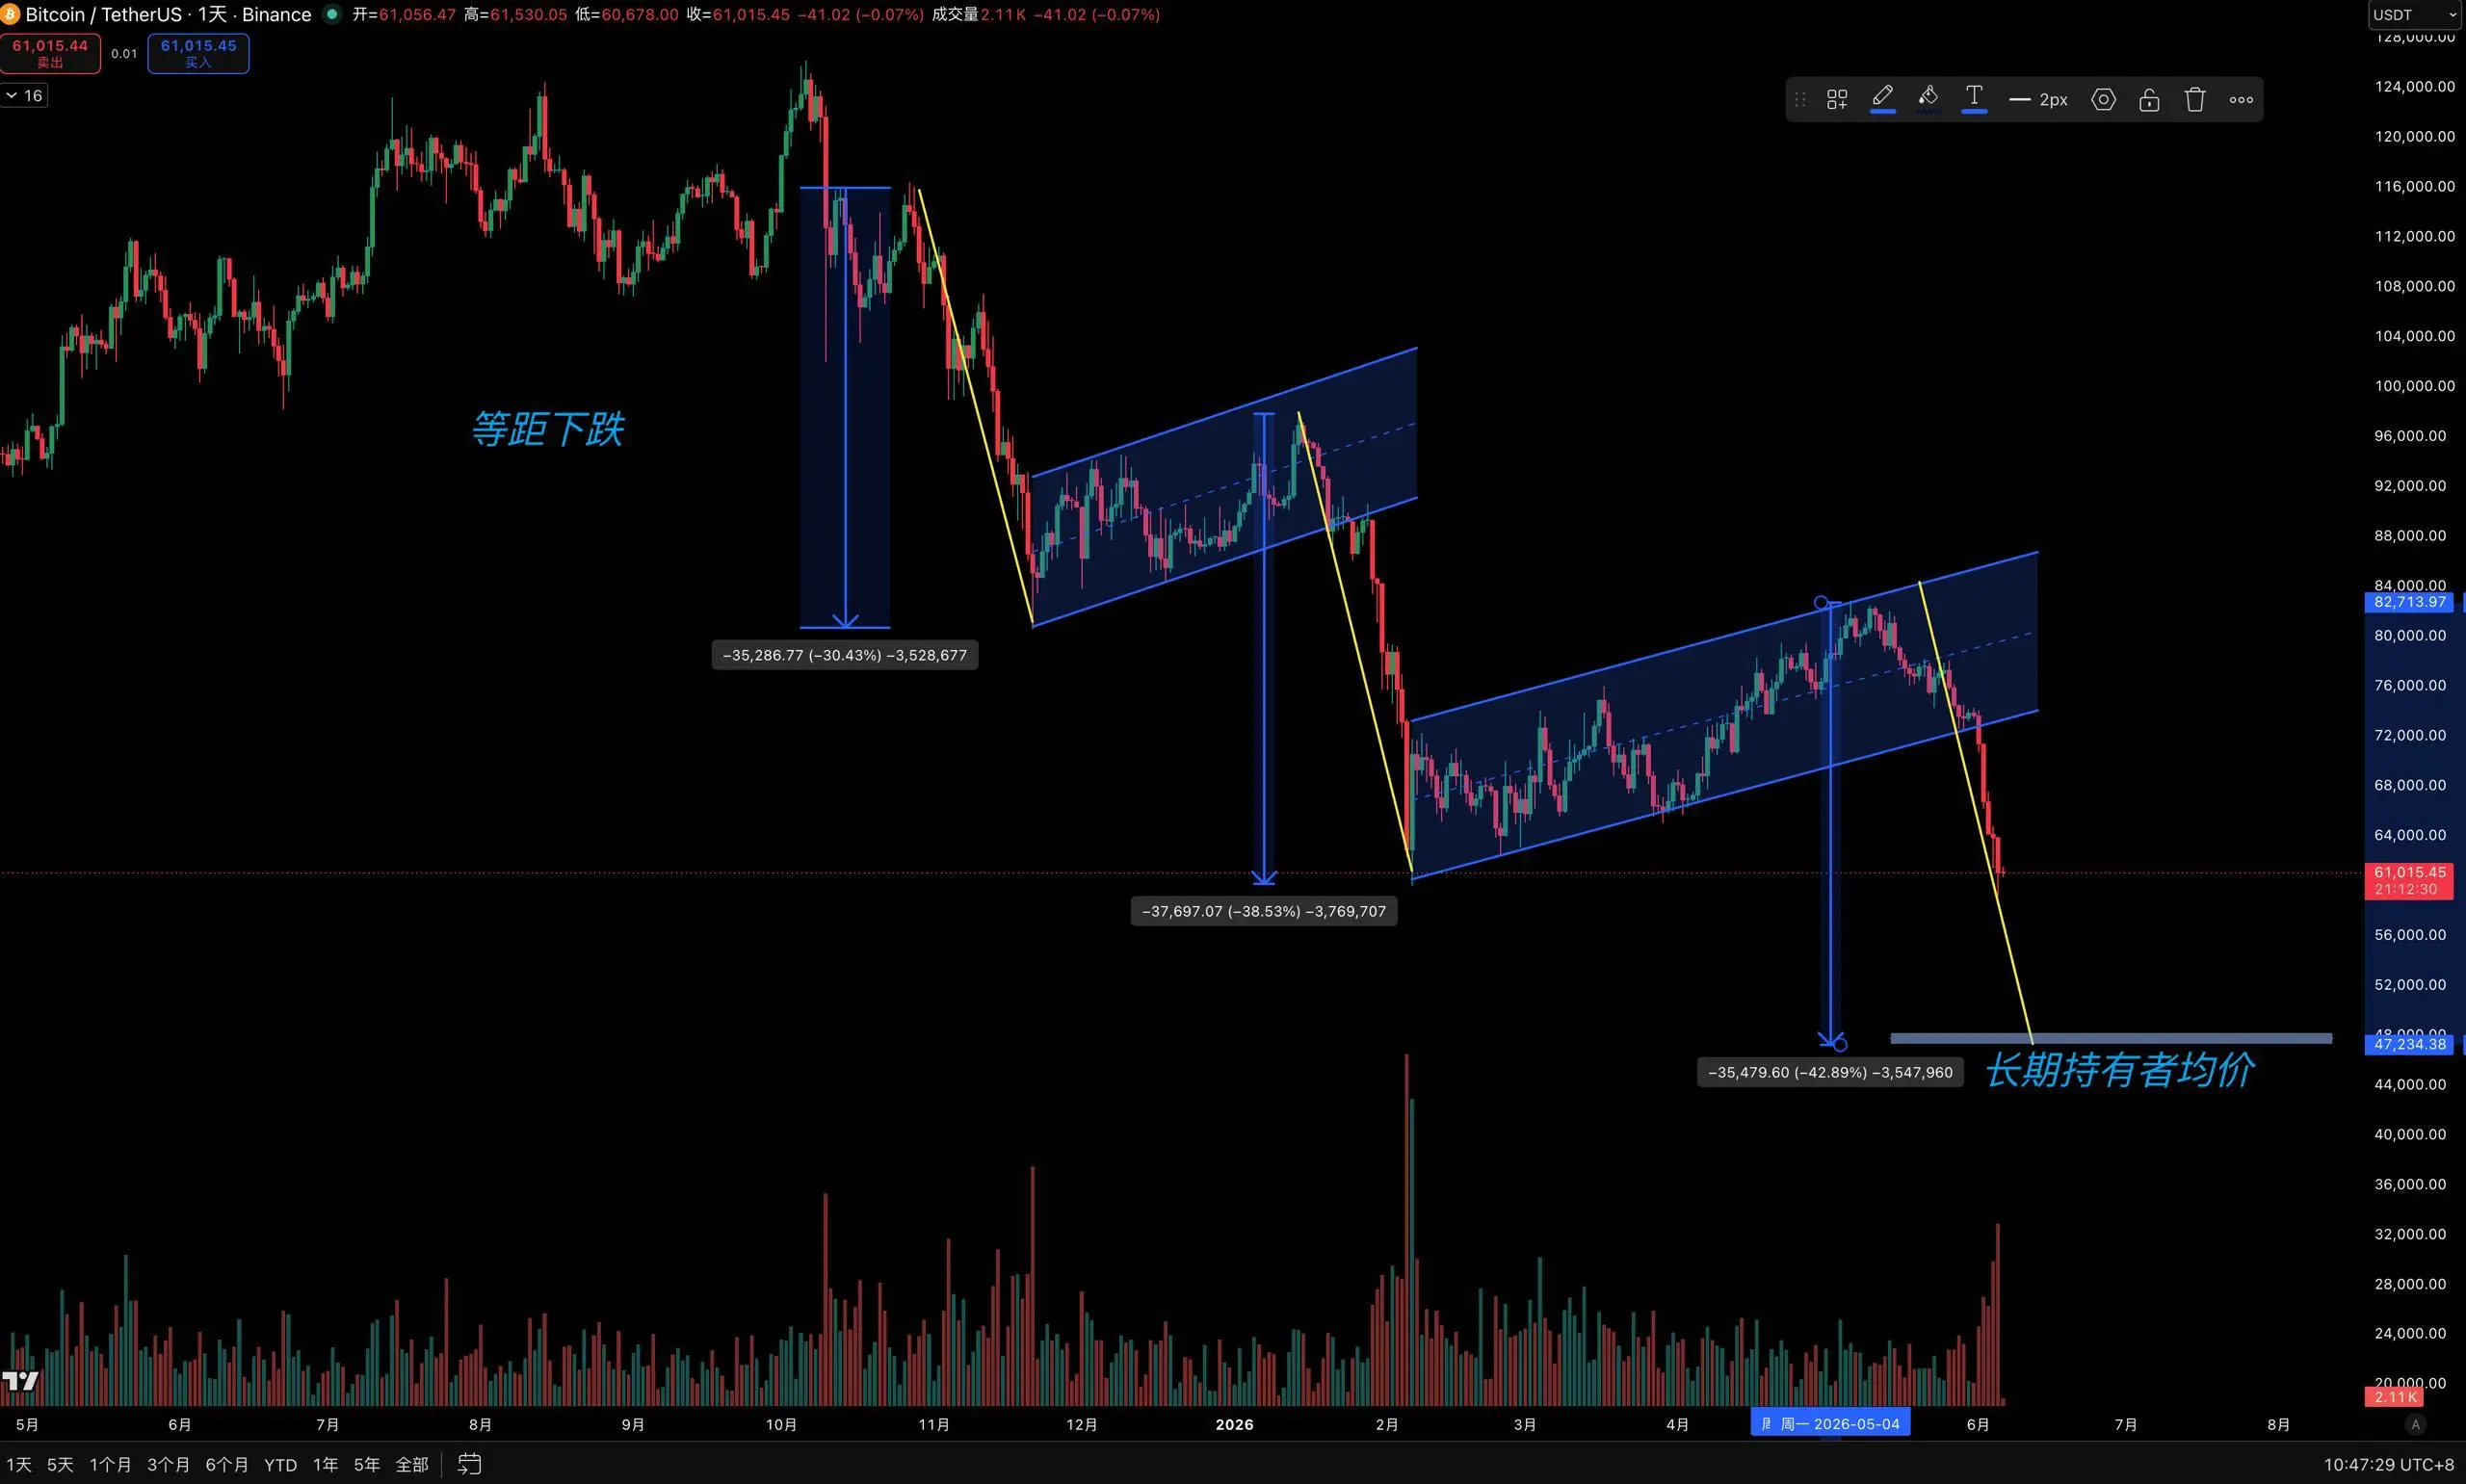
On the daily cha
BTC2.27%
View Original
post-image
  • Reward
  • Comment
  • Repost
  • Share
⭐ BTC Today's Market Update
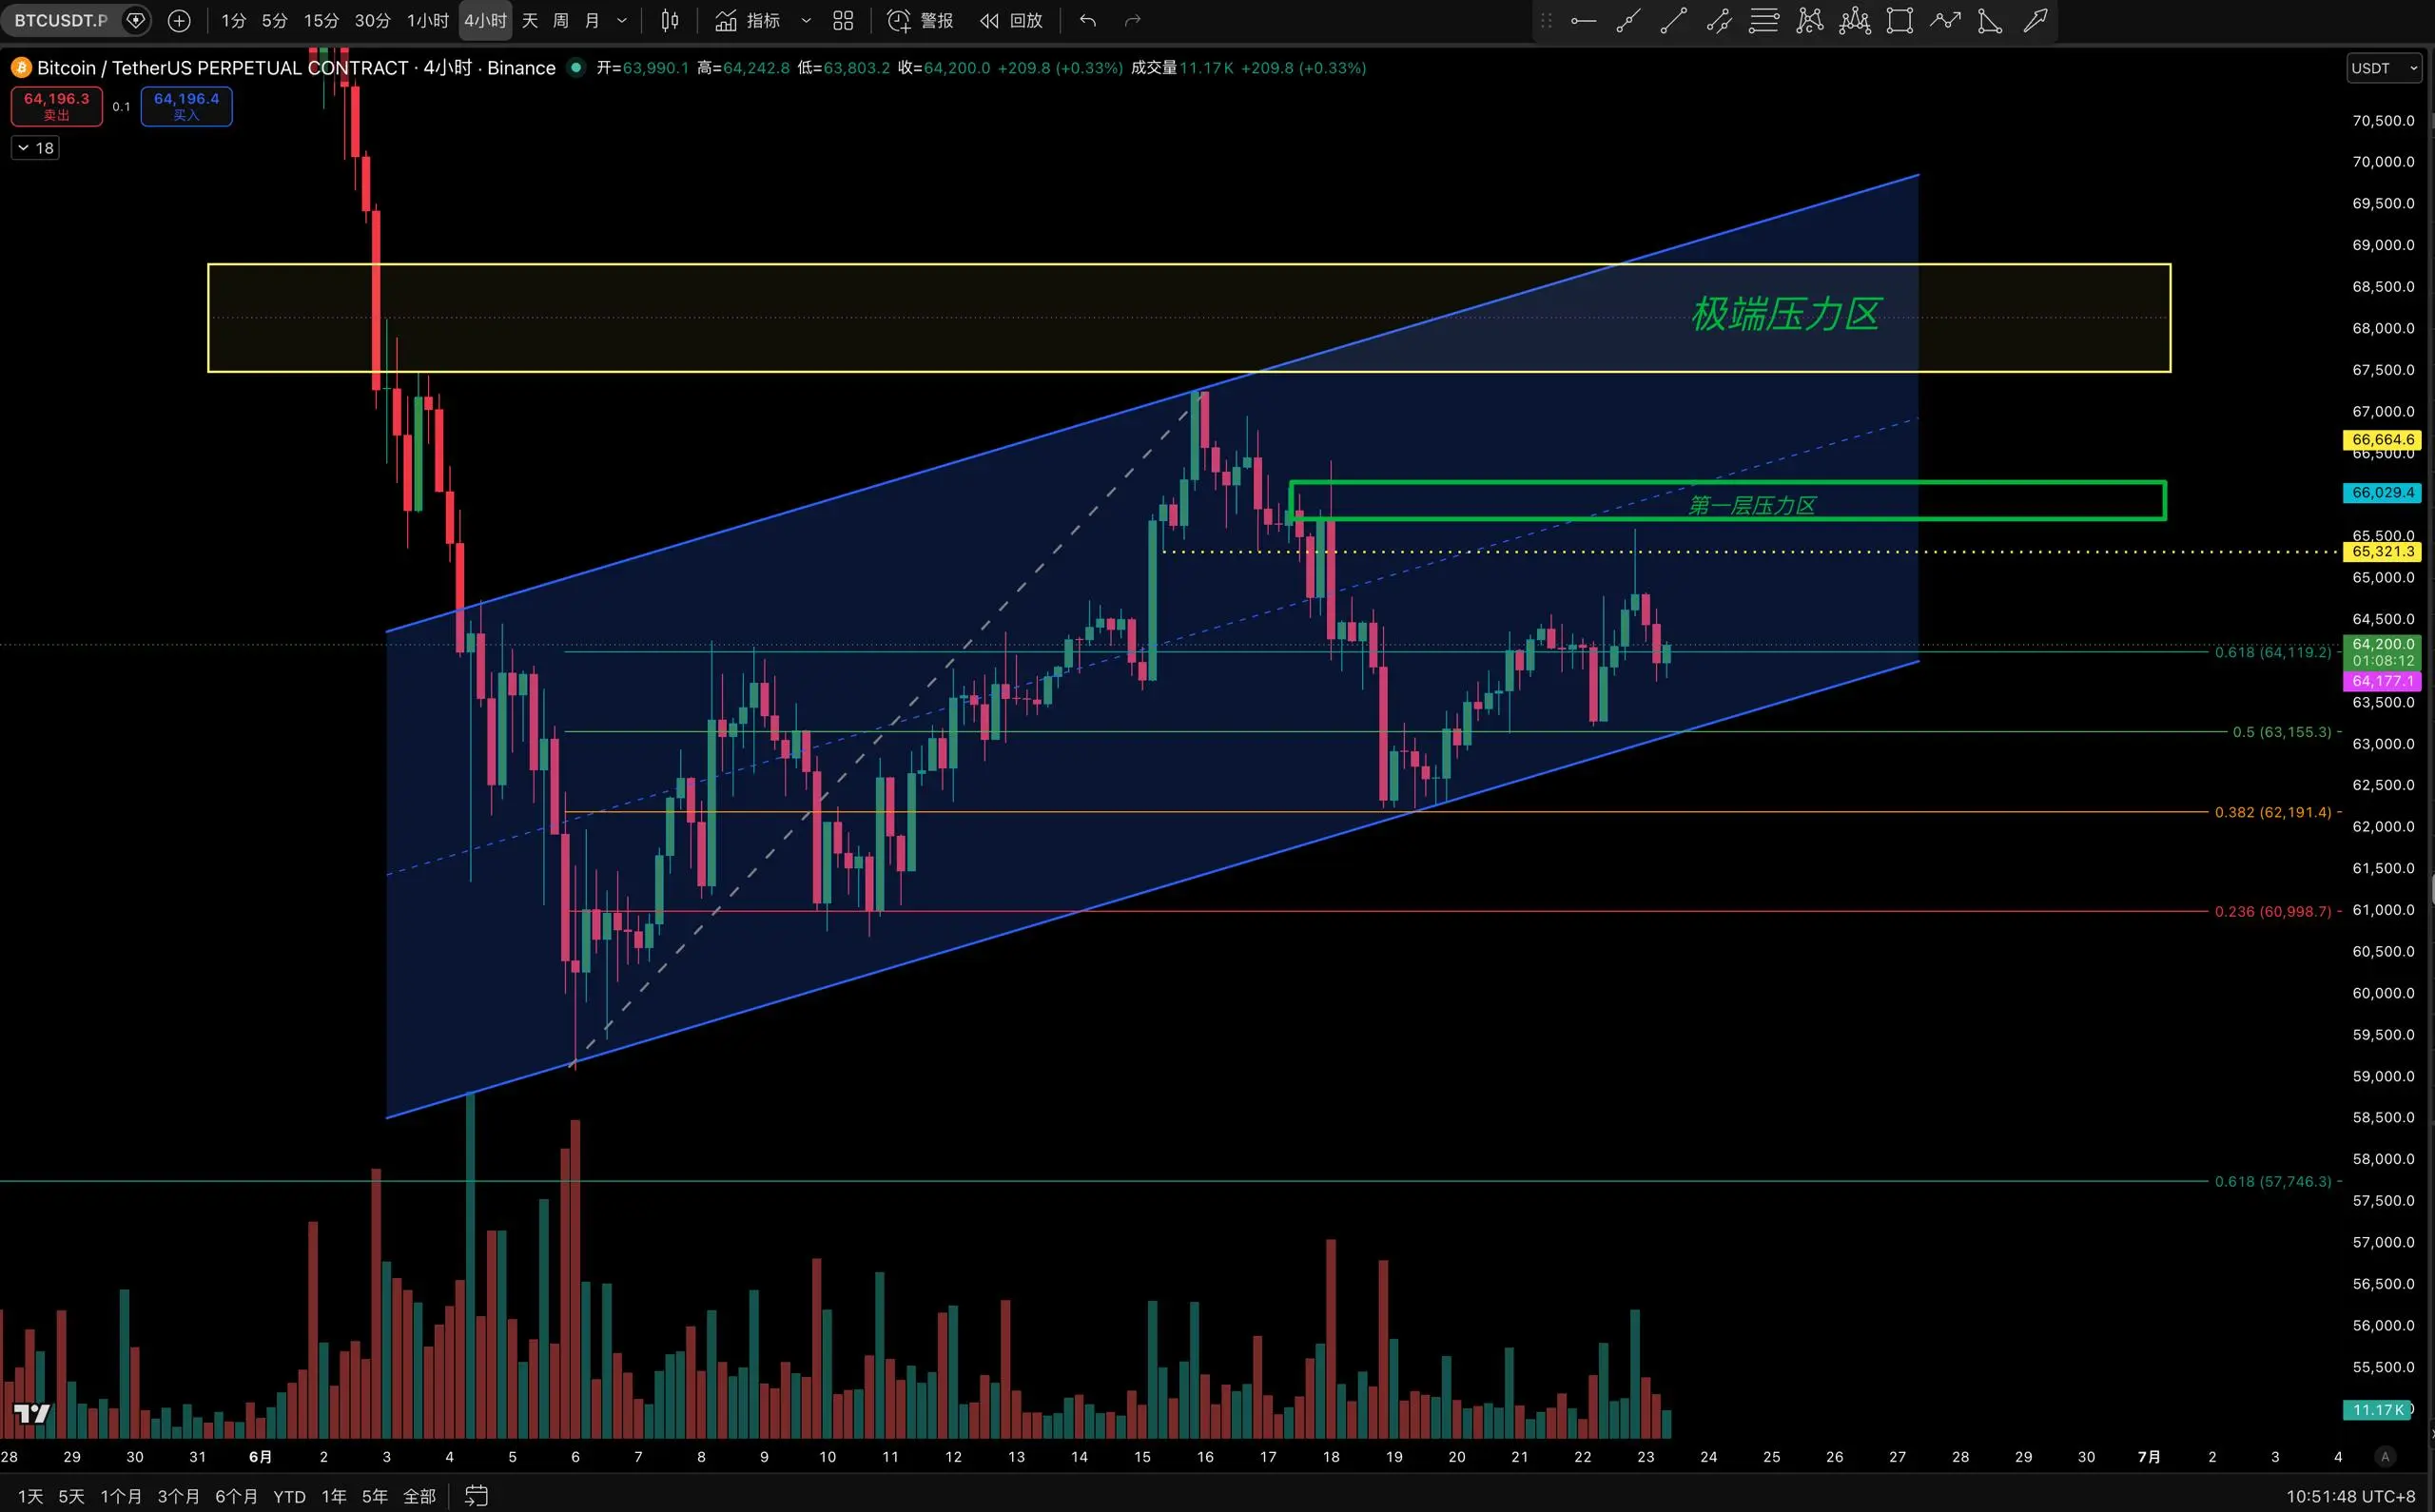
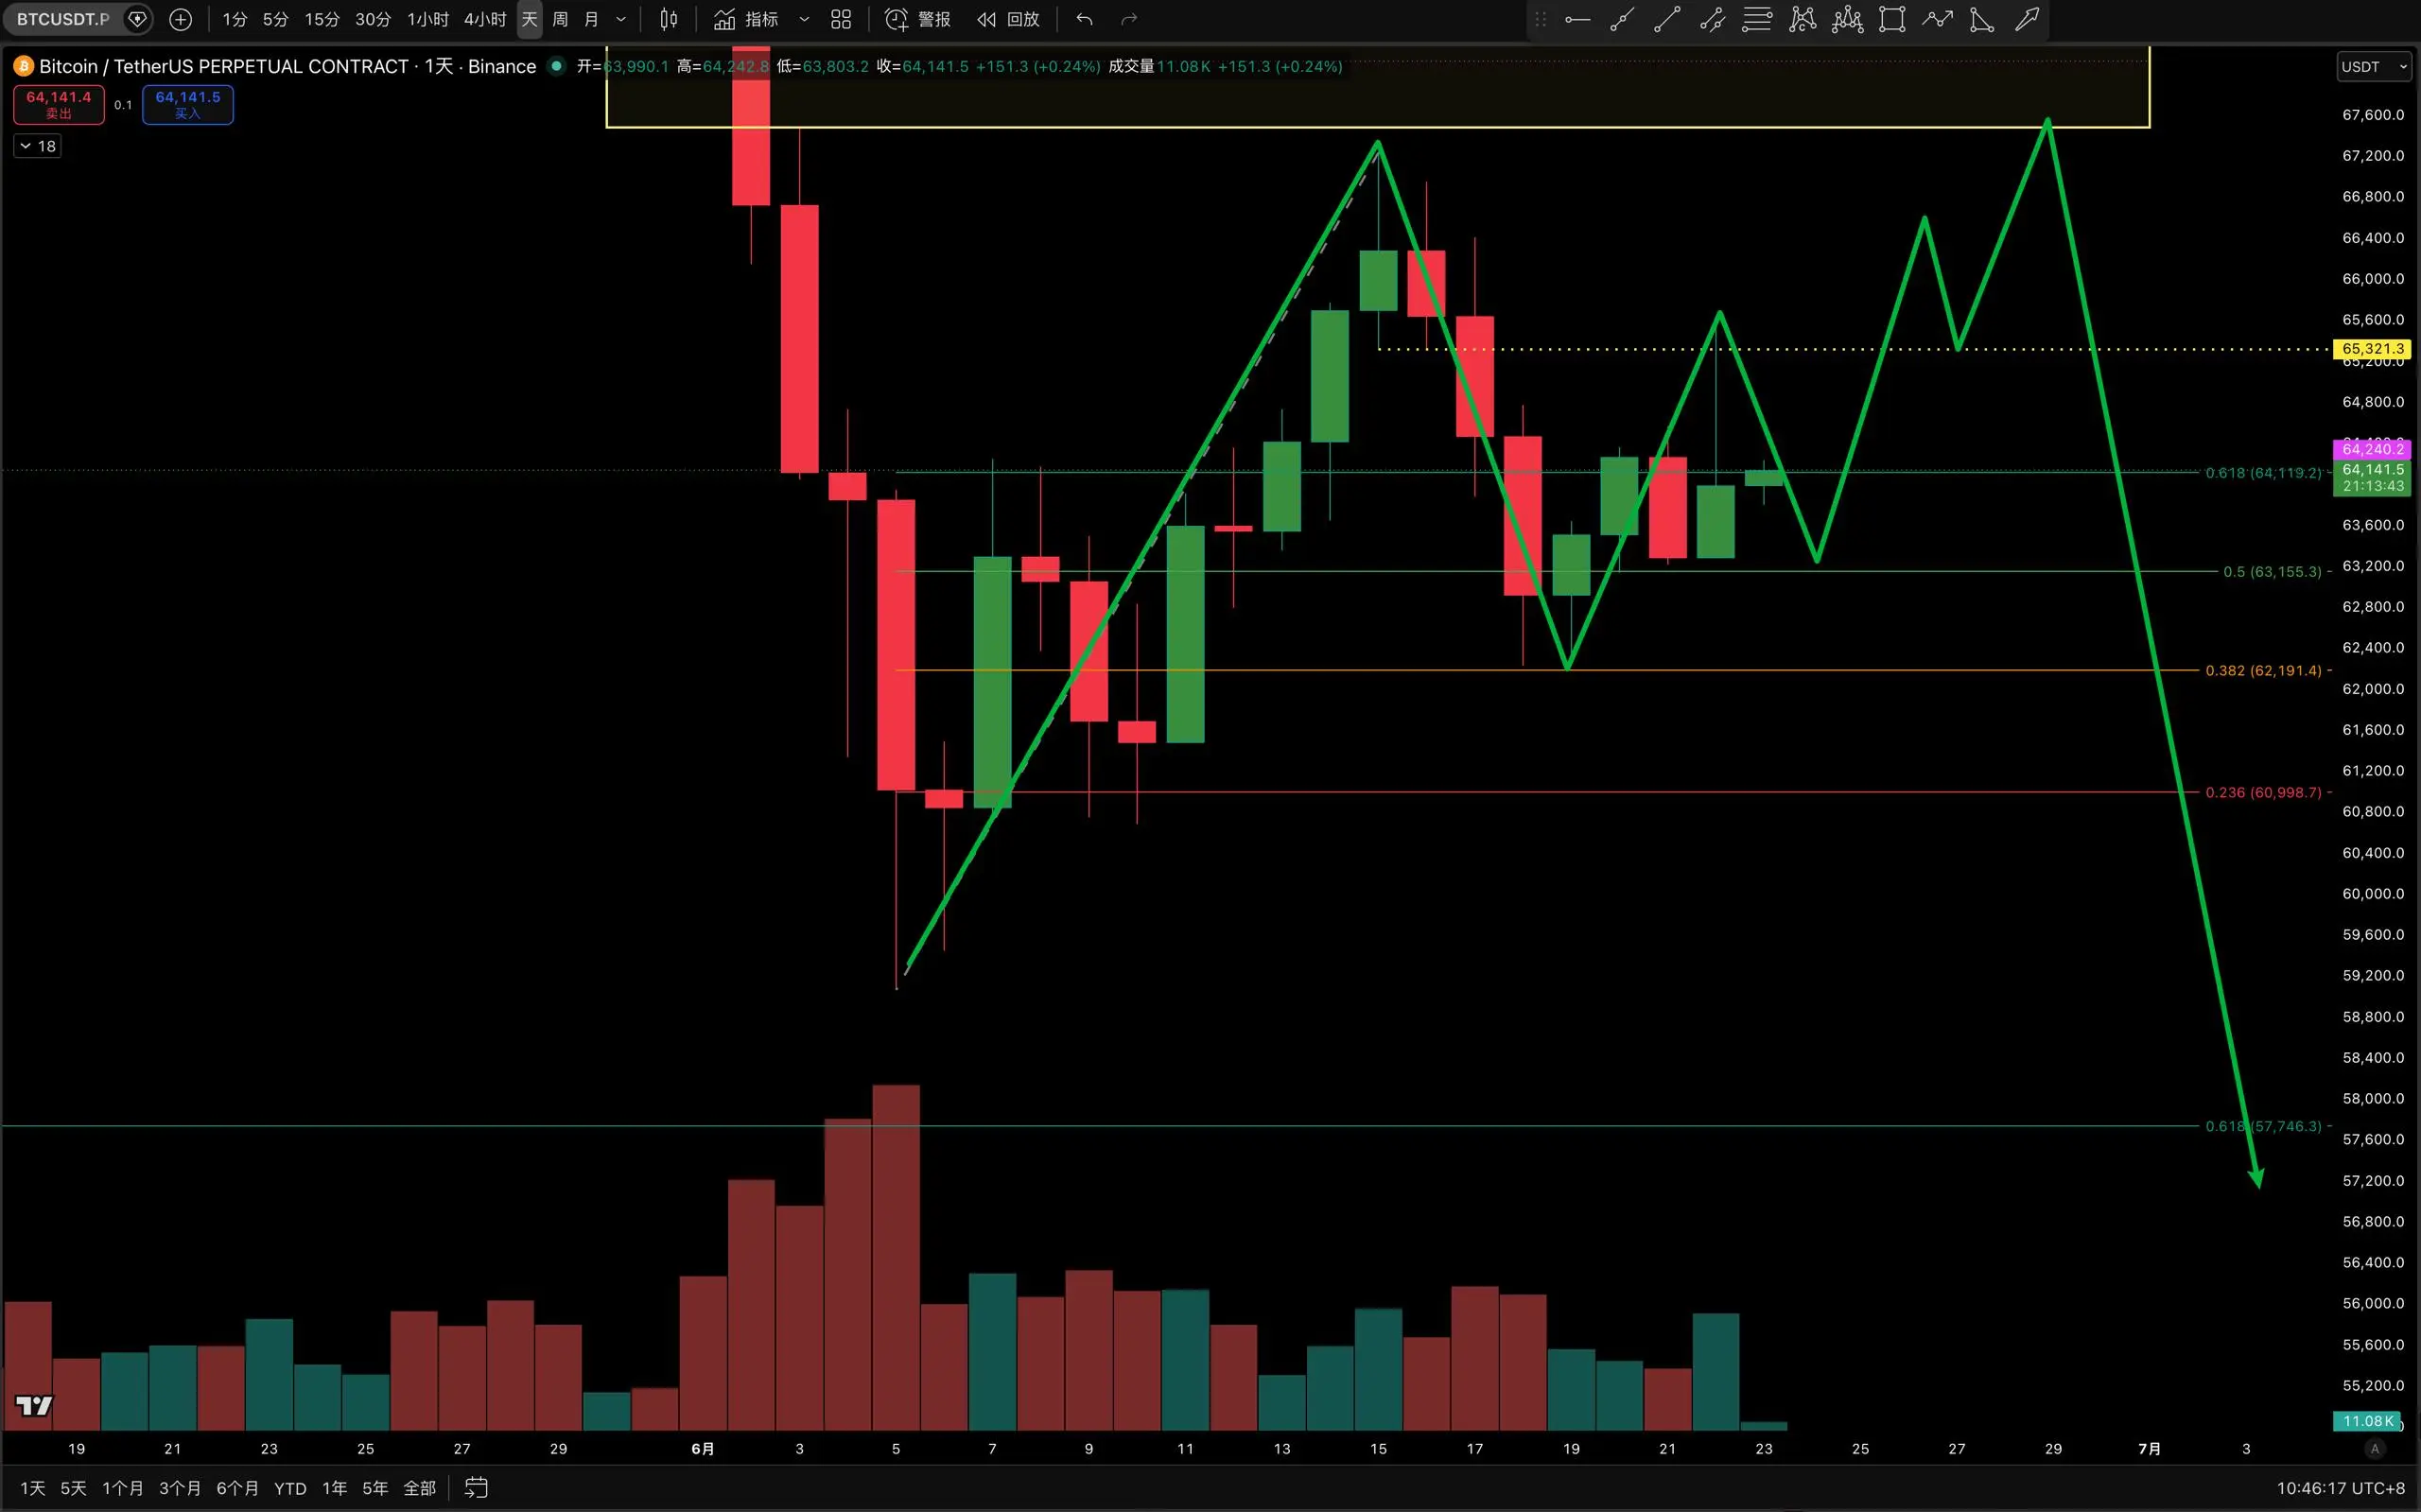
Bitcoin is currently forming short-term support around 63,500 on the daily chart, with key resistance above at around 64,200.
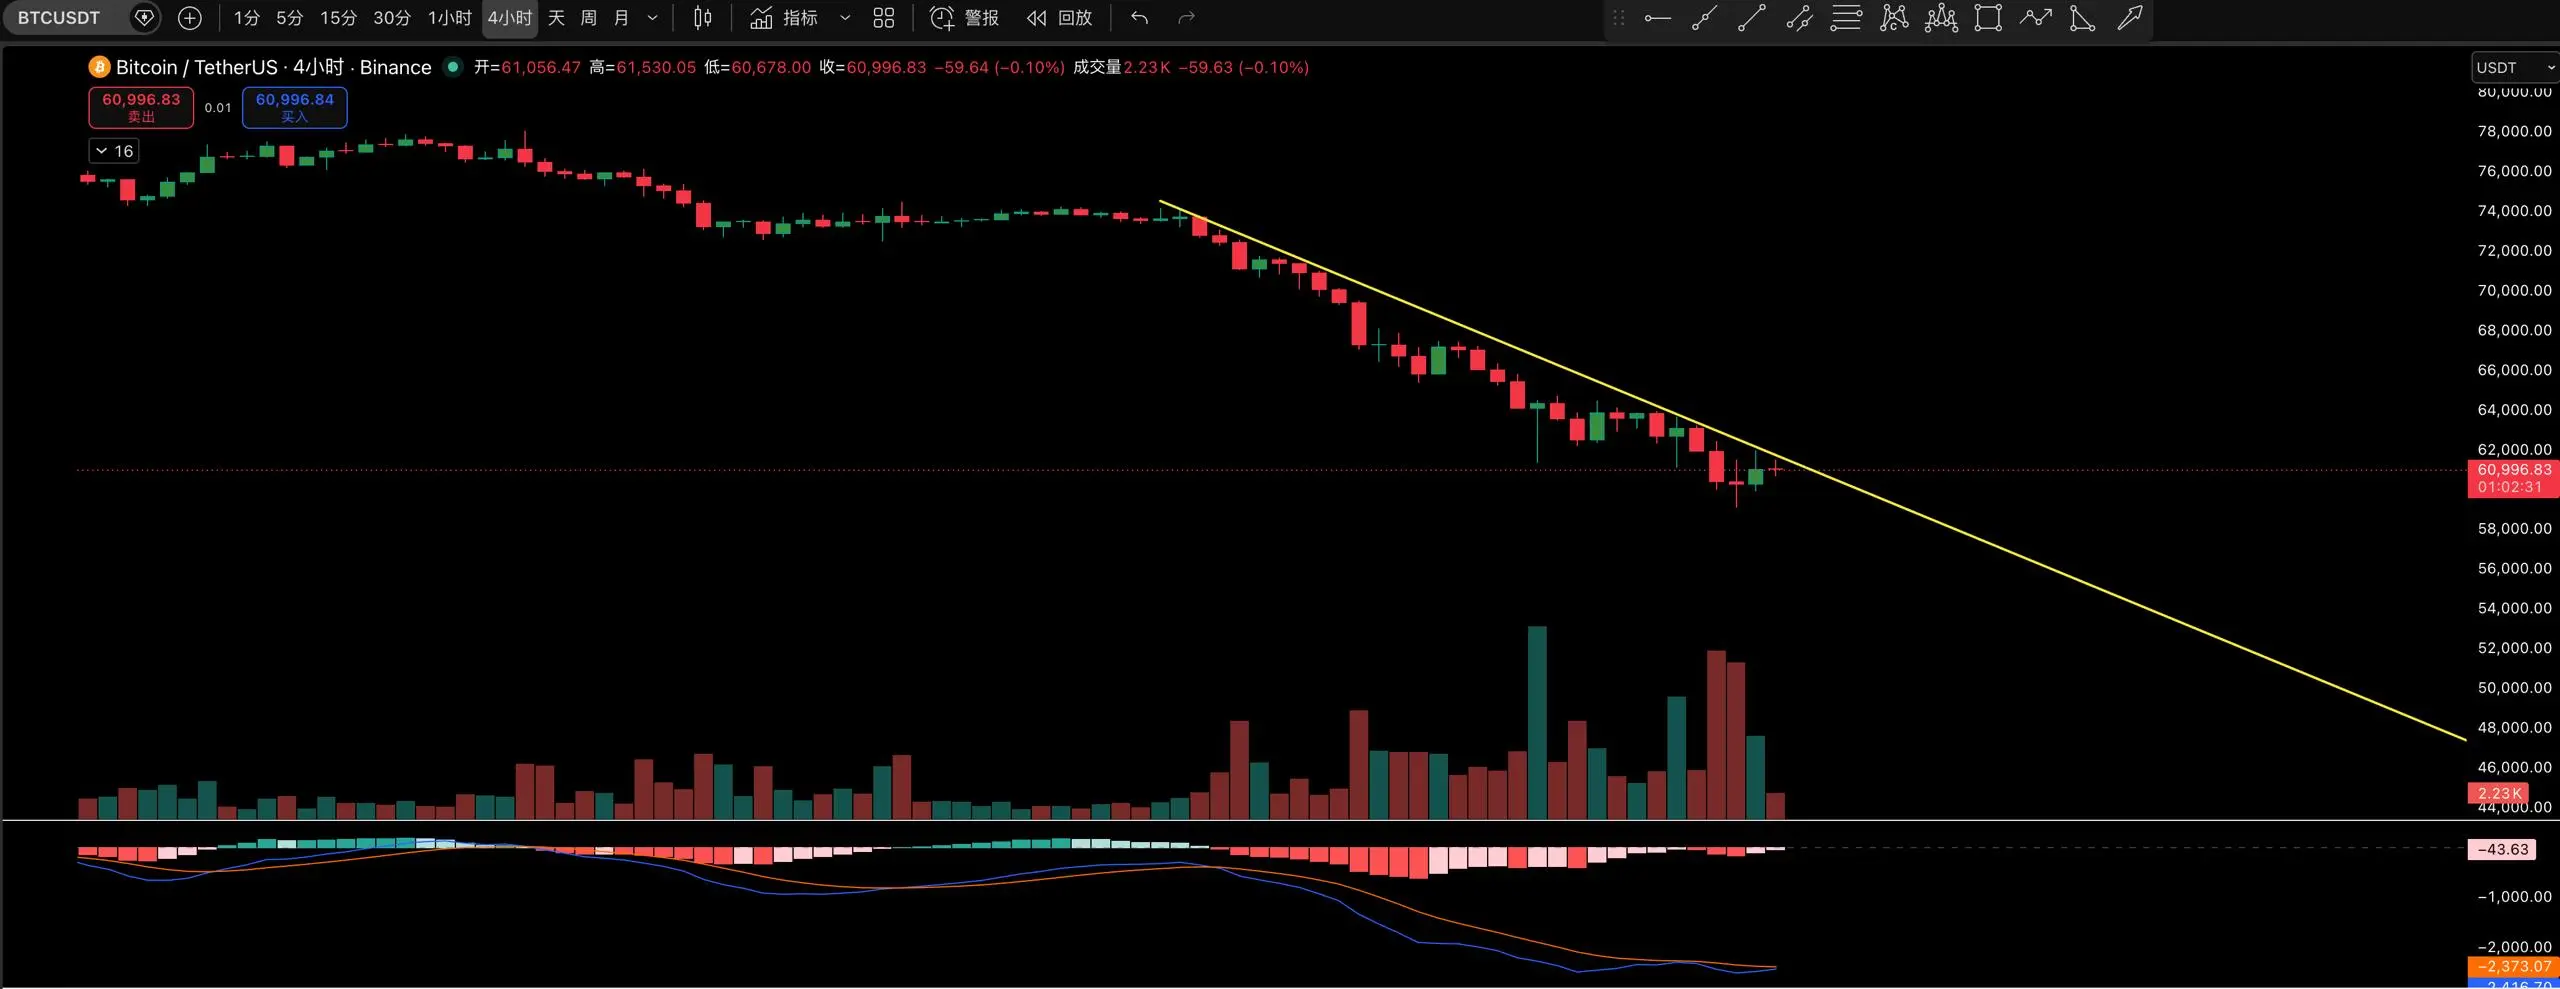
Last night, the price spiked upward, sweeping some stop-losses and liquidity above 64,200, but did not establish a solid footing, then was pressured downward, closing near 63,500.
This indicates there is still room for short-term recovery, but the overall structure should still be viewed as a rebound correction, and a reversal cannot yet be confirmed.
From the news perspective, ETF outflows appear to be panic-driven on the surface, bu
BTC2.27%
View Original
post-image
post-image
  • Reward
  • Comment
  • Repost
  • Share
⭐ BTC Market Update Today we mentioned yesterday that the medium to long-term outlook remains bearish, but the short-term is bullish, and the rebound depends on volume support. Today’s validation is halfway: early morning, it indeed rebounded from around 62,500, reaching a high of 63,933, with BTC at 63,500, just below the rebound high point, pulling back. This position is very delicate.
The daily chart has closed two consecutive candles above 63,000, and the structure is still a oversold rebound within a downtrend, also within a range of oscillation in the daily structure. However, the lows
BTC2.27%
View Original
post-image
post-image
  • Reward
  • Comment
  • Repost
  • Share
Breaking news: $BTC #SpaceX认购规模超2500亿美元 SpaceXIPO is tomorrow. The largest IPO in history, with a record-breaking debut valuation of approximately $1.75 trillion, 4 times oversubscribed, and about 4,000 employees are expected to become millionaires.
BTC2.32%
View Original
post-image
post-image
  • Reward
  • Comment
  • Repost
  • Share
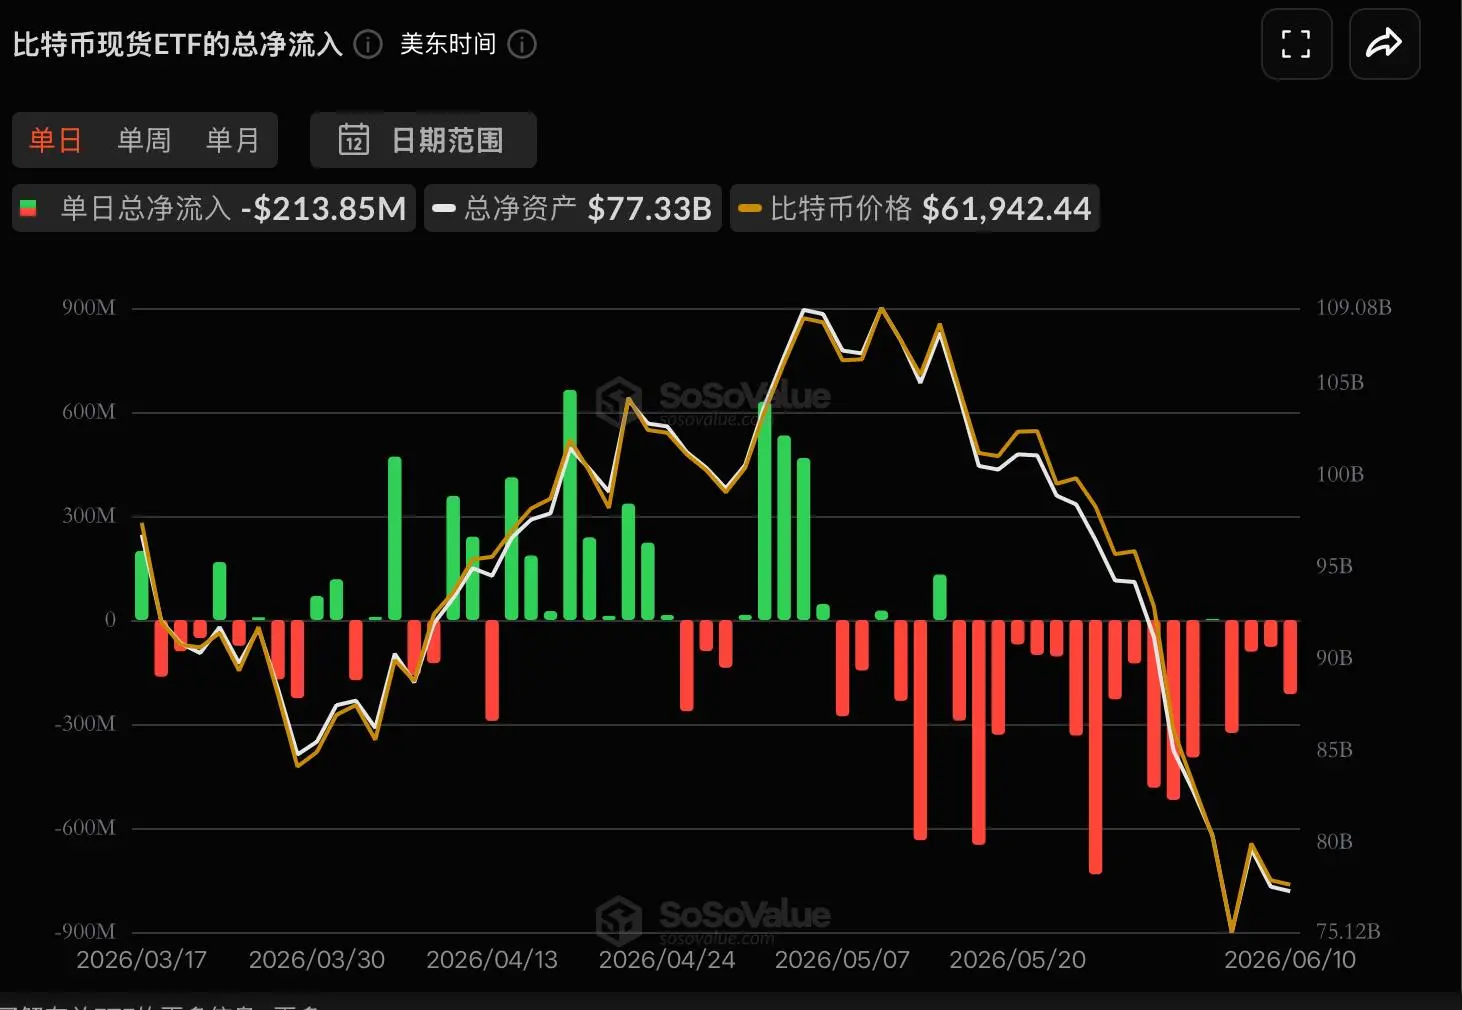
Bitcoin spot ETF experienced a net outflow of approximately $213 million yesterday, with the total net assets of the ETF dropping to $77.3 billion. Continuous net outflows have reduced buying pressure at high levels, making market rebounds more easily suppressed. $BTC
BTC2.32%
View Original
post-image
  • Reward
  • Comment
  • Repost
  • Share
⭐ BTC Today’s Market Update
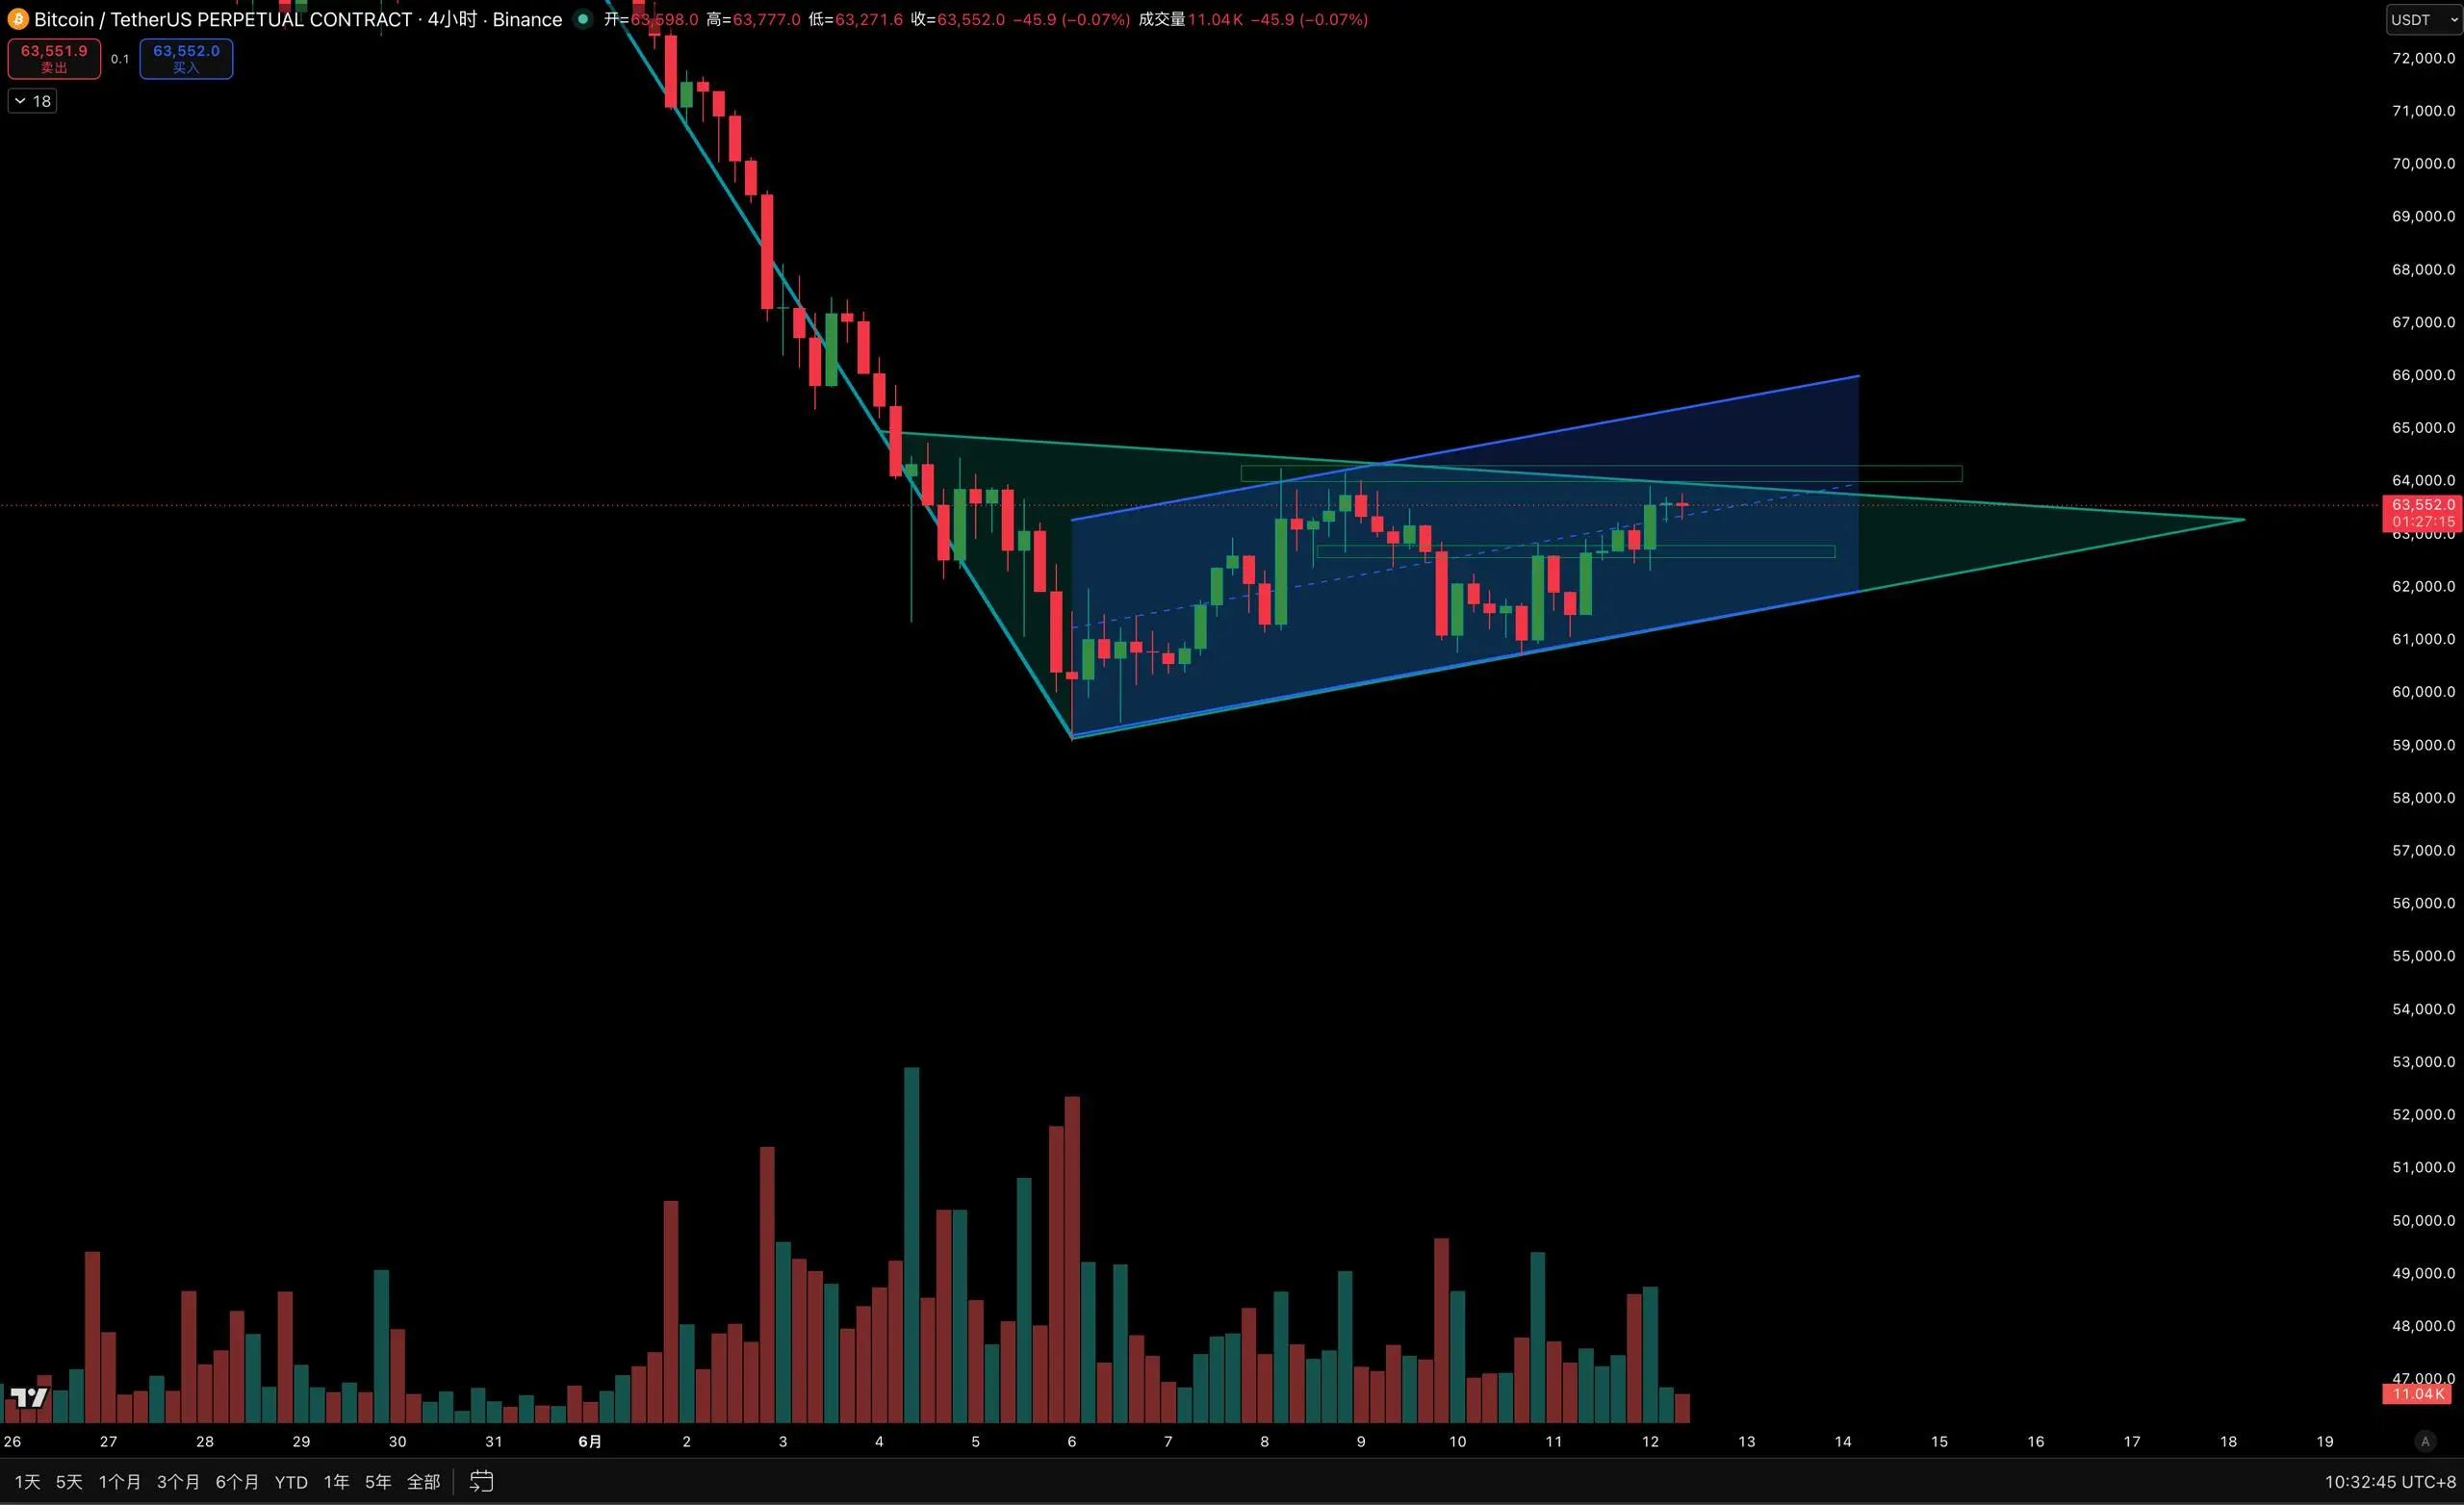
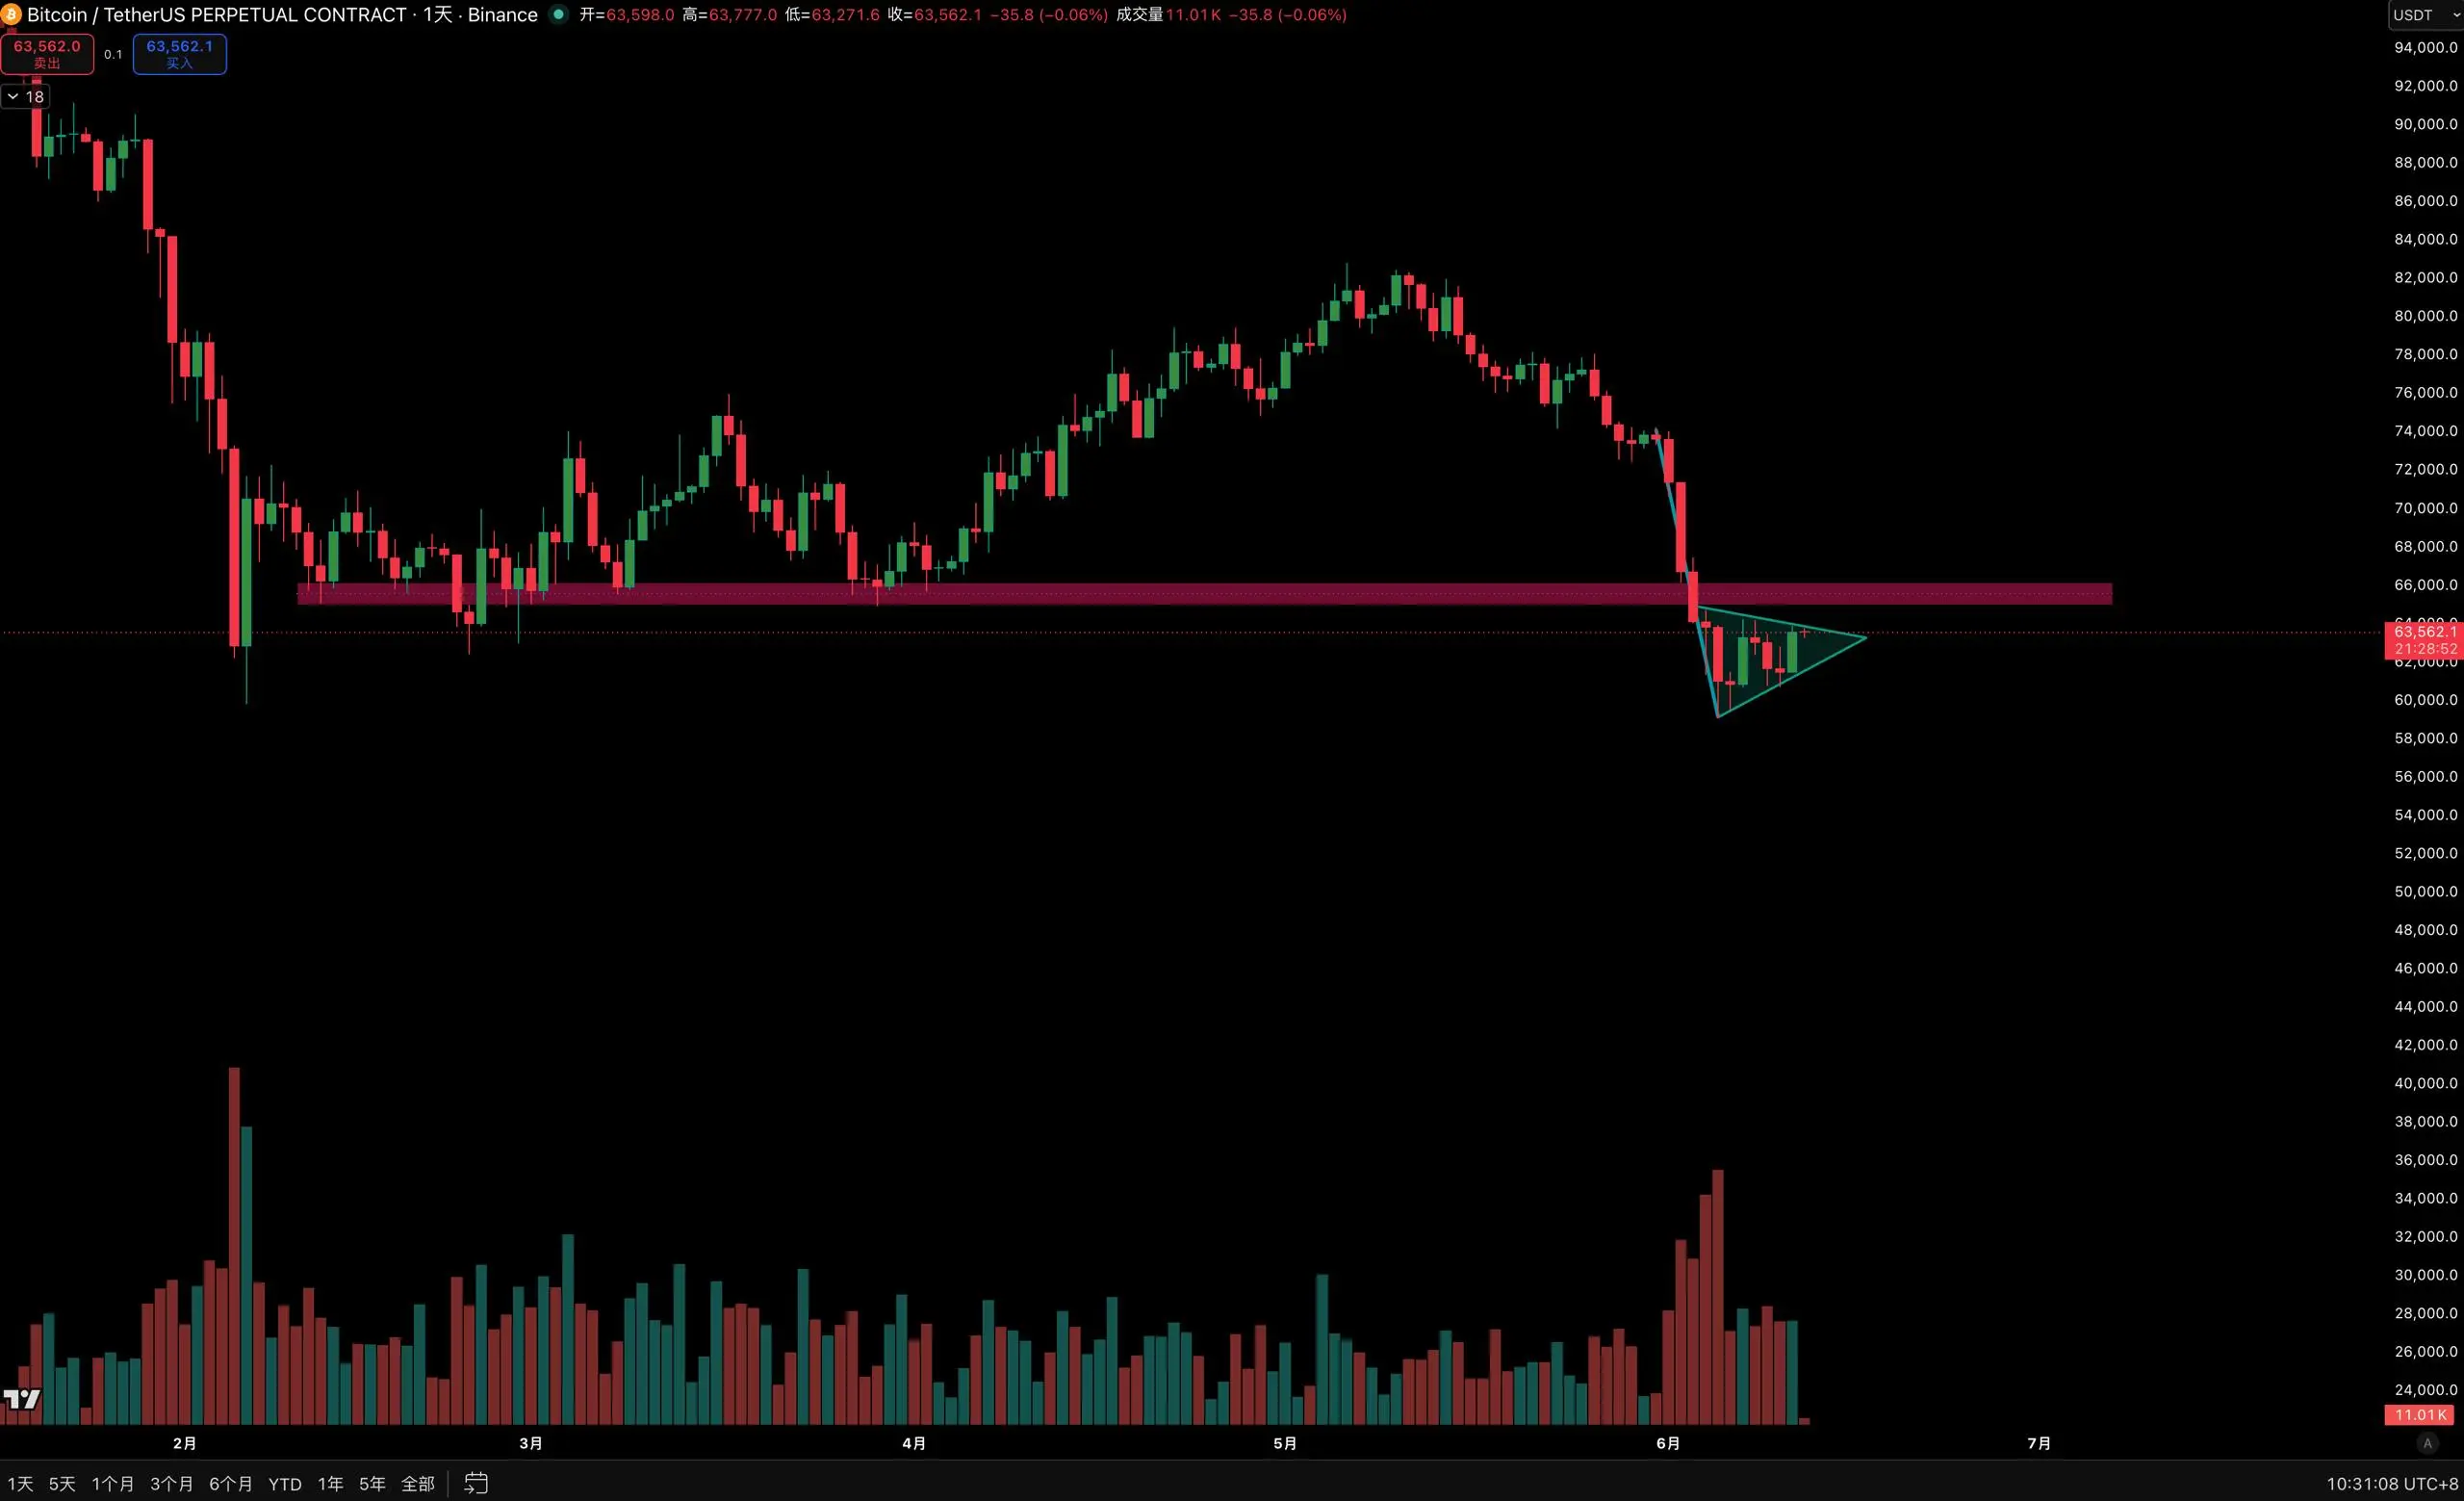
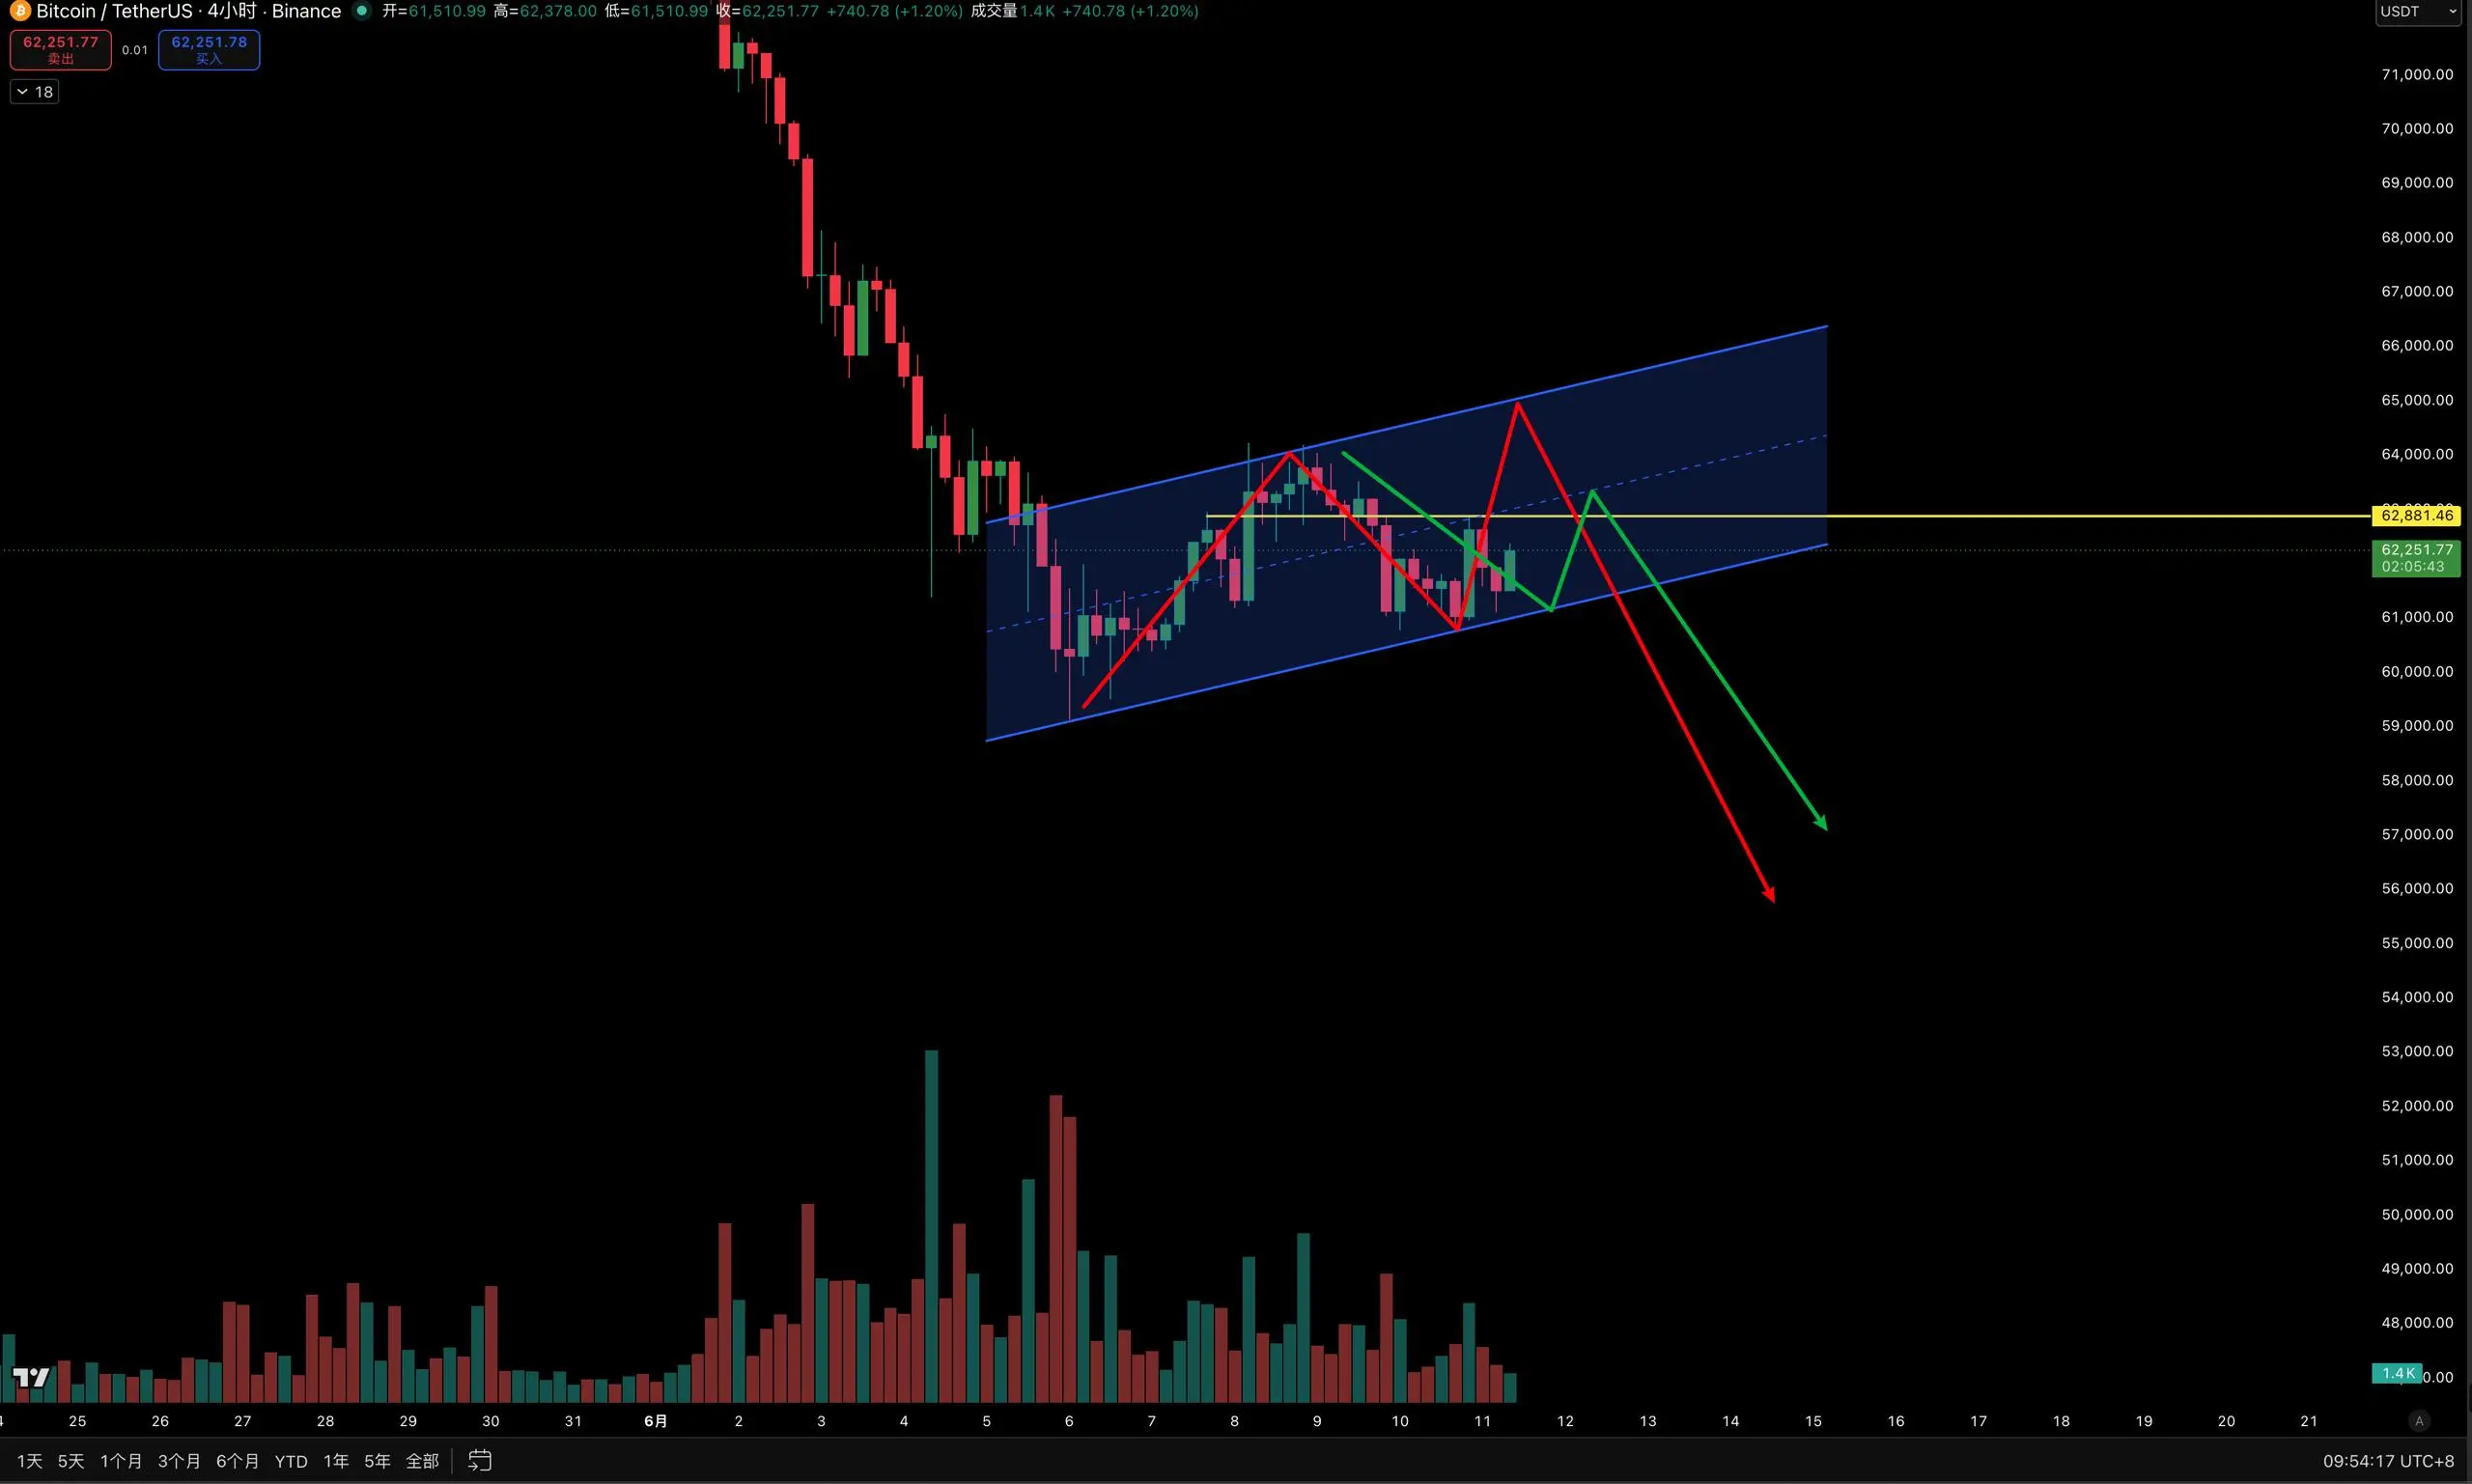
From a daily chart perspective, the structure remains bearish and has not changed. The key resistance lies around the upper boundary of the daily range at 62,800-64,200. If price can hold steady here, there is a chance in the short term to probe higher levels. For support below, watch the area near the previous low around 59,100—this is the bulls’ last line of defense in the near term. Once it breaks, it could accelerate a test toward 56,000 and even 55,500. The moving average system is arranged in a bearish order, and the MACD has been running below the zero axis,
BTC2.27%
View Original
post-image
  • Reward
  • Comment
  • Repost
  • Share
⭐ BTC Today's Market Update
Bitcoin, after breaking below 62,800, the selling pressure in the market continues to increase, and the short-term rebound strength is insufficient, so further downward movement should be watched. Today, the overall trend remains weak and volatile, with no clear signs of a bottoming out. On the daily chart, the MA20 and MA60 form a death cross trend, which is a typical bearish alignment. Yesterday closed with a small bearish candle, and although it did not break below the previous low of 60,500, the rebound high only reached 62,253, indicating very weak bullish mome
BTC2.27%
View Original
post-image
post-image
  • Reward
  • Comment
  • Repost
  • Share
⭐ BTC Today's Market Update
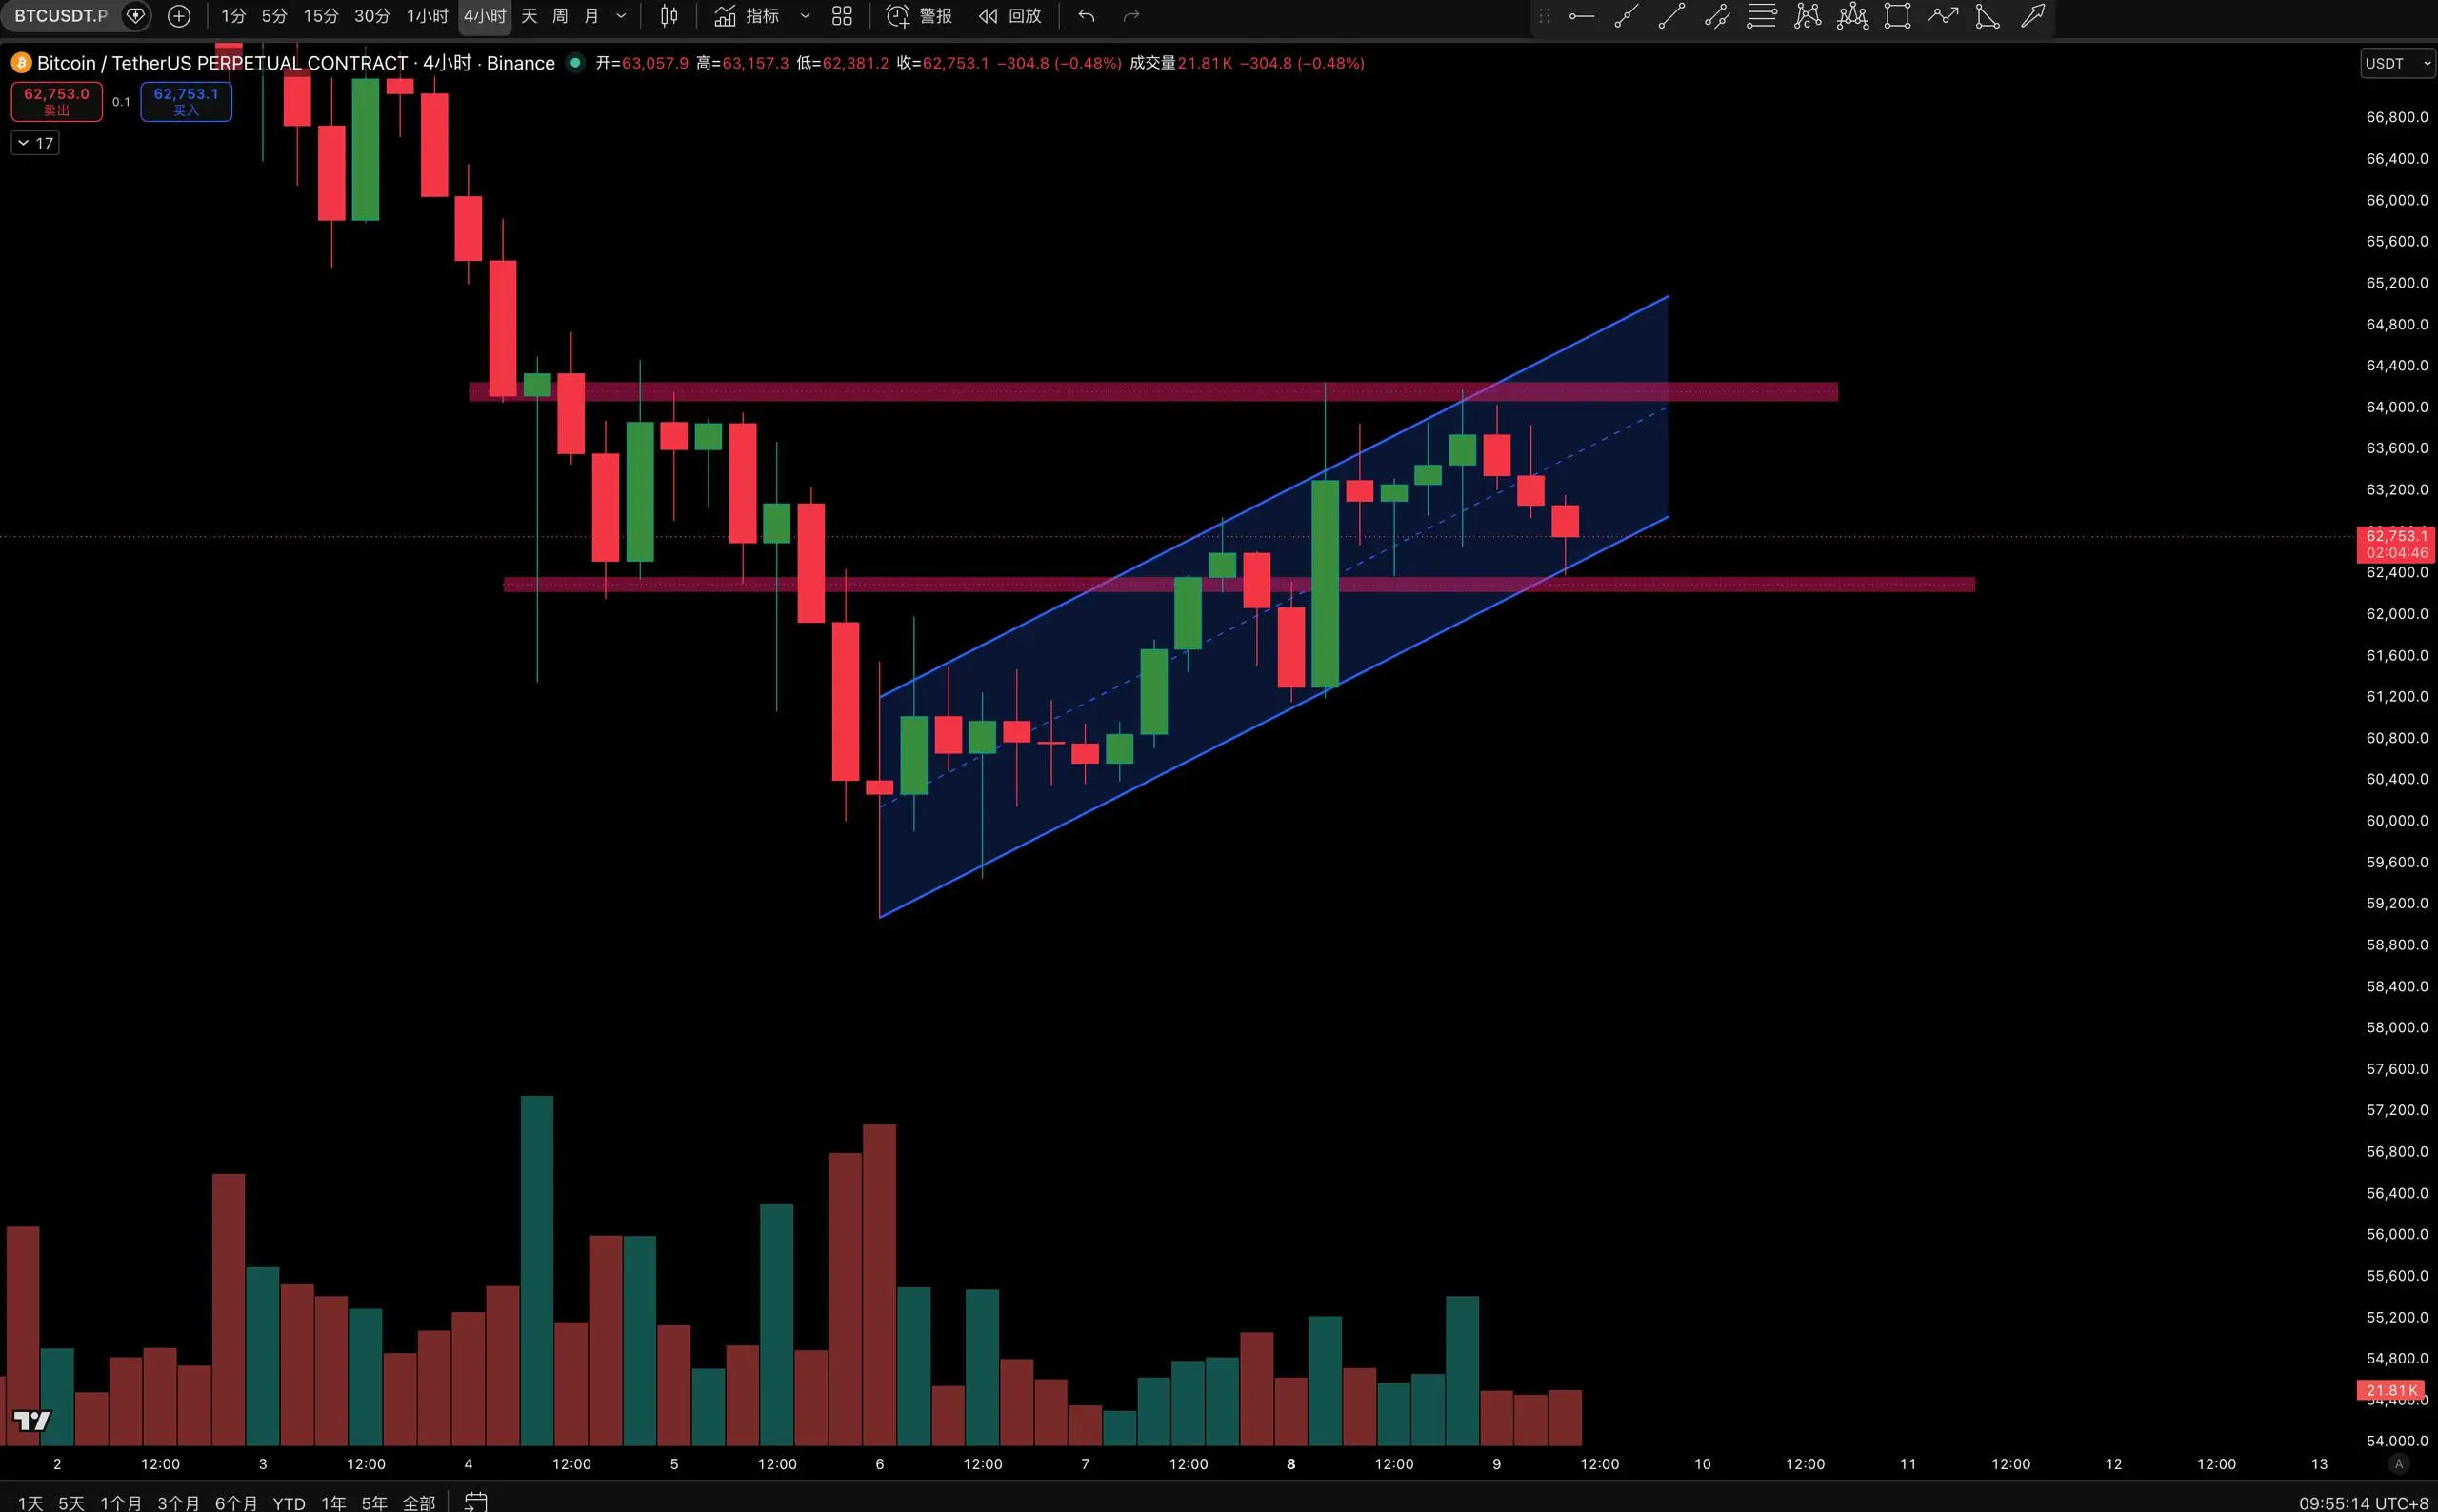
Yesterday, Bitcoin rebounded around 62,400, and the rebound again touched 64,200 but was blocked and pulled back. This level is a very strong resistance. Currently, it is consolidating around 62,600. After forming a bottom pattern on the daily chart two days ago, a small bearish candle was mentioned yesterday. Overall, it is oscillating within a small range. The bearish trend is still present, but the rebound is relatively weak, more like a push after being oversold.
The 4-hour price is supported by an upward channel, with the lower boundary around 62,400, which
BTC2.32%
View Original
post-image
post-image
  • Reward
  • Comment
  • Repost
  • Share
⭐ BTC Today's Market Update
Last night, Bitcoin experienced a strong rebound amid geopolitical turmoil. Affected by news related to Iran, market risk aversion and short-term short covering occurred simultaneously, with BTC price quickly bouncing from around 61,000 to approximately 64,200, indicating a short-term recovery in bullish sentiment. However, from today's market view, this rebound cannot yet be defined as a reversal.
On the daily chart, BTC remains in a bearish structure overall, with the current price still oscillating within the 59,000-64,200 range, without a true breakthrough of
BTC2.27%
View Original
post-image
post-image
  • Reward
  • Comment
  • Repost
  • Share
⭐ BTC Today's Market Update
Bitcoin has temporarily held the $60k level over the past couple of days, but the biggest issue with the rebound is: trading volume has not clearly increased. Although the price pulled back from $59,000 to around $61,700, the hourly bullish candles are noticeably shrinking in volume, indicating more short covering and some bottom-fishing funds testing the waters, rather than a strong rally. From the daily chart, BTC is still in a downward structure, with the price oscillating narrowly between $60,000 and $61,700. The daily MACD has not yet shown a clear convergence
BTC2.27%
View Original
post-image
post-image
  • Reward
  • Comment
  • Repost
  • Share
⭐ BTC Today's Market Update
Bitcoin, dragged down again last night by a sharp decline in the US stock market, tested around 60k, but quickly rebounded above 61,000 this morning, showing that the support at the 60k level still exists. However, market sentiment remains cautious, with expectations of rate hikes increasing after the non-farm payroll data exceeded expectations, and macroeconomic pressures persist. On the daily chart, BTC is currently in a flag pattern, with the 60k level below being a key support tested multiple times recently. Yesterday, a bearish candle with a lower shadow was fo
BTC2.32%
View Original
post-image
post-image
  • Reward
  • Comment
  • Repost
  • Share
  • Pinned