ASongJin'an

vip
On-chain Analyst
Market Analyst
Crypto Market Researcher
Focus on contract trading waves, long-term, risk control first!
7.7 BTC Evening Analysis
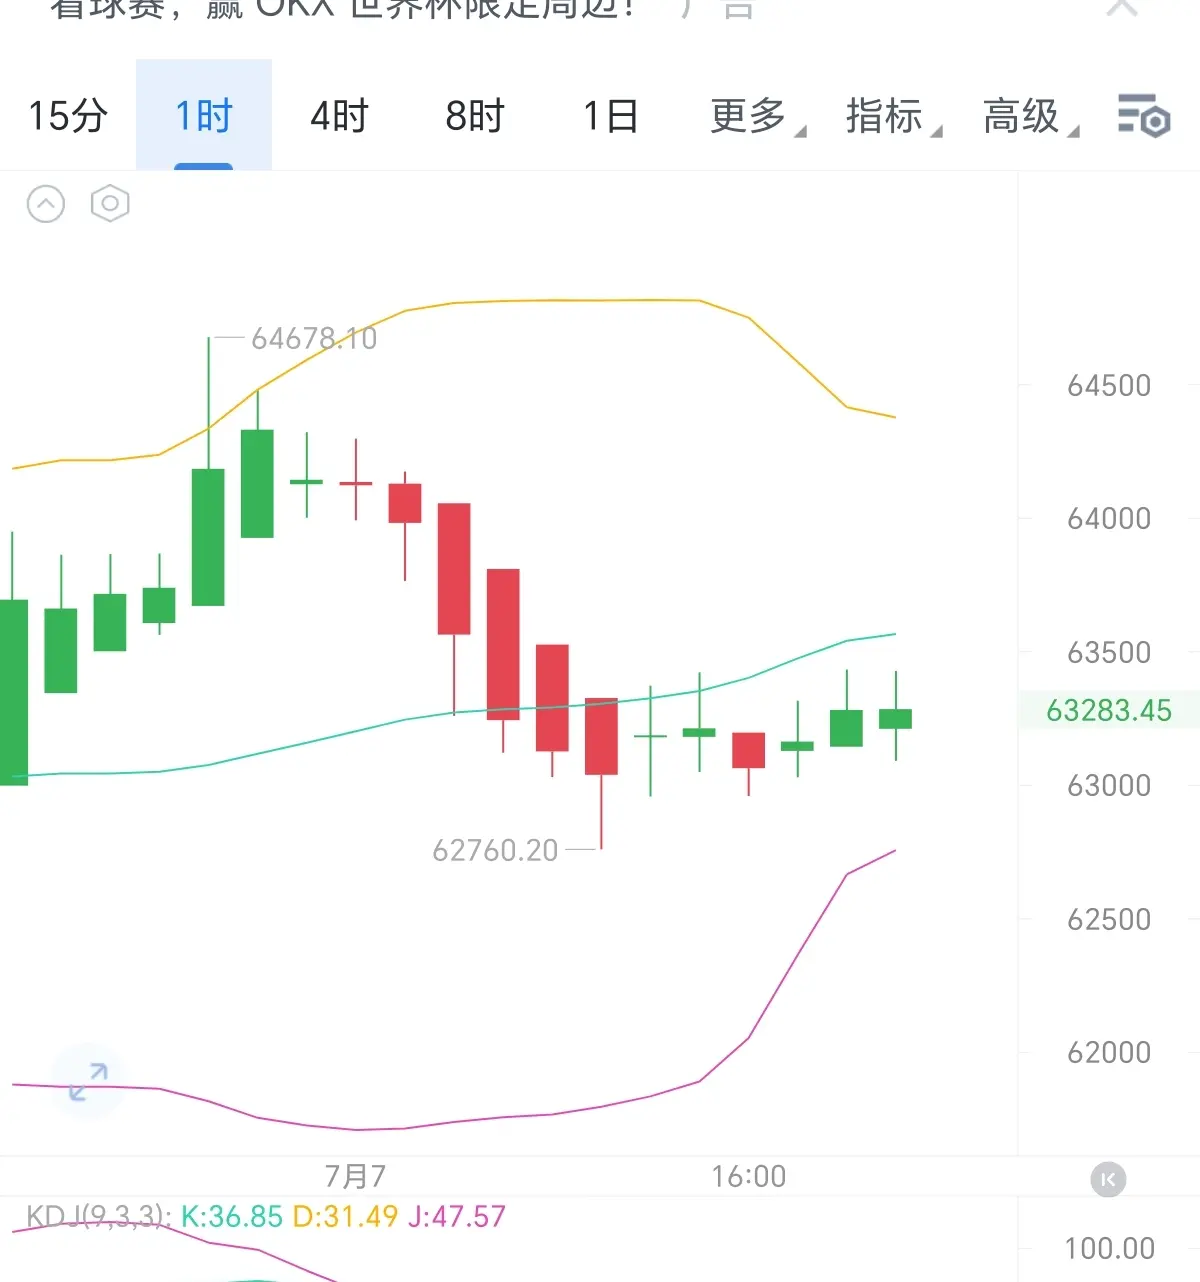
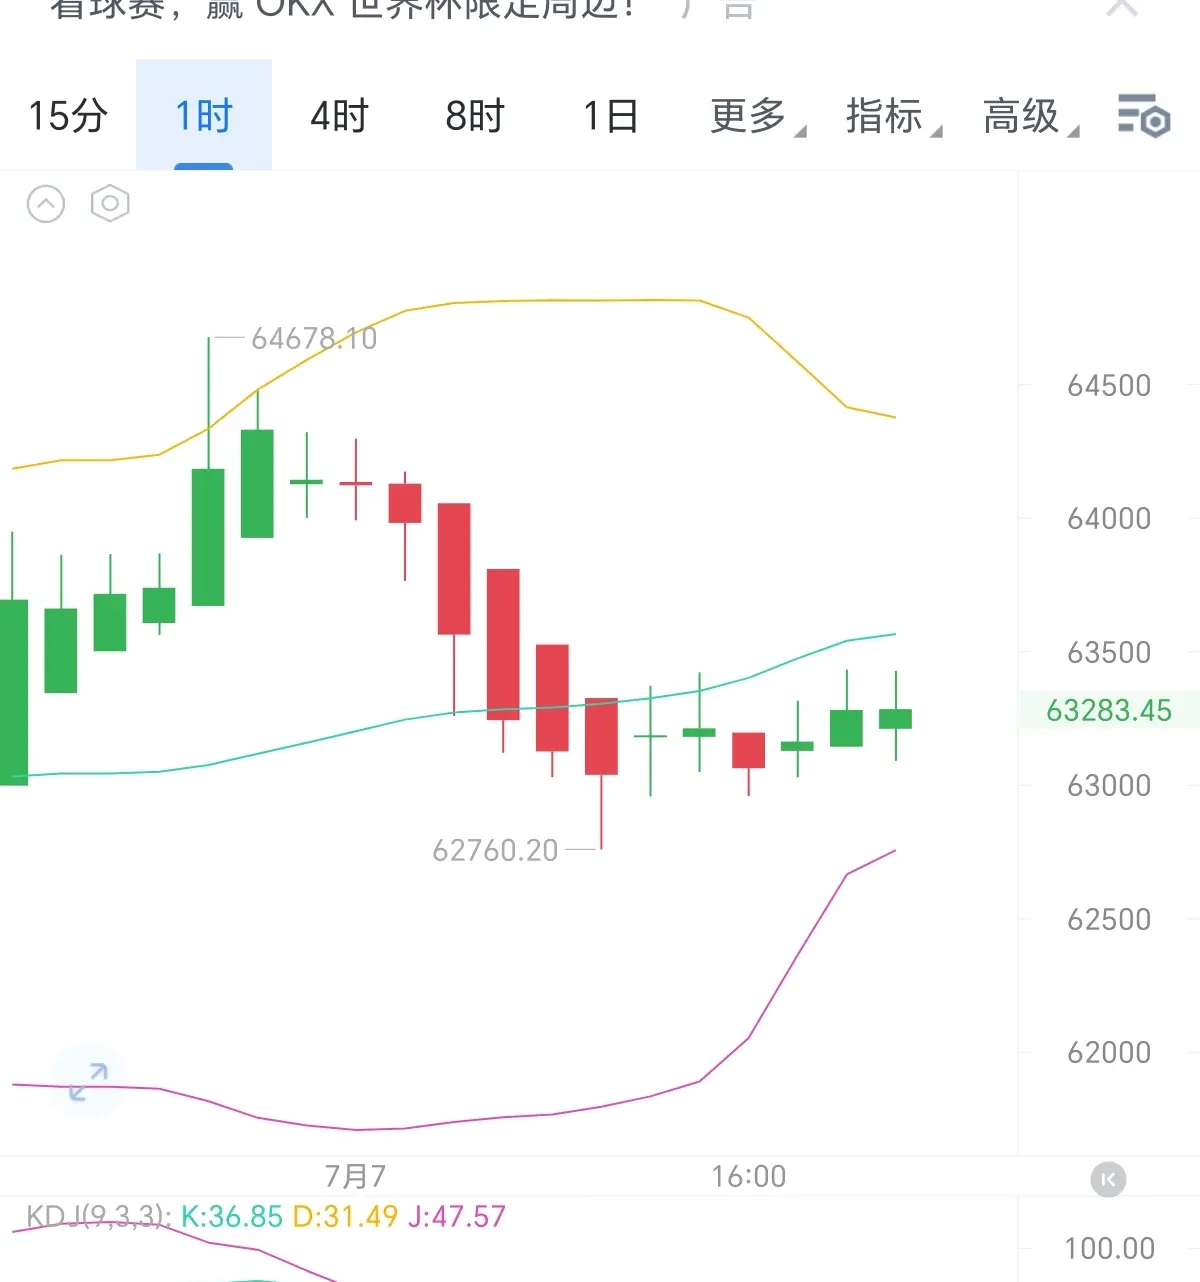
The hourly K-line, after surging to touch the band peak of 64678, saw a rapid decline in bullish momentum, forming a continuous bearish pullback structure. It retraced to 62760 to complete a concentrated release of bearish momentum. The current price is building a sideways consolidation pattern around 63283. The upper Bollinger Band has turned downward, transforming from a previous support that boosted the uptrend into a strong resistance level. The middle Bollinger Band has absorbed the selling pressure and pullback, becoming the key demarcation line for the current l
ETH0.58%
BTC0.74%
View Original
post-image
  • Reward
  • Comment
  • Repost
  • Share
7.7 BTC Evening Analysis
On the one-hour K-line, after surging to the band high of 64678, the bullish momentum quickly faded, forming a continuous bearish decline structure. The retracement to 62760 completed the concentrated release of bearish momentum, and the current price is building a horizontal consolidation pattern around 63283. The upper Bollinger Band has turned downward, shifting from a previous upward support to a strong resistance level, while the middle Bollinger Band has absorbed the selling pressure and become a key demarcation line for the current long-short battle. The market
ETH0.58%
SOL0.55%
View Original
post-image
  • Reward
  • Comment
  • Repost
  • Share
7.7 BTC Morning Analysis
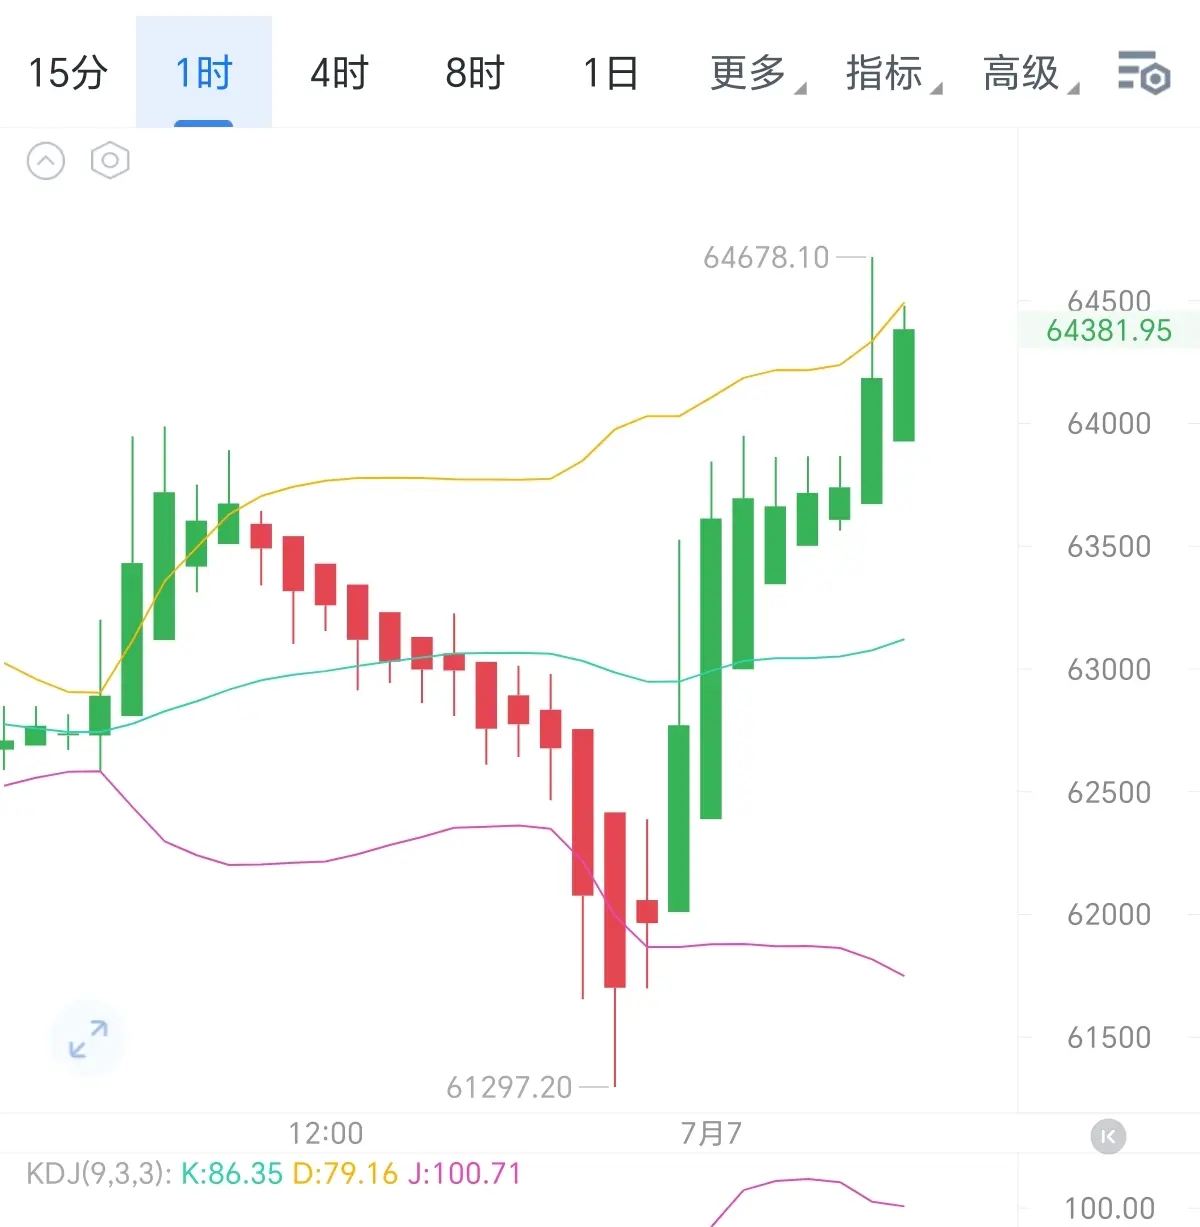
This week, BTC has formed a bottom-finding and rebound V-shaped reversal wave. The early drop to 61297 constructed the bear-trap-bottom divergence inflection point. Incremental buy-side orders entered the market, pushing the price higher step by step. It then unfolded in an impulsive upward move along the outer extension of the upper Bollinger Band, reaching a peak of 64678. After that, the upper band encountered pressure-induced passivation. The current candlestick has closed as a shooting-star-type pullback candle, indicating that the bullish push’s energy has entere
SOL0.55%
ETH0.58%
BTC0.74%
View Original
post-image
  • Reward
  • Comment
  • Repost
  • Share
7.6 ETH Analysis
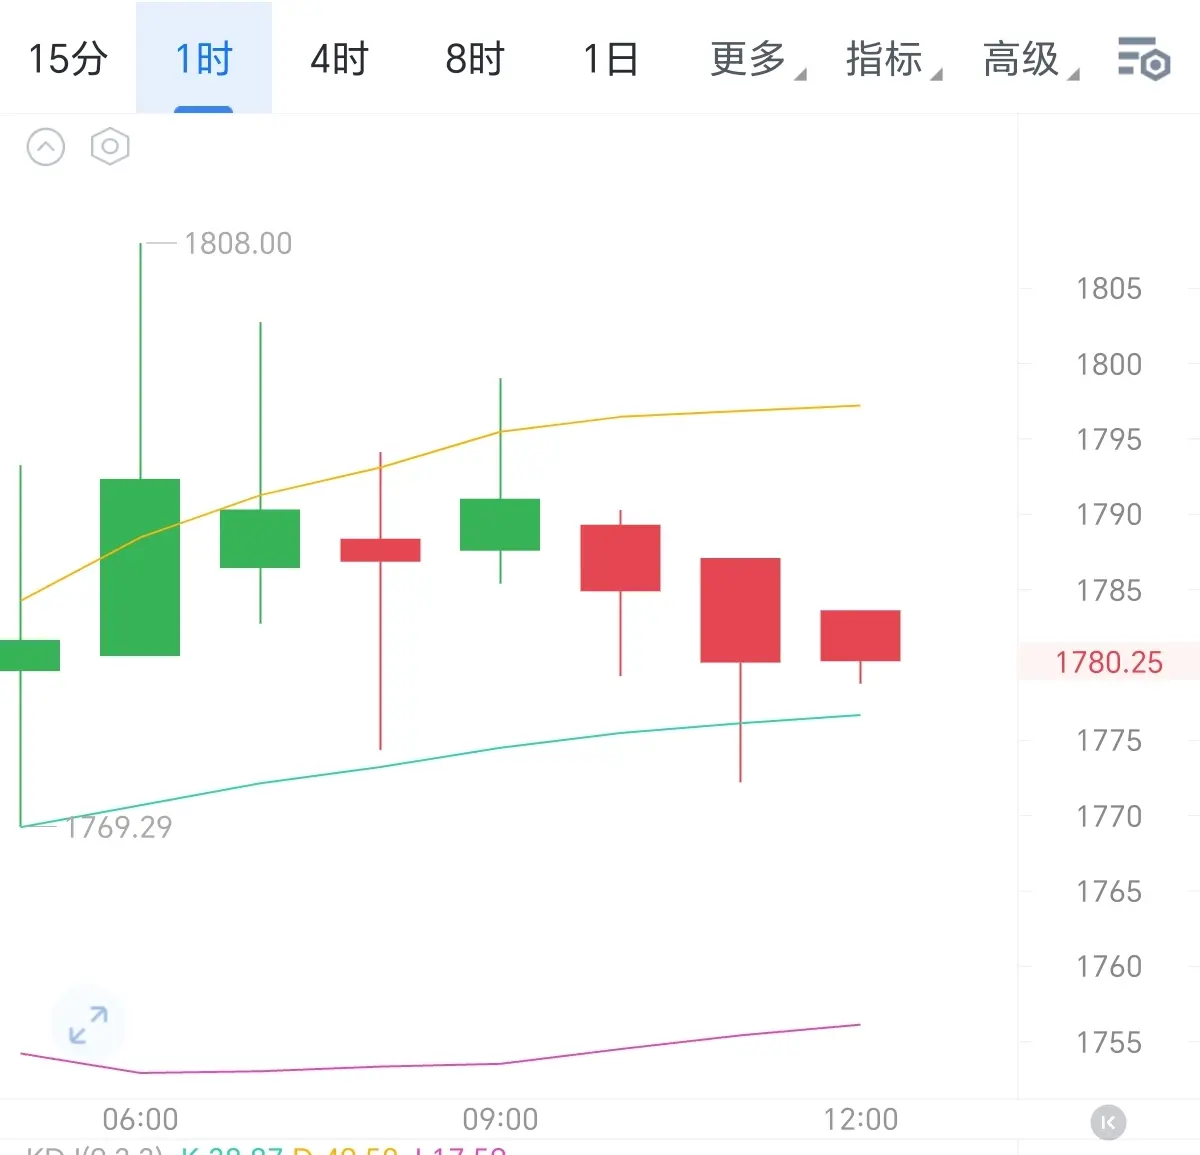
After the ETH hourly chart surged to a high of 1808, bullish momentum completely faded. Highs continued to move lower, forming a step-down decline pattern with consecutive bearish candles. Currently at 1780, the price is under pressure from the short-term yellow moving average, which has shifted from support to resistance. Only the mid-term moving average at 1775 provides short-term support. Multiple wicks probing lower indicate weak buying interest at the bottom, with extremely weak rebound strength. Structurally, the morning rally was a impulse move, lacking follow-up increm
BTC0.74%
SOL0.55%
View Original
post-image
  • Reward
  • 2
  • Repost
  • Share
CloudShadow6:
Can it reach 1650 next week?
View More
7.6 BTC Analysis
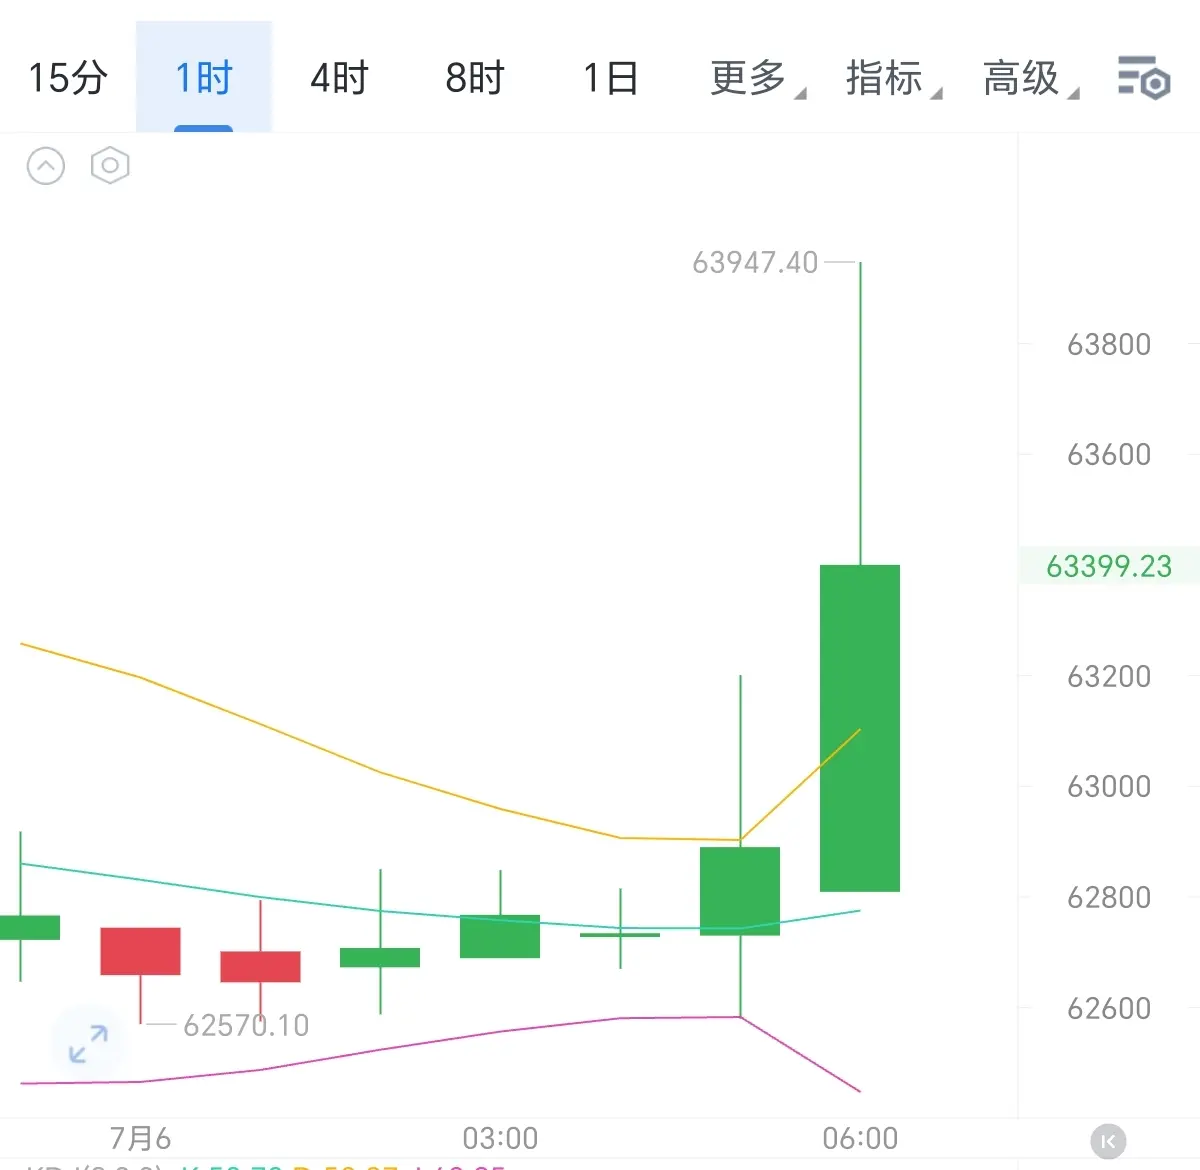
Hourly chart saw a large bullish candle with volume directly breaking through the prolonged consolidation range at 62800. The bullish impulse touched 63988, forming an upper shadow resistance structure. The core driving force of this upward move is the concentrated short-covering squeeze of leveraged shorts in the preceding range, combined with trend quantitative triggers activating long signals, and speculative off-market funds following in, creating triple buying resonance. Indicators have fully entered the heavily overbought zone, with RSI6 reaching 91.76, significantly bre
BTC0.74%
ETH0.58%
View Original
post-image
RON JON
RON JONRON JON
MC:$2.35KHolders:2
0.00%
  • Reward
  • Comment
  • Repost
  • Share
### 7.4 BTC Analysis
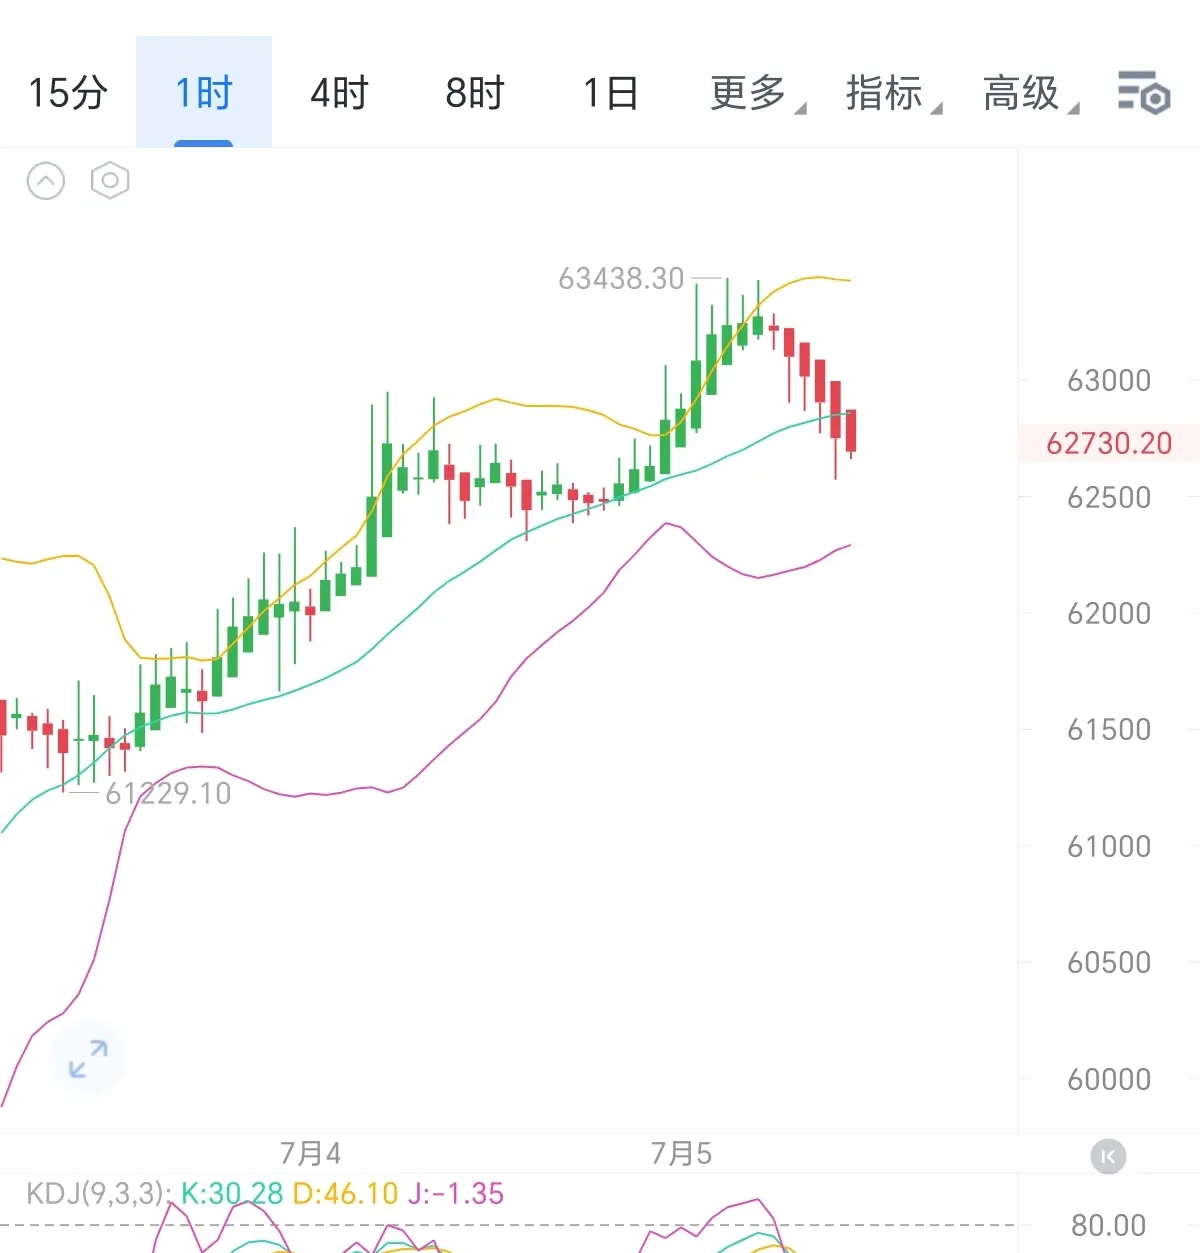
On the one-hour timeframe, BTC’s long-side bullish impulse is topping out and exhausting. After the 63438 peak forms an early-stage double-top pattern, price continues to drift lower under persistent downward pressure. The current price of 62730 has broken through the Bollinger Band midline center. The prior bullish defense threshold has flipped and turned into a selling-pressure holding zone. The upper Bollinger Band slope has turned downward, with convergence underway. The expansion cycle of the upward channel is completely over, and the unilateral bullish trend has ente
SOL0.55%
View Original
post-image
  • Reward
  • Comment
  • Repost
  • Share
7.2 ETH Analysis
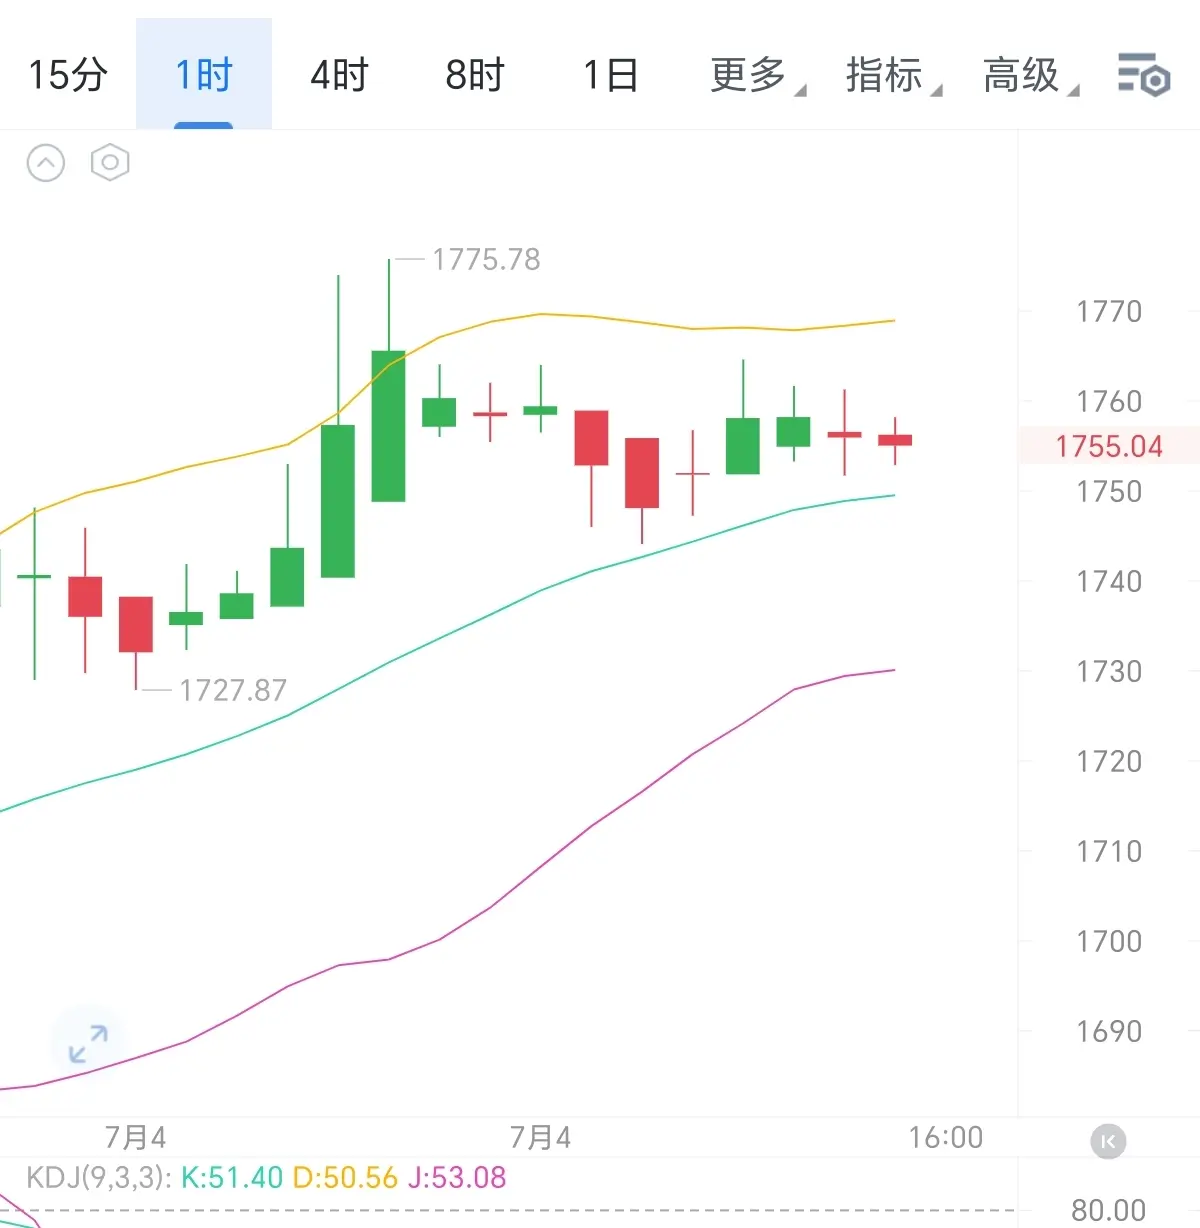
On the hourly chart, the Bollinger Bands overall maintain a bullish upward channel: the lower band continues to rise steadily. After a prior spike to 1775, the price pulled back and moved sideways above the middle band. The upper band flattens, forming a short-term pressure band. The underlying basis of the bullish trend is still present, but upside momentum has clearly weakened. The accompanying KDJ three lines are sticking together and winding around each other; the values are all in the mid-range, with no clear bullish or bearish divergence signal. This is a phase of post-r
ETH0.58%
View Original
post-image
GPC
GPCGPC TOKEN
MC:$2.31KHolders:1
0.00%
  • Reward
  • Comment
  • Repost
  • Share
7.4 BTC Analysis
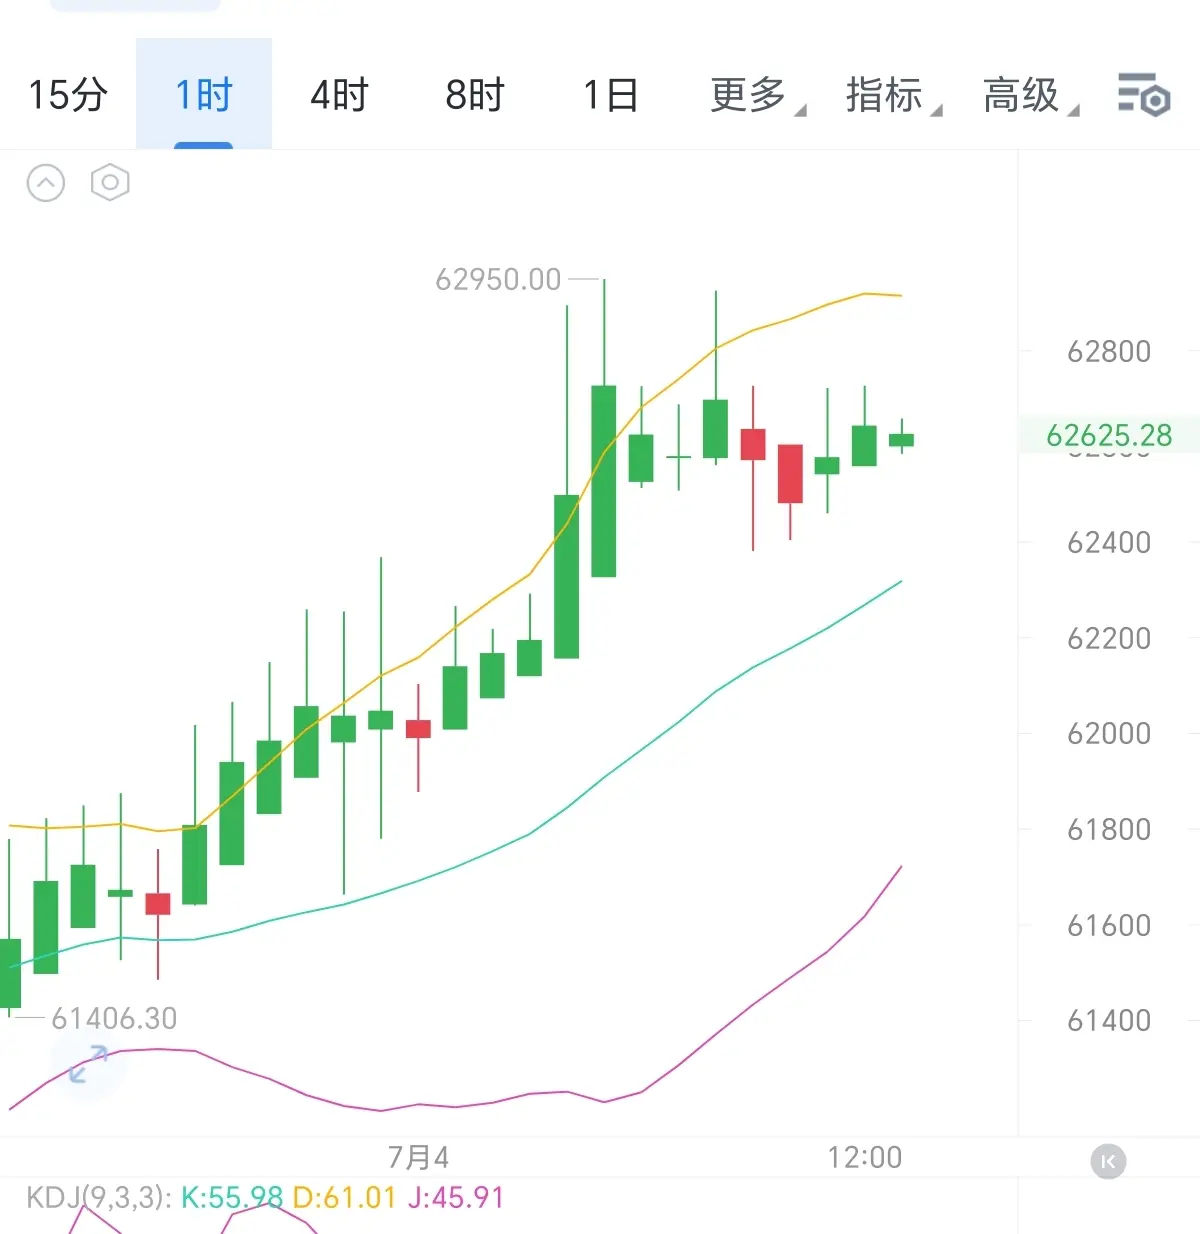
On the hourly cycle, the moving averages show a healthy bullish divergence and the short- and long-cost tracks are rising in sync. Since the market started its rally from 61406, it has pushed to 62950 and met resistance; bullish momentum has weakened in stages. Repair-and-pullback candlesticks have emerged. The current price is holding above the short-term cost track, and the main upward trend has not been broken.
At the high, resistance was marked by a “shooting” pressure-type candlestick. Then, the next two bearish candles completed digesting the rise. The current candlestic
BTC0.74%
ETH0.58%
View Original
post-image
  • Reward
  • Comment
  • Repost
  • Share
7.3 BTC Afternoon Analysis
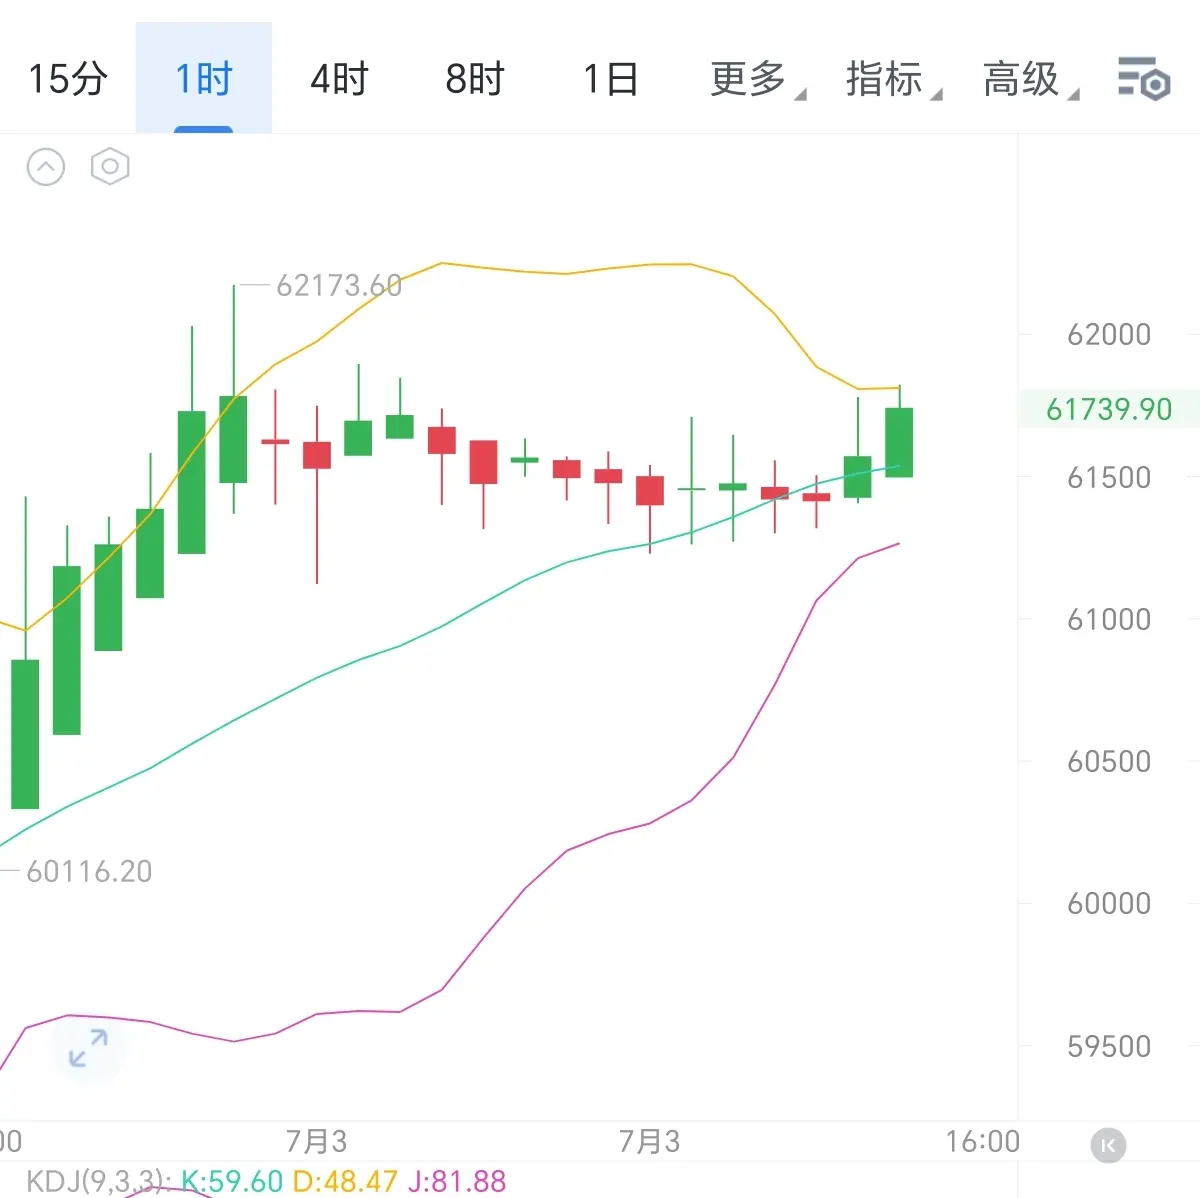
The one-hour chart Bollinger Band structure is clear. The upper yellow rail at 62173 forms a strong short-term resistance. The middle rail at 61500 has completed support and stabilized. The lower rail continues to diverge upward. The overall channel maintains a bullish upward structure, and the support zone below is solid.
After a round of high-level consolidation and pullback, the price formed a solid bullish candlestick based on the middle Bollinger Band, showing short-term bullish momentum. The current quote is 61739, with a small gap from the previous high resist
BTC0.74%
SOL0.55%
View Original
post-image
  • Reward
  • Comment
  • Repost
  • Share
**Contract Trapped Self-Rescue Guide — Four Moves from “Rooftop Wind” to “Street-Stall Skewers”**
Two big illusions in the crypto world: “This time is different” and “I can still hold on.” When you see your account’s unrealized loss turning green, don’t panic—everything’s already trapped, so let’s handle it gracefully.
**Style One: The Iron-Head Stubborn-Hold** — Turn off the K-line charts, uninstall the app, and believe that as long as you don’t close the position, the floating loss doesn’t count as a loss. Suitable for veterans with hearts that have survived bridge surgery and balances thick
View Original
post-image
  • Reward
  • Comment
  • Repost
  • Share
### 7.2 ETH Morning Analysis
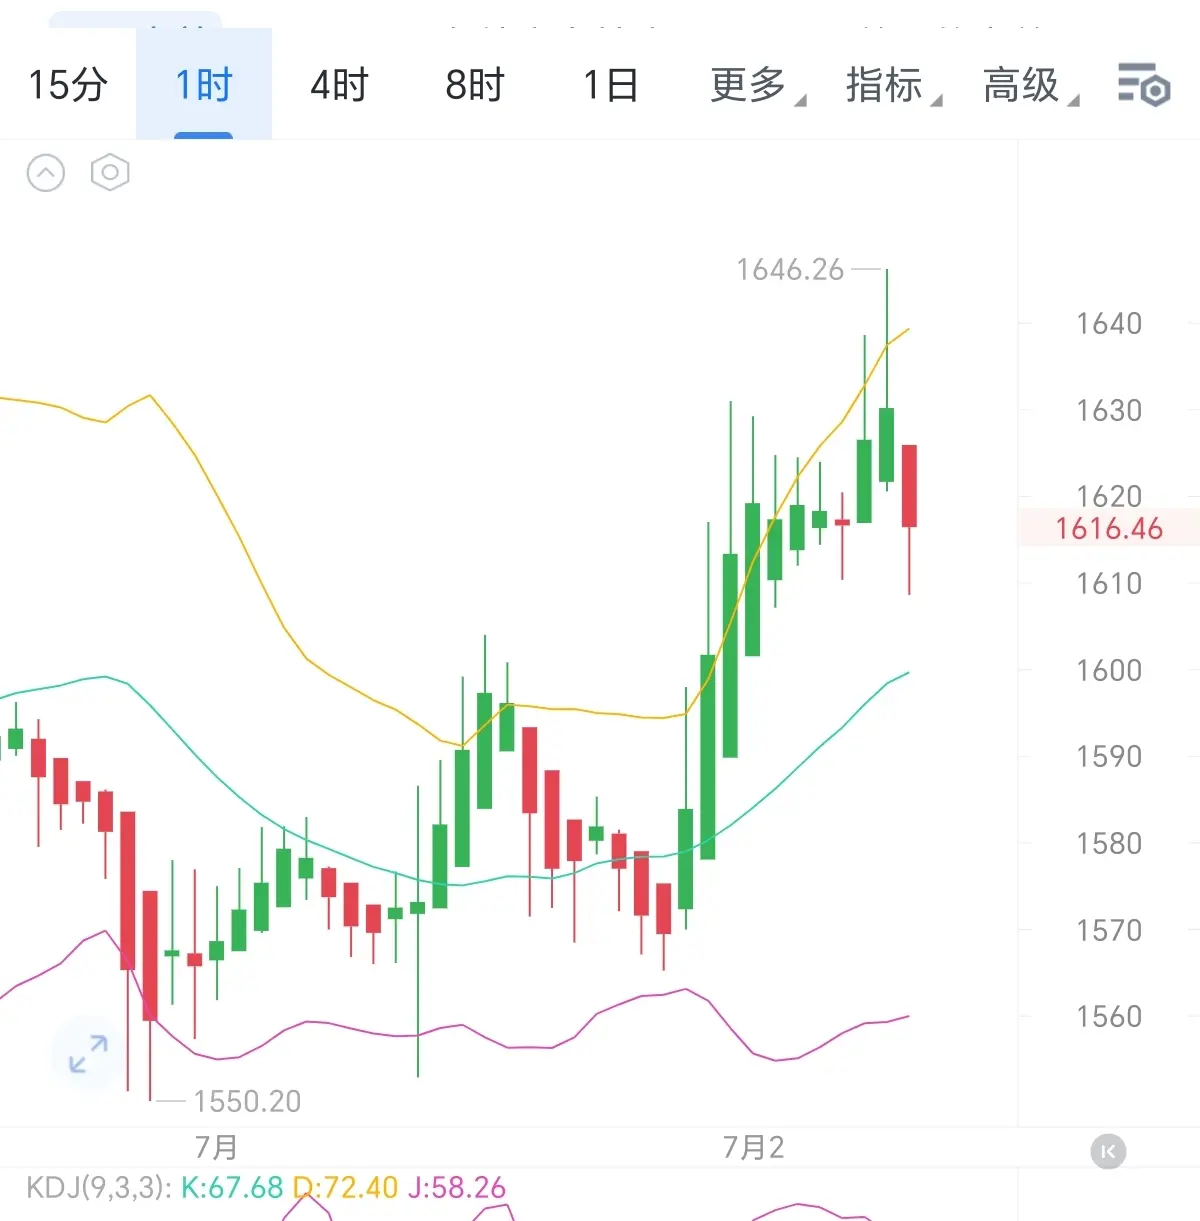
ETH formed a stalling shooting star at the peak of the 1646 stage, constructing a pulse-like trap top fractal structure driven by a bait to lure longs. The short-term moving average system has shifted from dynamic support into a threshold for bull-bear game. Above, the 1630–1640 zone has formed a dense distribution area of trapped positions, with sell-pressure from overhang and trapped chips.
The KD indicator is moving in the high-level stagnation zone. The J line breaks through the K and D lines from top to bottom, suggesting that the momentum histogram is about t
SOL0.55%
BTC0.74%
View Original
post-image
  • Reward
  • Comment
  • Repost
  • Share
7.2 BTC Morning Analysis
On the 1-hour cycle, the bullish push has topped out with clear signals. After the price surged to 61316, a very long upper-shadow candlestick printed. The bulls lack strength to hold the high level, and above the 61000 range, large sell orders worth tens of millions of dollars are lined up in advance—heavy selling pressure directly suppresses further upside space.
The KDJ indicator has entered the overbought zone. Bullish momentum has been overstretched, and there is a strong need for a downward dead-cross correction. The current round of continuous rally that started
BTC0.74%
View Original
post-image
  • Reward
  • 3
  • Repost
  • Share
Long-ShortEquityStrategyMaster:
595 then, don't 695 scare the handsome guy😱
View More
The trend is about to reverse. Can the bears make it to the other side?
At this point, quite a few people must be trapped in short positions around 59,000, right? Maybe even lower!
To be honest, purely looking at K-lines doesn't mean much right now—there are reasons for both up and down at this level. But since you're already trapped, you need a plan, not just suffer through it.
The current situation: 60,000 has been broken, a large number of long stop-loss orders have been triggered, and the short-term downward momentum continues. But the core issue today isn't whether 60,000 breaks—it's alre
BTC0.74%
ETH0.58%
View Original
post-image
post-image
PUMPNUE
PUMPNUEPUMPNUE
MC:$2.23KHolders:1
0.00%
  • Reward
  • Comment
  • Repost
  • Share
"Is the U.S. job market about to blow up?"
Tonight at 20:15, the ADP non-farm payrolls (small non-farm) will be released! Previous value 122k, expected only 118k — don't underestimate the 4k difference; it may be the last piece of the puzzle for the Fed to cut rates! If the data is below 118k, the dollar will dive directly, and gold may take off on the spot; if it unexpectedly exceeds 122k, bears won't be able to sleep tonight. At 8:15, either eat meat or noodles — are you ready? $BTC $GT $ETH #Gate完成141只股票股息派发 #Strategy拟回购股票 #Sharplink增持1万枚ETH
BTC0.74%
ETH0.58%
View Original
post-image
  • Reward
  • 1
  • Repost
  • Share
MrWhales艺怡:
follow me
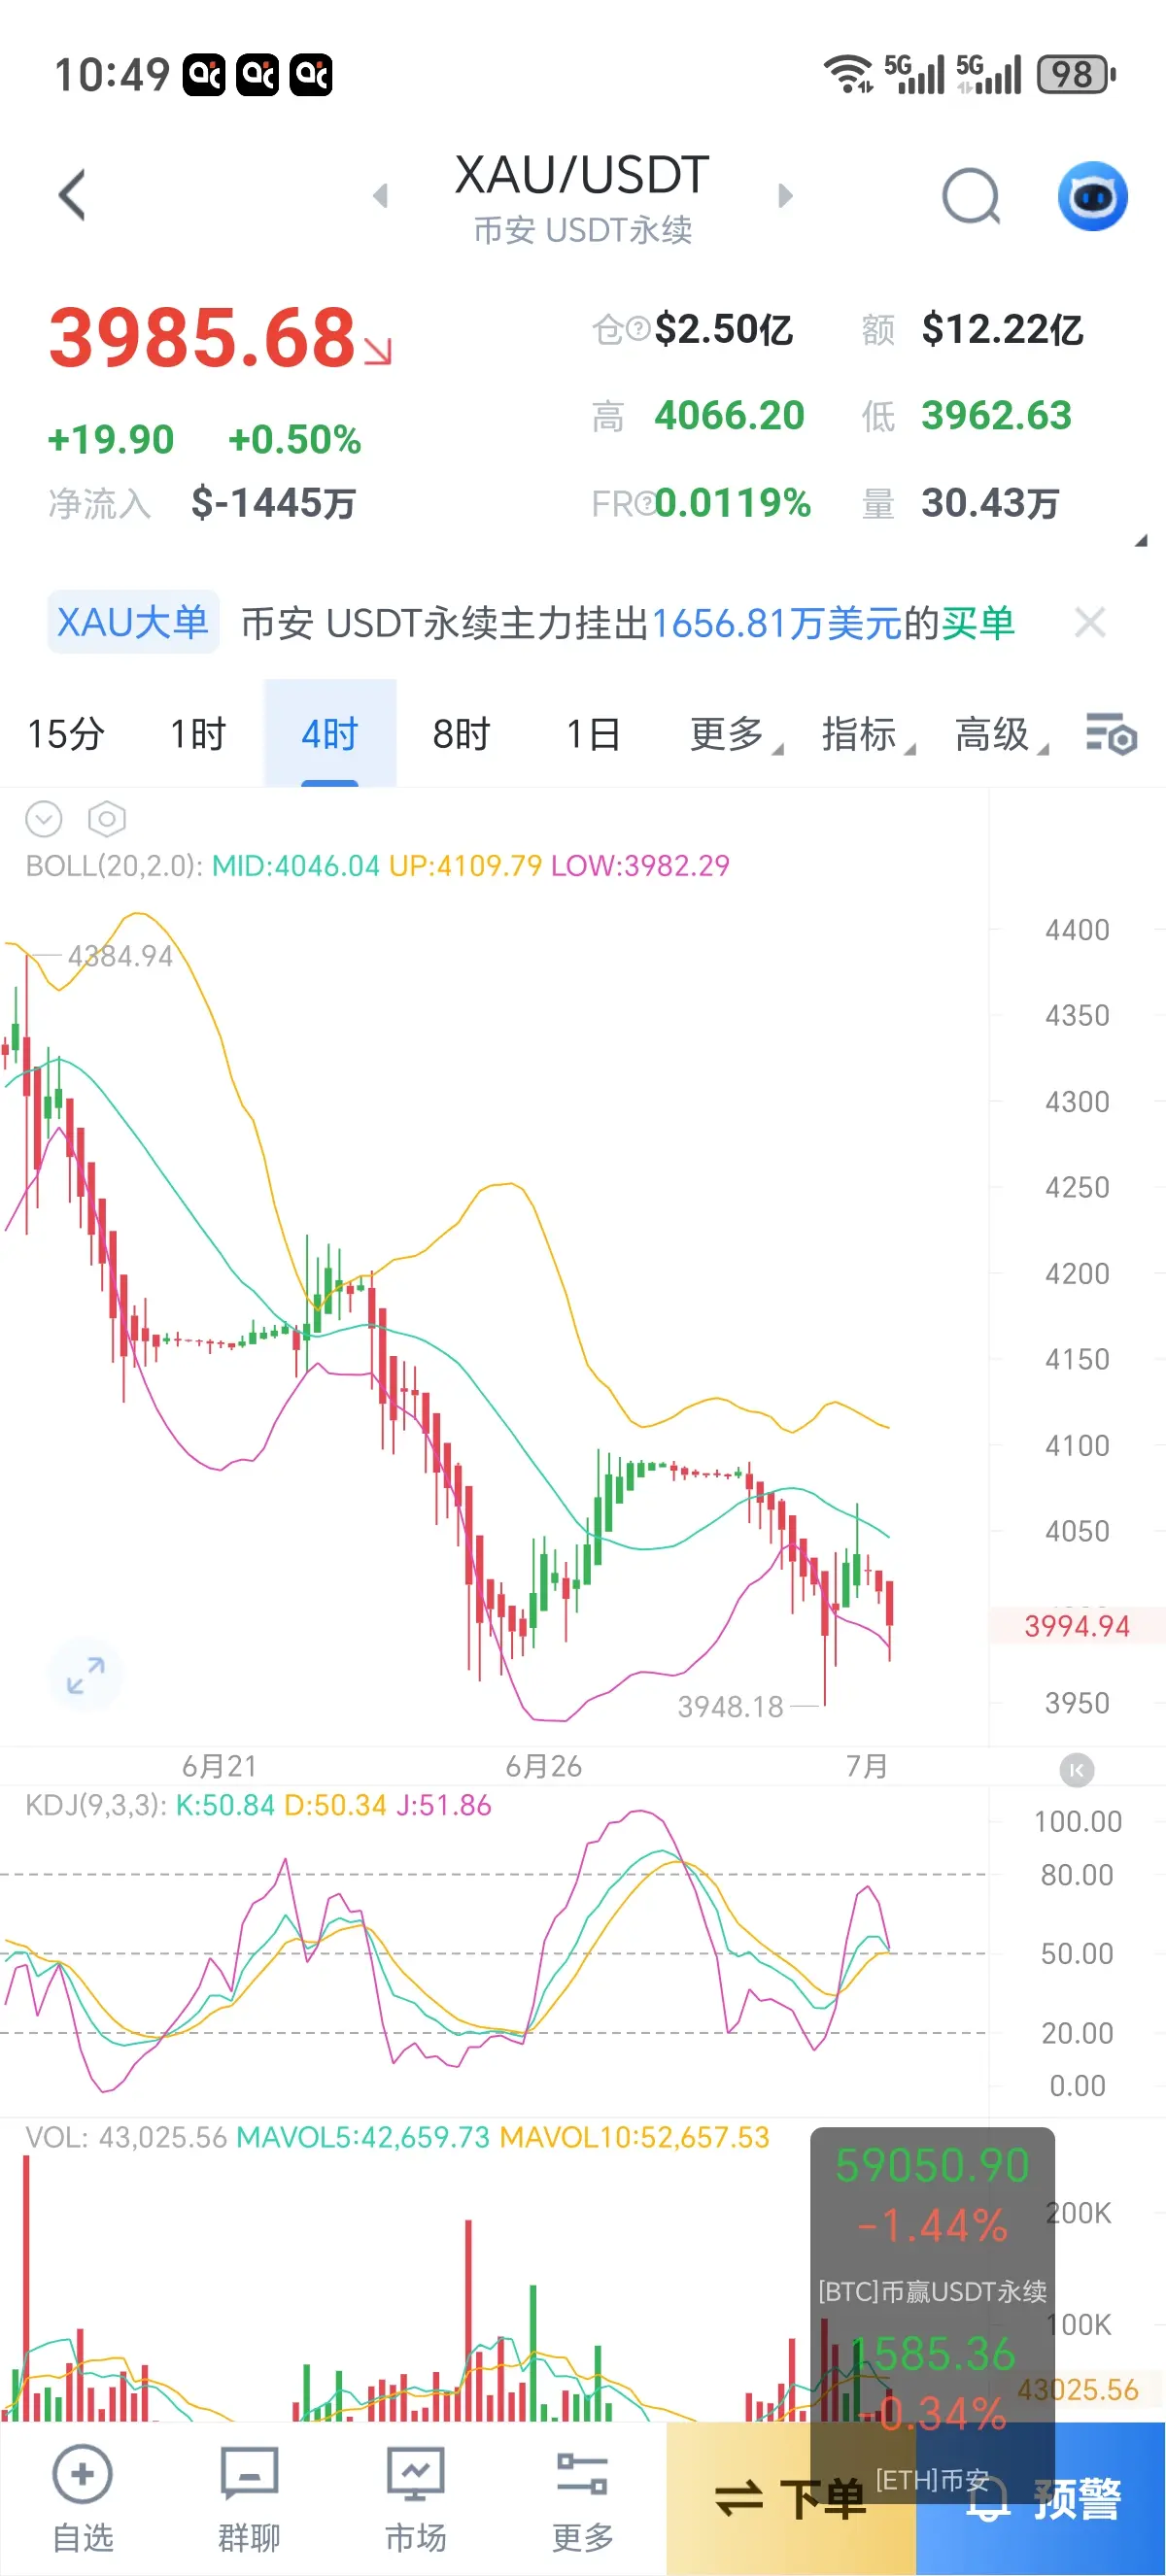
7.1 Gold Analysis: The lower band's 'fig leaf' is still there, but the middle band is harder to catch than an ex
On the 4-hour chart, gold prices are barely clinging to the lower Bollinger Band (3982), with the current price at 3985 barely 'holding its ground,' but the middle band at 4046 is like an iron gate, with rebound space visibly narrow.
The KDJ three lines are 'sticky' around 50, oscillating between golden cross and death cross repeatedly, neither oversold nor showing bottom divergence. The weak rebound is solely supported by the main force's $16.56 million buy order 'forcing the drama
BTC0.74%
SOL0.55%
View Original
post-image
  • Reward
  • Comment
  • Repost
  • Share
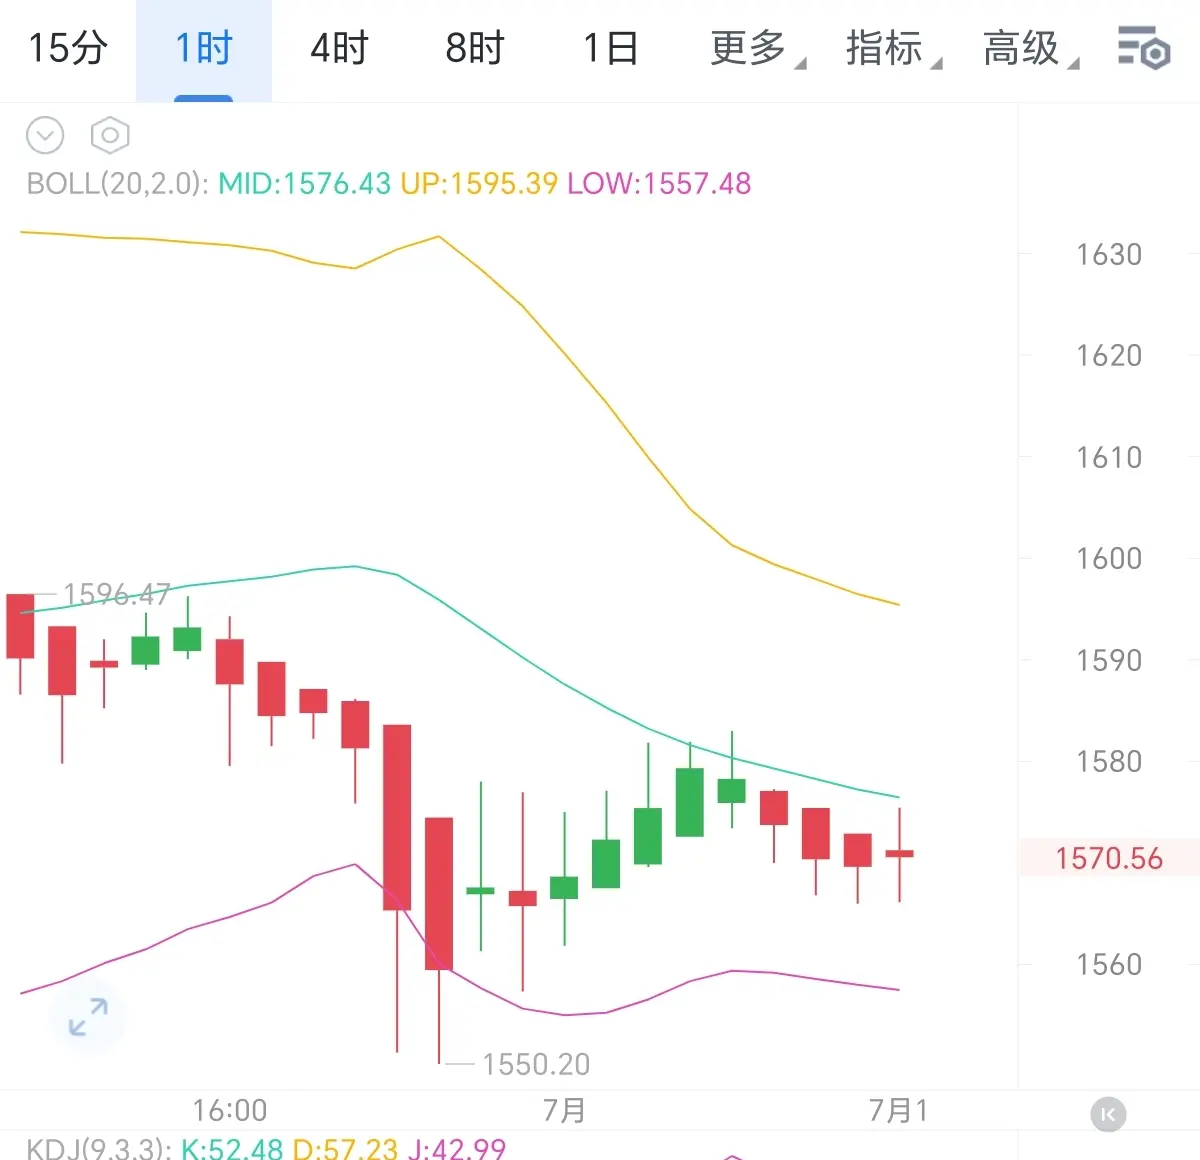
7.1ETH Analysis
On the 1-hour cycle, a bearish flag consolidation and accumulation structure has emerged. After the main bearish flagpole, it enters narrow-range consolidation. The rebound is continuously suppressed by the Bollinger middle band at 1576.43, the highs are gradually rising with lack of strength, volatility is compressing, indicating a trend continuation rather than bottom formation. Buyers are only passively absorbing, liquidity is thinning, and the bullish counterattack lacks volume confirmation. The Bollinger Bands are diverging downward, price operates in the weak zone below t
BTC0.74%
ETH0.58%
View Original
post-image
  • Reward
  • Comment
  • Repost
  • Share
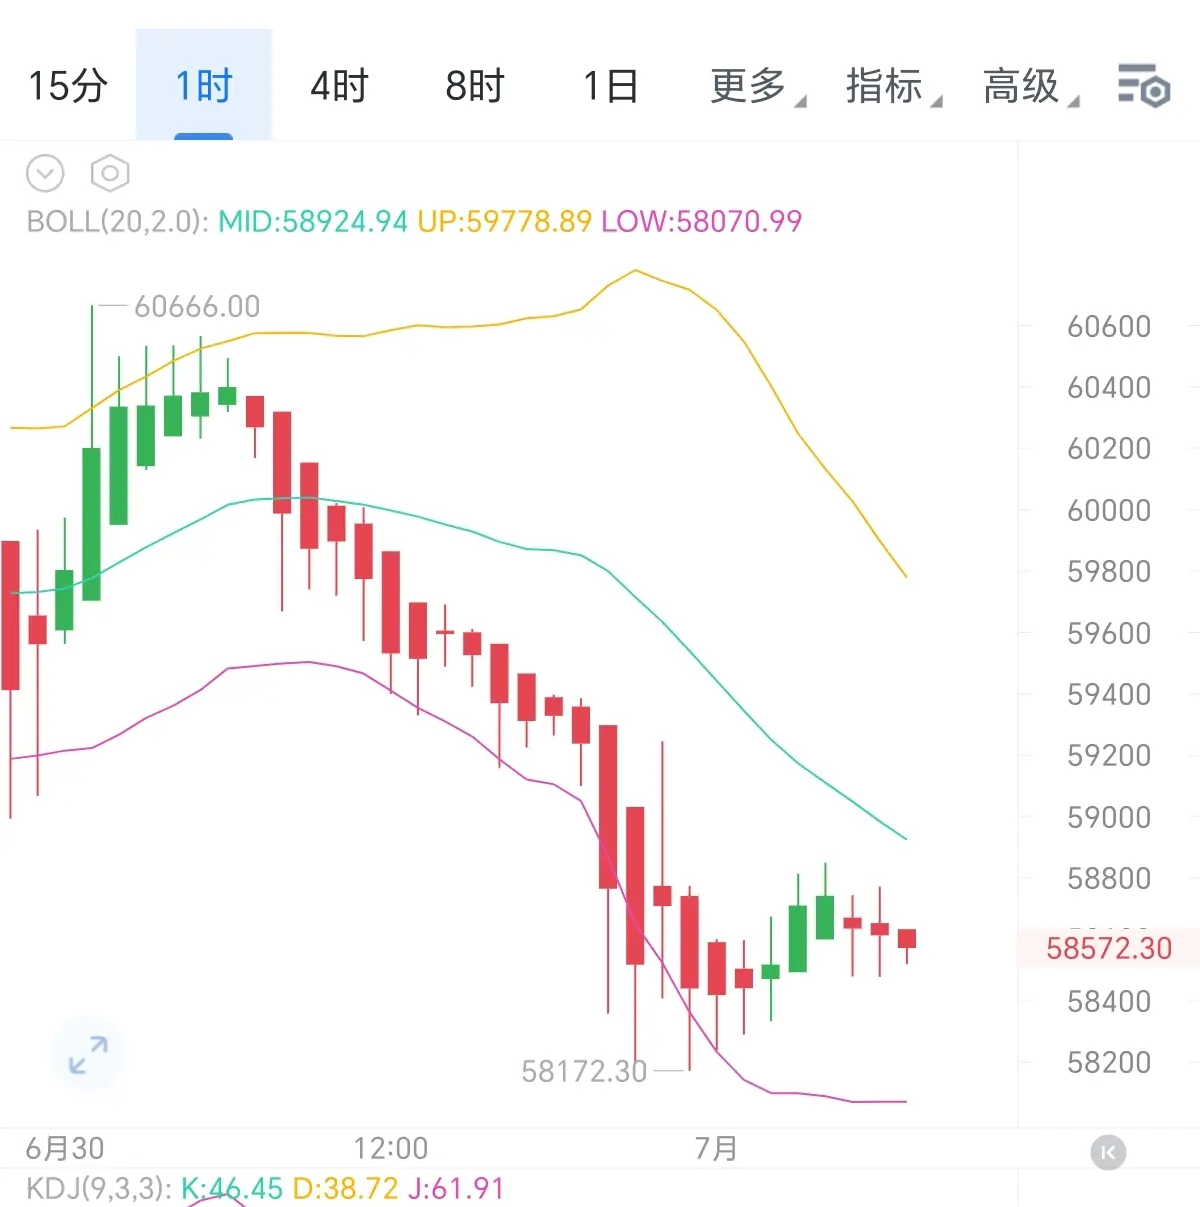
### 7.1 BTC Morning Analysis
BTC on the 1-hour cycle forms a narrow-range box consolidation as it continues falling under a bearish trend. The upper edge of the range is under pressure at the Bollinger Middle Band 58924, while the lower edge is anchored at the previous low 58172. The candlesticks converge with volatility narrowing; rebounds are repeatedly suppressed at the upper edge, with highs stepping down one level at a time. This belongs to a weak continuation box, not a reversal bottoming pattern. The Bollinger Bands slope downward and expand; price remains consistently below the middle
BTC0.74%
ETH0.58%
View Original
post-image
  • Reward
  • Comment
  • Repost
  • Share
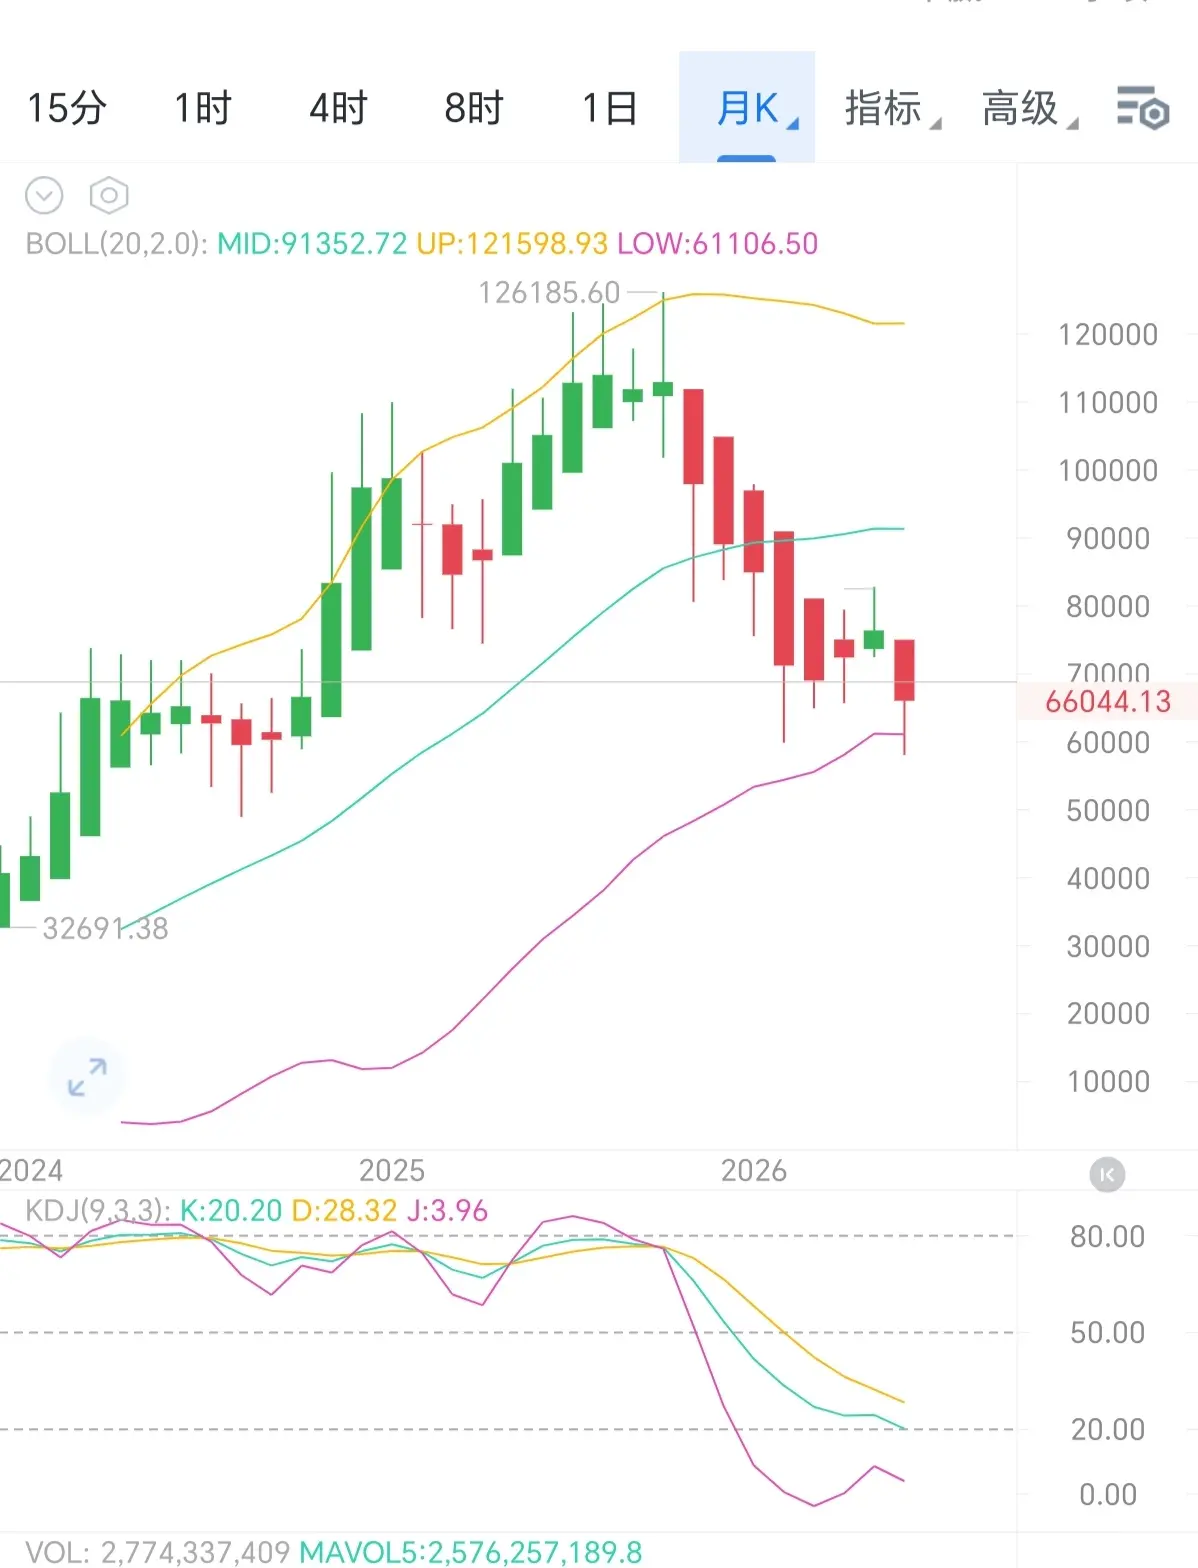
BTC June monthly line closed! Monthly line broken! Is the rebound real or fake??
The June monthly line closed with a bearish solid candle, closing at 58358, which has broken below the monthly Bollinger Band lower rail (61106), hovering just below it. The holding cost continues to move downward, and the bearish structure is firmly set.
The most critical defense zone right now is 58000–58500, which is the key support band for this decline. If it is effectively broken, it may trigger a chain of stop-loss orders, and the next target would be the integer level of 55000.
As for a rebound, the first
BTC0.74%
ETH0.58%
View Original
post-image
  • Reward
  • Comment
  • Repost
  • Share
The entry positions given for the early-morning “dian” — 1,000 BTC on big ones and 39 ETH on ETH — go out!
For short-term friends, don’t be afraid to take it and move it along—don’t lack the nerve!!
View Original
  • Reward
  • Comment
  • Repost
  • Share
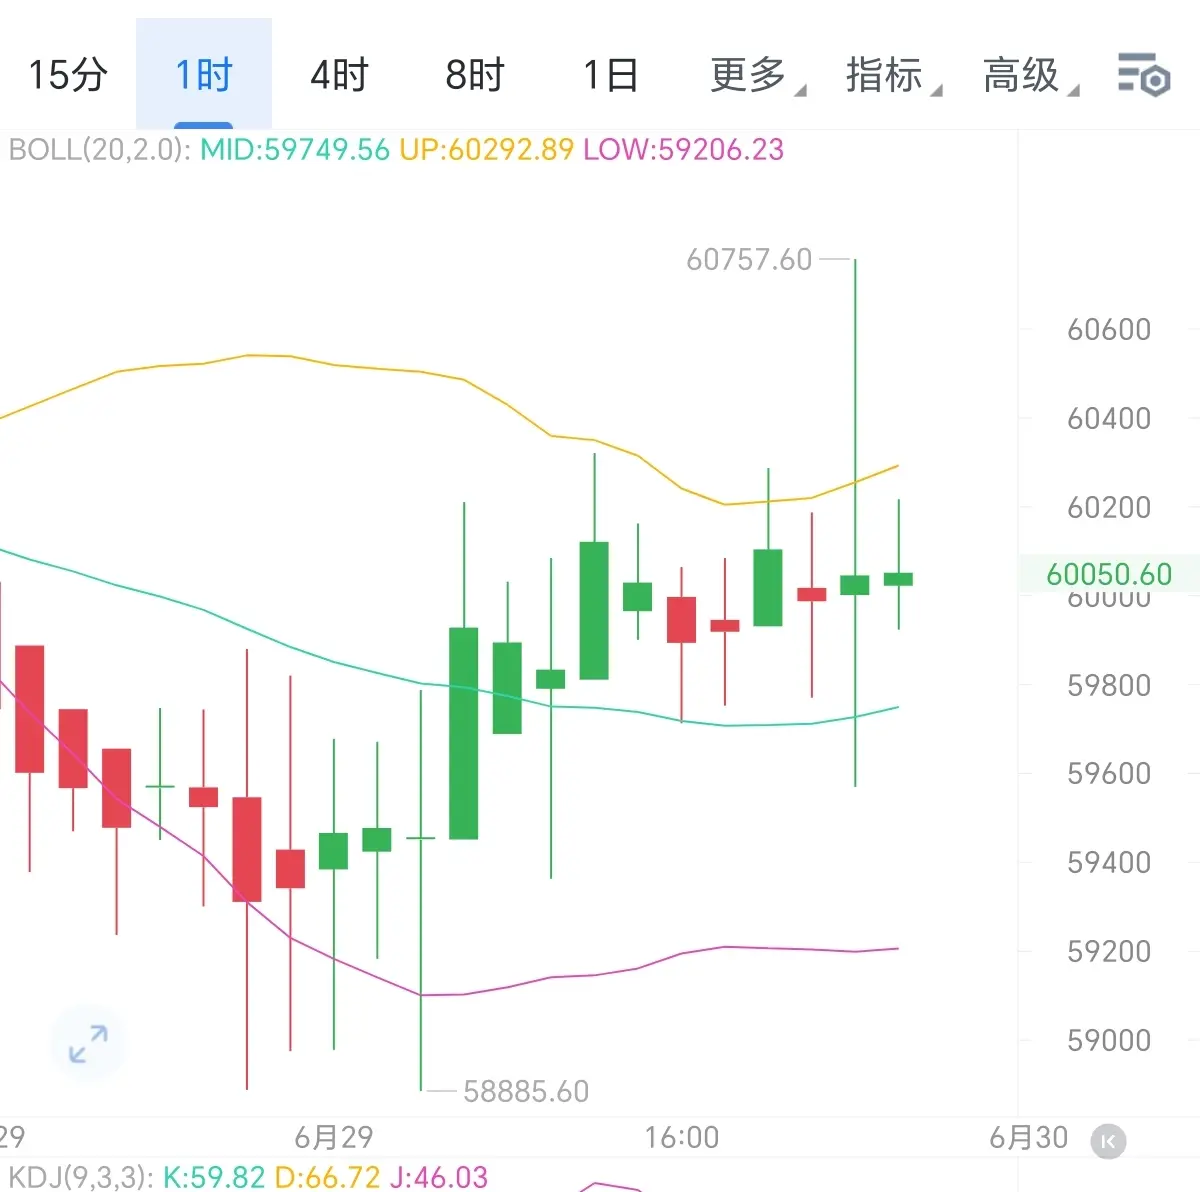
6.29 BTC Evening Analysis
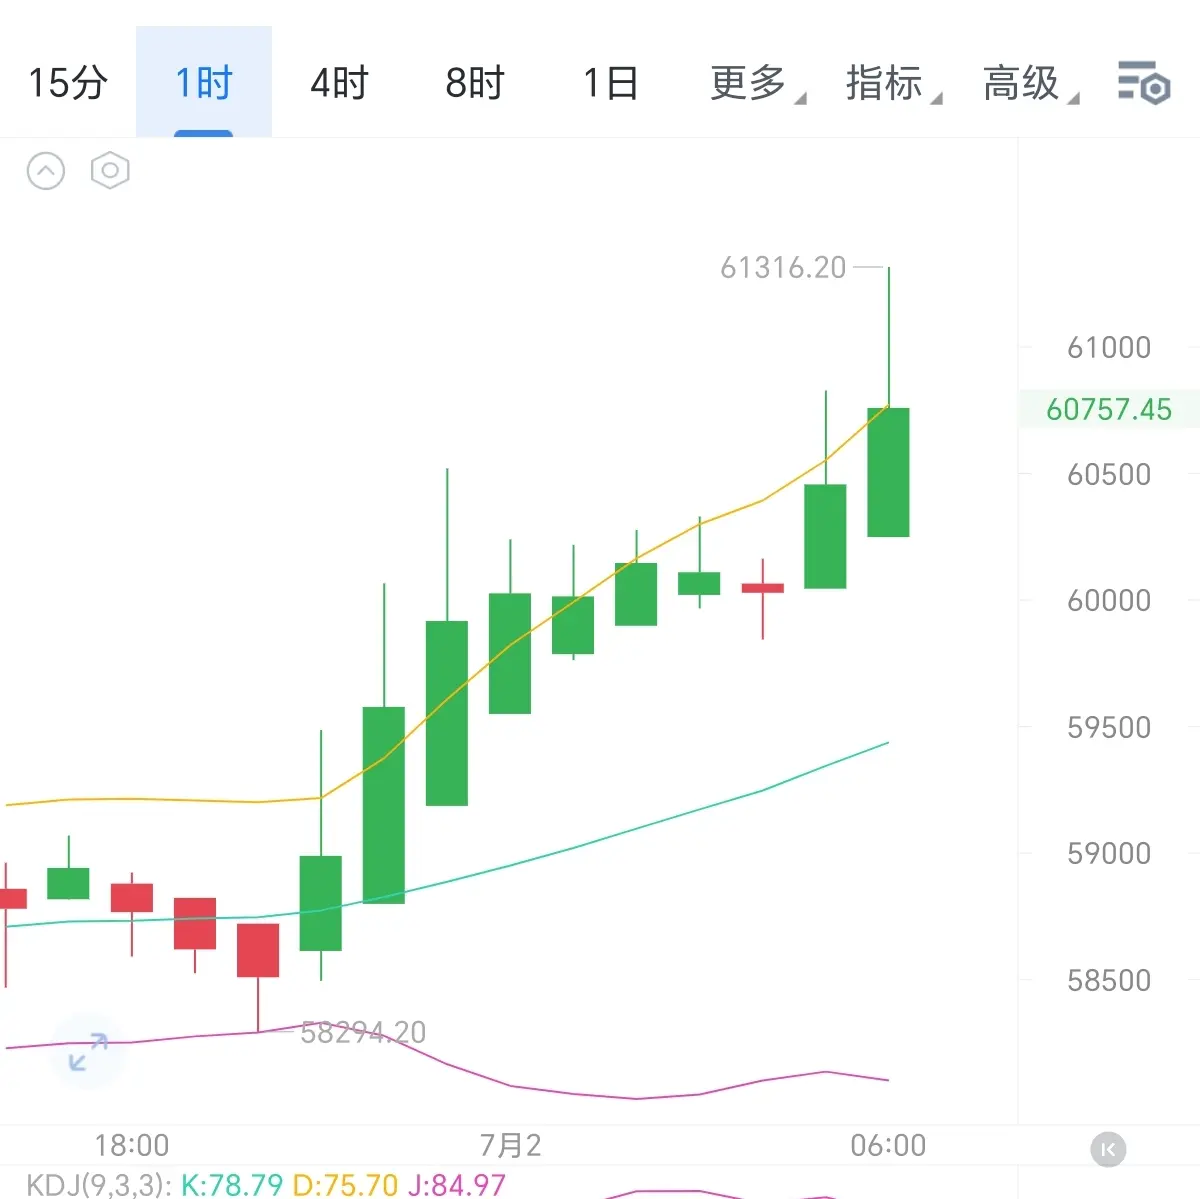
After an hourly pulse spike, it enters volatility convergence-style consolidation. The price is under pressure at the lower edge of the Bollinger upper band. Bullish momentum shifts from an instantaneous pulse to marginal exhaustion. KDJ drops from high levels into a neutral zone. There is no incremental buying to continue the push. This is a relay game after short covering and speculative position liquidation, not a trend reversal.
The intraday long upper shadow leaves a liquidity void zone. The level 60757 above becomes a short-term strong resistance zone. The backd
BTC0.74%
ETH0.58%
View Original
post-image
🐰
🐰Usagi
MC:$2.25KHolders:1
0.00%
  • Reward
  • Comment
  • Repost
  • Share
  • Pinned