


CryptoZyra

vip
Active for: 0.2y
Peak Tier 5
Crypto market content creator and live streamer focused on trading analysis and community engagement.\nExperienced in discussing Bitcoin, altcoins, and market trends through interactive live sessions.
Pin
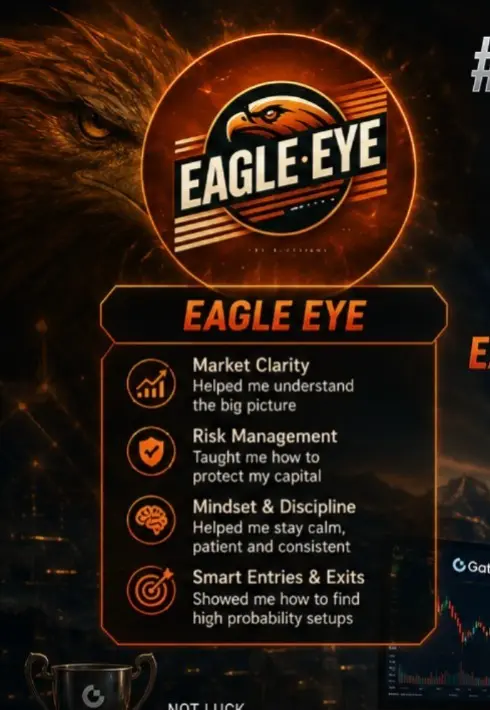
#MyGateTradeStory I never thought I would reach a point where I could call myself a trader. If someone told me this journey would change my mindset, my discipline, and even my way of seeing life, I would have probably laughed at it.
There was a time when trading felt like something only “lucky people” or financially strong people could do. Honestly, I didn’t even have the confidence to believe I could enter this world. I didn’t have enough capital, I didn’t have perfect knowledge, and I definitely didn’t have certainty. All I had was curiosity… and a small spark inside me that kept asking: “Wh
post-image
post-image
post-image
post-image
  • Reward
  • 63
  • 5
  • Share
SoominStar:
To The Moon 🌕
View More
BTC Ð UPDATES
gate liveLIVE
1,483
live-coin
  • Reward
  • Comment
  • Repost
  • Share
BTC Ð UPDATES
716 views
2026-07-28 16:30
  • Reward
  • Comment
  • Repost
  • Share
BTC Ð UPDATES
587 views
2026-07-28 15:41
  • Reward
  • Comment
  • Repost
  • Share
BTC Ð UPDATES
527 views
2026-07-28 14:58
  • Reward
  • Comment
  • Repost
  • Share
BTC Ð UPDATES
473 views
2026-07-28 14:11
  • Reward
  • 3
  • Repost
  • Share
ShainingMoon:
To The Moon 🌕
View More
(°ロ°)
738 views
2026-07-28 13:23
  • Reward
  • 2
  • Repost
  • Share
ShainingMoon:
To The Moon 🌕
View More
😊
471 views
2026-07-28 12:35
  • Reward
  • 2
  • Repost
  • Share
ShainingMoon:
To The Moon 🌕
View More
ಠ﹏ಠ
480 views
2026-07-28 11:47
  • Reward
  • 2
  • Repost
  • Share
ShainingMoon:
To The Moon 🌕
View More
BTC Ð UPDATES
179 views
2026-07-28 11:04
  • Reward
  • 2
  • Repost
  • Share
ShainingMoon:
To The Moon 🌕
View More
BTC Ð UPDATES
704 views
2026-07-28 10:11
  • Reward
  • 2
  • Repost
  • Share
ShainingMoon:
To The Moon 🌕
View More
BTC Ð UPDATES
255 views
2026-07-28 09:26
  • Reward
  • 2
  • Repost
  • Share
ShainingMoon:
2026 GOGOGO 👊
View More
BTC Ð UPDATES
480 views
2026-07-28 08:30
  • Reward
  • 2
  • Repost
  • Share
ShainingMoon:
To The Moon 🌕
View More
BTC Ð UPDATES
584 views
2026-07-28 06:33
  • Reward
  • 1
  • Repost
  • Share
ShainingMoon:
2026 GOGOGO 👊
market update
587 views
2026-07-28 05:51
  • Reward
  • 3
  • Repost
  • Share
ShainingMoon:
To The Moon 🌕
View More
#DirectIPOSeason2JerseyMikes
Jersey Mike's ($JMKE) is quickly becoming one of the most talked-about IPOs of 2026, and investor enthusiasm is already proving just how strong the demand is. What began as a single sandwich shop on the Jersey Shore in 1956 has grown into one of North America's fastest-expanding restaurant brands, operating more than 3,300 locations across the United States and Canada. Backed by Blackstone's multi-billion-dollar investment, the company has continued to deliver impressive business growth, generating approximately $724 million in revenue, $55 million in net income,
HighAmbition
#DirectIPOSeason2JerseyMikes
Jersey Mike's ($JMKE) is quickly becoming one of the most talked-about IPOs of 2026, and investor enthusiasm is already proving just how strong the demand is. What began as a single sandwich shop on the Jersey Shore in 1956 has grown into one of North America's fastest-expanding restaurant brands, operating more than 3,300 locations across the United States and Canada. Backed by Blackstone's multi-billion-dollar investment, the company has continued to deliver impressive business growth, generating approximately $724 million in revenue, $55 million in net income, and nearly $4.3 billion in systemwide sales during 2025. These results have positioned Jersey Mike's as one of the strongest consumer brands preparing to enter the public market.
The upcoming IPO aims to raise approximately $1.09 billion by offering 43.48 million shares at an expected price range of $21–$25 per share, targeting a valuation of around $8 billion on the New York Stock Exchange (NYSE) under the ticker $JMKE. Thanks to its strong financial performance, expanding franchise network, and consistent customer demand, investor interest has been exceptionally high from the very beginning.
That enthusiasm was clearly reflected on Gate Direct IPO Season 2, where the intended subscription quota reached full capacity ahead of schedule, forcing the subscription channel to close early. The rapid completion of subscriptions demonstrates the confidence investors have in Jersey Mike's long-term growth potential and highlights the increasing popularity of Gate's Direct IPO platform, which allows eligible users to participate in major public offerings before official market trading begins.
If you successfully submitted your intended subscription before the channel closed, your application remains valid, and no further action is required. The allotment calculation will begin after 10:00 (UTC+8) on July 29, while the final allocation will depend on the actual IPO offering size, total qualified subscriptions, and the final allotment quota received. Since demand has exceeded the available allocation, participants may receive a partial allocation based on the official distribution mechanism.
Jersey Mike's has built its reputation through consistent expansion, strong brand loyalty, and solid financial growth. Combined with overwhelming investor demand and an anticipated NYSE debut, $JMKE has become one of the standout IPO stories of 2026.
Whether you're an IPO investor or simply following major market events, this is a listing worth watching closely.
🔗 Official Gate Announcement:
https://www.gate.com/announcements/article/100849
🔗 Gate IPO Access:
https://www.gate.com/ipos?tab=ipo-access
#SummerCreationCamp @Gate_Square

repost-content-media
  • Reward
  • 5
  • Repost
  • Share
BlackoutHawkCryptoBoy:
2026 GOGOGO 👊
View More
#SummerCreationCamp
WTI Crude Oil Analysis
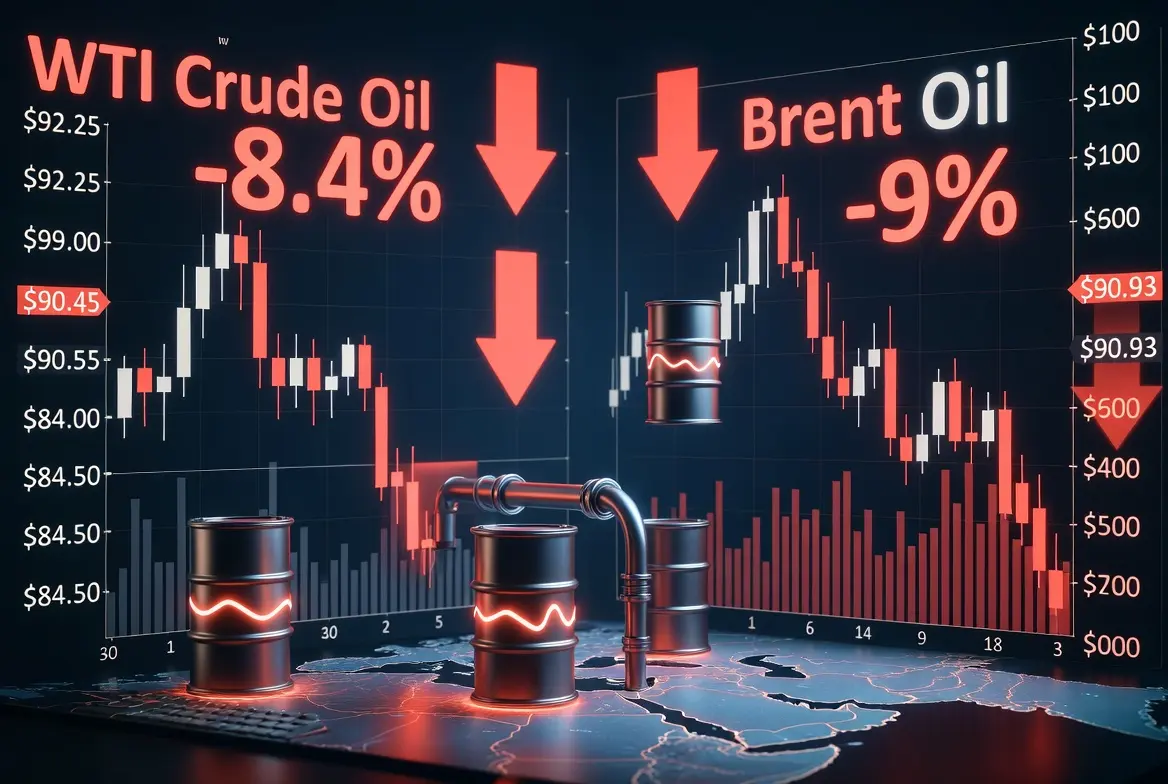
WTI Crude Oil recently touched its highest level since June 8, reaching approximately **$92.25 per barrel** last Thursday before experiencing a sharp reversal. The current price around **$84.50** represents a significant decline of approximately **8.4%** from that recent peak. This pullback accelerated dramatically on Monday with WTI opening with a substantial bearish gap, falling nearly **6%** in a single session amid renewed hopes for US-Iran diplomatic resolution.
The primary catalyst for this sharp decline was the announcement that the United Sta
CL-4.13%
HighAmbition
#SummerCreationCamp
WTI Crude Oil Analysis
WTI Crude Oil recently touched its highest level since June 8, reaching approximately **$92.25 per barrel** last Thursday before experiencing a sharp reversal. The current price around **$84.50** represents a significant decline of approximately **8.4%** from that recent peak. This pullback accelerated dramatically on Monday with WTI opening with a substantial bearish gap, falling nearly **6%** in a single session amid renewed hopes for US-Iran diplomatic resolution.
The primary catalyst for this sharp decline was the announcement that the United States paused its bombing campaign against Iranian targets after 13 consecutive nights of strikes. Tehran subsequently suspended its retaliatory attacks, reviving hopes for a diplomatic breakthrough in the five-month-old conflict. This development triggered a rapid unwinding of the geopolitical risk premium that had been built into oil prices during the escalation phase.
Potential Downside Targets for WTI
From the current $84.50 level, WTI could potentially decline further toward the **$80.00 to $82.00** range in the near term if diplomatic progress continues. A more bearish scenario, should Middle East tensions fully de-escalate and supply concerns diminish, could see prices retreating toward the **$75.00 to $78.00** zone, representing an additional **8% to 11%** decline from current levels. However, shipping restrictions through the Bab el-Mandeb Strait and ongoing Strait of Hormuz concerns are limiting aggressive bearish positioning, providing some floor under prices.
Brent Crude Oil Analysis
Brent Crude Oil experienced even more dramatic price action recently. The international benchmark briefly touched the psychologically significant **$100 per barrel** mark last week when the conflict spilled beyond the Strait of Hormuz into the Red Sea, threatening crude exports from the broader Middle East region. This represented a multi-month high and reflected extreme supply disruption fears.
Following the de-escalation news, Brent has fallen sharply, declining approximately **6%** to trade around **$90.93** after briefly slipping below the $90 mark. From the $100 peak, this represents a **9% decline**. The volatility in Brent has been exceptional, with the contract swinging between gains and losses as traders grappled with rapidly evolving geopolitical headlines.
Potential Downside Targets for Brent
Should the diplomatic thaw between Washington and Tehran continue, Brent could see further downside toward the **$85.00 to $88.00** range in the immediate term. A complete resolution of Middle East tensions could potentially push Brent back toward pre-conflict levels around **$70.00 to $75.00 per barrel**, representing a potential **15% to 20%** decline from current prices. However, analysts caution that it remains too early to conclude the conflict has entered a durable de-escalation phase, and shipping through the Strait of Hormuz, through which approximately one-fifth of global seaborne oil shipments pass, remains a critical concern.
Key Factors to Monitor
Traders should watch for further developments regarding US-Iran negotiations, any resumption of military strikes, and shipping traffic data through the Strait of Hormuz and Bab el-Mandeb Strait. Additionally, weekly inventory reports from the American Petroleum Institute and Energy Information Administration will provide crucial supply-demand balance indicators. The mixed fundamental backdrop suggests caution before placing aggressive bearish bets, as supply disruptions could quickly reignite if diplomatic efforts falter.
#BrentOil #Crudeoil @Gate_Square
repost-content-media
  • Reward
  • 3
  • Repost
  • Share
ShainingMoon:
To The Moon 🌕
View More
#SummerCreationCamp
#XAG
Silver is trading at $58.60, which is roughly 52% below the all-time high of $121.62 reached on January 29, 2026, yet still approximately 49% higher than where it was one year ago. The metal has been through an extraordinary cycle: a 147% surge in 2025, a parabolic spike above $120 in January 2026 driven by speculative frenzy, and then a brutal multi-month correction that has brought it back to the upper $50s. The price is currently sitting at a major decision point, balancing between the forces that dragged it down from the peak and the structural fundamentals that c
HighAmbition
#SummerCreationCamp
#XAG
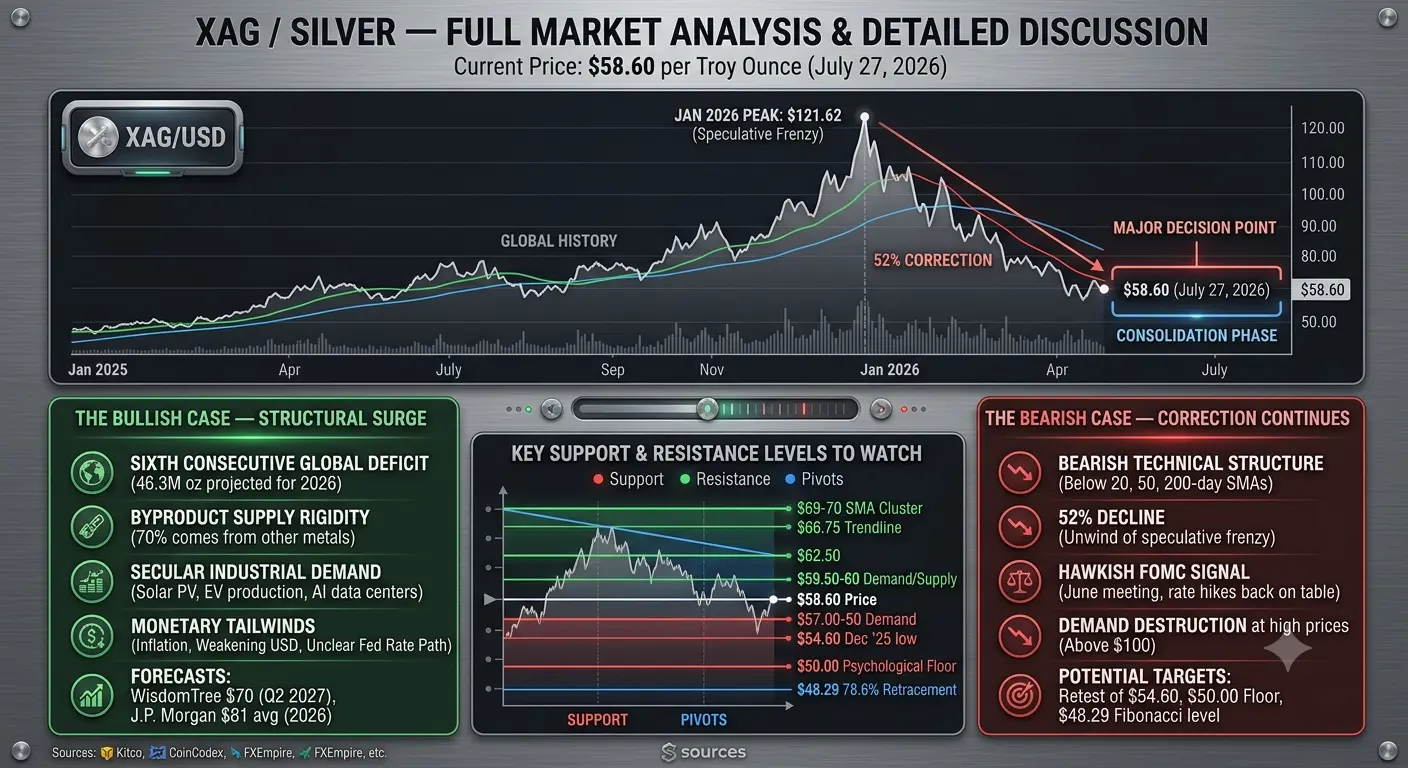
Silver is trading at $58.60, which is roughly 52% below the all-time high of $121.62 reached on January 29, 2026, yet still approximately 49% higher than where it was one year ago. The metal has been through an extraordinary cycle: a 147% surge in 2025, a parabolic spike above $120 in January 2026 driven by speculative frenzy, and then a brutal multi-month correction that has brought it back to the upper $50s. The price is currently sitting at a major decision point, balancing between the forces that dragged it down from the peak and the structural fundamentals that continue to argue for much higher prices over the medium to long term. The market is in a consolidation phase, neither deeply oversold nor overbought, and the next directional move will likely be determined by which side of the key technical levels holds first.
THE BULLISH CASE — WHY SILVER COULD SURGE AGAIN
The bull case for silver is built on a foundation of genuine, structural supply-demand imbalances that are not going away. The global silver market is projected to record its sixth consecutive annual supply deficit in 2026, estimated at 46.3 million troy ounces by the Silver Institute and Metals Focus. This is not a temporary disruption; it is a structural feature of the market. Approximately 70% of silver is produced as a byproduct of base metal mining, which means that even when silver prices soar, mine supply cannot respond efficiently because the decision to mine copper, zinc, or lead is driven by those metals' economics, not silver's. Total global silver supply is expected to reach only 1.05 billion ounces in 2026, a 1.5% increase and a decade high, yet still falling short of demand.
Industrial demand is the engine behind this structural deficit. Solar photovoltaic manufacturing continues to absorb an ever-larger share of available supply, with some estimates suggesting solar alone could consume up to 41% of total production by 2030. Global EV production is forecast to reach 14 to 15 million units in 2026, adding an estimated 70 to 75 million ounces of silver demand from automotive applications alone, with each EV containing roughly 1 to 2 ounces of silver in semiconductor and battery systems. AI infrastructure buildout is an additional demand layer that barely existed a few years ago but is now consuming meaningful quantities of silver in data center electronics and cooling systems. Electronics more broadly continue to require silver in ever-growing volumes. The combination of these secular demand trends, running directly into a supply side that is structurally rigid, creates a powerful floor under silver prices.
From a monetary perspective, silver benefits from the same macro forces that support gold. Inflation fears are mounting, the US dollar has shown periods of weakness, and the Federal Reserve's rate path remains uncertain. When the dollar weakens or real yields decline, silver tends to rally as a hard-asset alternative. The gold-to-silver ratio, currently around 64:1, remains historically elevated, which many analysts interpret as a strong signal that silver is undervalued relative to gold and has room to outperform. If gold continues to hold above $4,000 per ounce, silver's catch-up trade could be substantial.
Nitesh Shah, Head of Commodities and Macroeconomic Research at WisdomTree, has publicly stated that silver should recover toward $70 an ounce by the second quarter of 2027, driven by improving fundamentals rather than the speculative momentum that characterized the January spike. J.P. Morgan Global Research projects an average silver price of approximately $81 per ounce for 2026. Bank of America's more bullish call reaches $135. These are not retail influencers; these are institutional research desks with deep commodity expertise.
THE BEARISH CASE — WHY SILVER COULD DROP FURTHER
The bear case is equally serious and must be respected. The technical structure of XAG/USD is currently bearish on the daily and weekly timeframes. The price is trading below all major moving averages: the 20-day SMA near $69 to $74, the 50-day SMA near $64, and the 200-day SMA near $69. These averages are converging and the shorter ones are crossing below the longer ones, which is a classic bearish signal. The RSI has been trending firmly lower, recently near 33, indicating persistent selling pressure. Momentum indicators are pointing nowhere positive. The descending channel that has contained price action since the January peak remains intact, and every rally attempt has been met with selling at the upper boundary.
The correction from $121.62 to $58.60 represents a decline of roughly 52%, which is a devastating move for anyone who bought near the top. The speculative frenzy that drove silver above $120 was driven largely by momentum trading, leveraged positions, and retail FOMO, not by fundamentals. When that momentum reversed, the unwind was violent. The market experienced rare and persistent backwardation in the futures curve during the peak, signaling extreme tightness, but that has now normalized. The June FOMC meeting put rate hikes back on the table, which was a significant blow to precious metals. The gold-to-silver ratio compressed to 55:1 in May before expanding back to 64:1 after the hawkish FOMC signal, showing how sensitive silver is to monetary policy shifts.
Bloomberg Intelligence's Mike McGlone has argued that silver is likely to trade between $50 and $100 for years, and that the January 2026 spike to $121.65 may represent a generational peak, with demand destruction from price-sensitive industrial users acting as a structural ceiling. When silver was above $100, industrial buyers began substituting alternatives or reducing consumption, which is a real constraint on how high prices can go before the market self-corrects. CoinCodex's technical analysis shows 16 bearish indicators versus 10 bullish, giving a 62% bearish sentiment reading as of July 26, 2026.
On the downside, immediate support is near $57.00, backed by the confluence of the 50-day moving average and a key demand zone. Below that, the $54.60 area is where silver bottomed in December 2025. A break below $54.78 would signal a continuation of the bearish trend, with the 78.6% Fibonacci retracement at $48.29 as the next downside target. The $50 psychological level would be a major focal point if selling accelerates. The most bearish scenario, outlined by Forex24, suggests a potential decline toward $45.65 if the descending channel pattern completes its measured move.
KEY SUPPORT AND RESISTANCE LEVELS TO WATCH
Understanding the precise levels where buyers and sellers are likely to step in is critical for any trading strategy. On the support side, the first major level is $57.00 to $57.50, which is the immediate demand zone where buyers have recently defended the price. The second support is $54.60, the December 2025 low. Below that, $50.00 is the psychological and technical floor, and $48.29 represents the 78.6% Fibonacci retracement of the entire 2025 rally. On the resistance side, the first target is $59.50 to $60.00, which is the immediate supply zone and a psychological barrier. The second resistance is $62.50, a level not tested since the 2011 highs. The third resistance is $66.75, which is the level that would invalidate the bearish descending channel structure. Beyond that, $69.00 to $70.00 is the convergence zone of the 20-day, 100-day, and 200-day SMAs, making it the most critical resistance cluster in the entire structure. A sustained break above $70 would fundamentally change the technical picture from bearish to bullish.
FORECAST PRICE TARGETS AND SCENARIOS
For the near term, the week of July 27 to 31, 2026, the bias is cautiously bullish but requires confirmation. If silver holds above $57.50 and breaks above $60.00, the path opens toward $62.50 and potentially $63.90. If the $60 level is sustained, a move toward $65.35 is possible. For the medium term, August through October 2026, the picture is more uncertain. The bearish scenario targets a retest of $54.60 and potentially $50.00 if the Fed remains hawkish and the dollar strengthens. The bullish scenario targets a recovery toward $70.00 if the dollar weakens, the Fed pivots dovish, or industrial demand data surprises to the upside. For the long term, into 2027 and beyond, WisdomTree targets $70 by Q2 2027. J.P. Morgan's average of $81 for 2026 implies significant upside from current levels if the institutional forecast is correct. Bank of America's $135 target represents the most aggressive bullish scenario. The structural supply deficit, which is projected to persist for years, provides a powerful tailwind that makes the long-term bull case fundamentally anchored rather than purely speculative.
TRADING STRATEGY AND PLAN
Given the current positioning at a major decision point, the trading approach should be structured and disciplined rather than aggressive in either direction. For bulls, the strategy is to wait for confirmation above $60.00 before entering long positions. The ideal entry zone is $57.00 to $58.00, with a stop loss below $54.50. The first profit target is $62.50, the second is $66.75, and the third is $70.00. Position sizing should be conservative because the broader trend is still bearish on the daily timeframe, and a failed breakout could result in a sharp reversal. For bears, the strategy is to short on a rejection at $60.00 or on a breakdown below $57.00. The stop loss for shorts should be above $61.00. The first profit target is $54.60, the second is $50.00. A breakout above $66.75 invalidates the bearish thesis entirely and would require a strategy shift. For longer-term investors, the current price zone around $58 represents a reasonable accumulation area, but dollar-cost averaging is strongly recommended over lump-sum buying given the volatility. The structural supply deficit and industrial demand growth provide a fundamental floor, but the path will be volatile, and drawdowns of 15 to 20% from entry should be expected. Avoid leveraged positions at this stage. The market is at a pivotal point, and leverage will amplify both gains and losses in a way that is difficult to manage.
HOW HIGH CAN SILVER GO?
The answer depends entirely on the timeframe and the catalyst. In the most optimistic scenario, where the Fed pivots to rate cuts, the dollar weakens significantly, and the supply deficit deepens beyond current projections, silver could retest $70 to $80 within months and challenge $100 again within 12 to 18 months. In the base case, supported by the structural deficit and industrial demand, a gradual recovery toward $65 to $70 by early 2027 is the most likely path. In the pessimistic scenario, where the Fed remains hawkish, the dollar strengthens, and industrial demand slows due to recession fears, silver could retrace to $50 or even $48 before finding a sustainable bottom. The one thing that is virtually certain is that silver will not trade quietly. This is a market that moves in extremes, and the range between $48 and $70 over the next three to six months is entirely plausible. Position accordingly, manage risk, and respect both sides of the trade.
@Gate_Square #XAG
repost-content-media
  • Reward
  • 5
  • Repost
  • Share
BlackoutHawkCryptoBoy:
2026 GOGOGO 👊
View More
#SummerCreationCamp
#nas100
The NASDAQ 100 index, currently trading around the 27,974 level, has experienced significant volatility in recent trading sessions. This comprehensive analysis covers the reasons behind the recent sharp decline, technical outlook, price forecasts, and strategic trading recommendations for traders navigating this challenging market environment.
**Understanding the Recent Sharp Decline**
The NASDAQ 100 has witnessed a notable pullback from its recent highs, and several interconnected factors have contributed to this sudden downward movement. The primary catalyst has
HighAmbition
#SummerCreationCamp
#nas100
The NASDAQ 100 index, currently trading around the 27,974 level, has experienced significant volatility in recent trading sessions. This comprehensive analysis covers the reasons behind the recent sharp decline, technical outlook, price forecasts, and strategic trading recommendations for traders navigating this challenging market environment.
**Understanding the Recent Sharp Decline**
The NASDAQ 100 has witnessed a notable pullback from its recent highs, and several interconnected factors have contributed to this sudden downward movement. The primary catalyst has been the persistent concerns surrounding artificial intelligence spending and its sustainability. Major technology companies including Meta, Microsoft, Alphabet, and Amazon are projected to increase their AI capital expenditures by approximately 30% to more than $500 billion this year. This massive spending commitment has raised serious questions among investors about whether these enormous investments will generate sufficient returns within a reasonable timeframe.
The semiconductor sector has been particularly hard hit, with chip stocks experiencing sharp selling pressure. The PHLX chip index declined significantly, reducing its year-to-date gains. Companies like Micron and Sandisk faced substantial losses as investor sentiment turned cautious. Adding to these concerns, reports emerged about Chinese startup DeepSeek developing its own AI chip technology, which could potentially reduce dependence on established chipmakers like Nvidia and Huawei, creating additional competitive pressure on the sector.
Federal Reserve policy uncertainty has also played a significant role in the recent market weakness. The Federal Reserve maintained its benchmark interest rate in the 3.50% to 3.75% range, but the accompanying signals were notably hawkish. Nine of eighteen committee members now project a rate hike before year-end, and the median dot-plot projection for year-end jumped from 3.4% to 3.8%. This shift in monetary policy expectations has created headwinds for growth stocks that dominate the NASDAQ 100 composition.
Geopolitical tensions and trade uncertainties have further complicated the market outlook. Tariff-related concerns continue to weigh on investor sentiment, with potential impacts on corporate earnings and economic growth projections. The combination of these factors has created a perfect storm that has driven the index lower from its recent peaks.
**Technical Analysis and Key Levels**
From a technical perspective, the NASDAQ 100 presents a mixed picture. The index has slipped below its 50-day moving average, which currently sits around the 28,767 level, signaling potential near-term weakness. The 5-day moving average at approximately 28,238 suggests some immediate support, but the overall moving average configuration shows more sell signals than buy signals across various timeframes.
The Relative Strength Index (RSI) indicates that momentum has shifted, with readings suggesting the index may be approaching oversold conditions on shorter timeframes, though daily indicators still point toward weakness. Key support levels to watch include the psychological 27,500 level, followed by stronger support around 27,000. On the upside, resistance is expected near the 28,200 level, with more significant resistance at the 28,500 to 28,800 zone where the 50-day moving average currently resides.
The index has completed what technical analysts describe as a consolidation phase after its previous rally, and the current price action suggests traders are reassessing valuations in light of the changing fundamental backdrop. Volume patterns indicate institutional participation in the recent decline, suggesting this is not merely a retail-driven correction but reflects broader repositioning by major market participants.
**Price Forecasts and Upside Potential**
Looking ahead, the NASDAQ 100 faces a critical period that will determine its trajectory for the remainder of the year. Analyst forecasts suggest the index could trade in a range between 30,117 and 31,347 by year-end, with an average forecast near 30,732. However, this optimistic scenario depends heavily on several key factors materializing favorably.
The path forward hinges primarily on whether the Federal Reserve's hawkish signals translate into actual rate hikes, and whether AI capital expenditure can continue to drive earnings growth despite a less favorable interest rate environment. If the Fed maintains its current stance without additional tightening, and if technology companies demonstrate that their massive AI investments are beginning to generate meaningful returns, the index could challenge the 30,000 level and potentially reach new all-time highs above 30,600.
Conversely, if economic data continues to suggest inflationary pressures requiring tighter monetary policy, or if AI spending fails to translate into proportional revenue growth, the index could face further downside pressure with potential tests of the 27,000 to 26,500 support zone.
**Strategic Trading Recommendations**
For traders currently positioned in NASDAQ 100 instruments, several strategic approaches warrant consideration. Short-term traders should focus on the established support and resistance levels, using the 27,500 level as a key decision point. A sustained break below this level could open the door for further downside toward 27,000, while a bounce from current levels could present opportunities for relief rallies toward 28,200.
Medium-term investors should consider the broader fundamental backdrop when making allocation decisions. The technology sector's long-term growth prospects remain intact, driven by ongoing digital transformation and AI adoption across industries. However, near-term volatility is likely to persist as the market digests earnings results from major technology companies and Federal Reserve policy developments.
Risk management remains paramount in the current environment. Position sizing should reflect the elevated volatility, with wider stop-losses to accommodate normal market fluctuations. Traders should also consider diversifying exposure across different timeframes and instruments to mitigate concentration risk.
**What Traders Are Thinking**
Market sentiment among traders has shifted noticeably from the euphoric optimism that characterized earlier periods of the year. Many experienced traders are adopting a more cautious stance, waiting for clearer signals before committing significant capital. The consensus view suggests that while the long-term bull market structure remains intact, the easy gains of the past may be giving way to a more challenging environment requiring greater selectivity and patience.
Institutional traders appear to be rotating away from the most richly valued semiconductor names toward sectors offering more attractive valuations and steadier earnings visibility. This rotation explains why the broader market indices have shown resilience even as technology stocks have underperformed.
Retail traders are closely watching upcoming earnings reports from major technology companies including Microsoft, Meta, Amazon, and Apple. These reports will provide crucial insights into whether the massive AI spending is beginning to translate into revenue growth, which will be a key determinant of sentiment in the weeks ahead.
**Conclusion and Outlook**
The NASDAQ 100 at 27,974 represents a critical juncture for the market. The recent decline reflects legitimate concerns about valuation sustainability, Fed policy uncertainty, and the returns on massive AI investments. However, the fundamental drivers of technology sector growth remain compelling over the longer term.
Traders should prepare for continued volatility in the coming weeks as the market digests earnings reports and Federal Reserve communications. The path to 30,000 and beyond remains achievable but will require favorable resolution of the current uncertainties. Prudent risk management, patience, and selective positioning will be essential for navigating this challenging but potentially rewarding market environment.
The key levels to monitor are 27,500 on the downside and 28,200 on the upside. A decisive break in either direction will likely set the tone for the next significant move in the NASDAQ 100.
@Gate_Square
repost-content-media
  • Reward
  • 4
  • Repost
  • Share
BlackoutHawkCryptoBoy:
2026 GOGOGO 👊
View More
#SummerCreationCamp
#HK50
The HK50 has shown a strong recovery over the past 24 hours. On July 24, the index closed at 24,963 points after dropping 0.98% in that session. Today, July 27, the Hang Seng opened at 24,993 and climbed to an intraday high of 25,276 before closing around 25,207, which translates to approximately a 1% gain from the previous close. However, if you are seeing the current price at 25,306, that means the index has surged approximately 1.37% in the last 24 hours from the July 24 close of 24,963. That is a gain of roughly 343 points in a single session. The broader monthl
HighAmbition
#SummerCreationCamp
#HK50
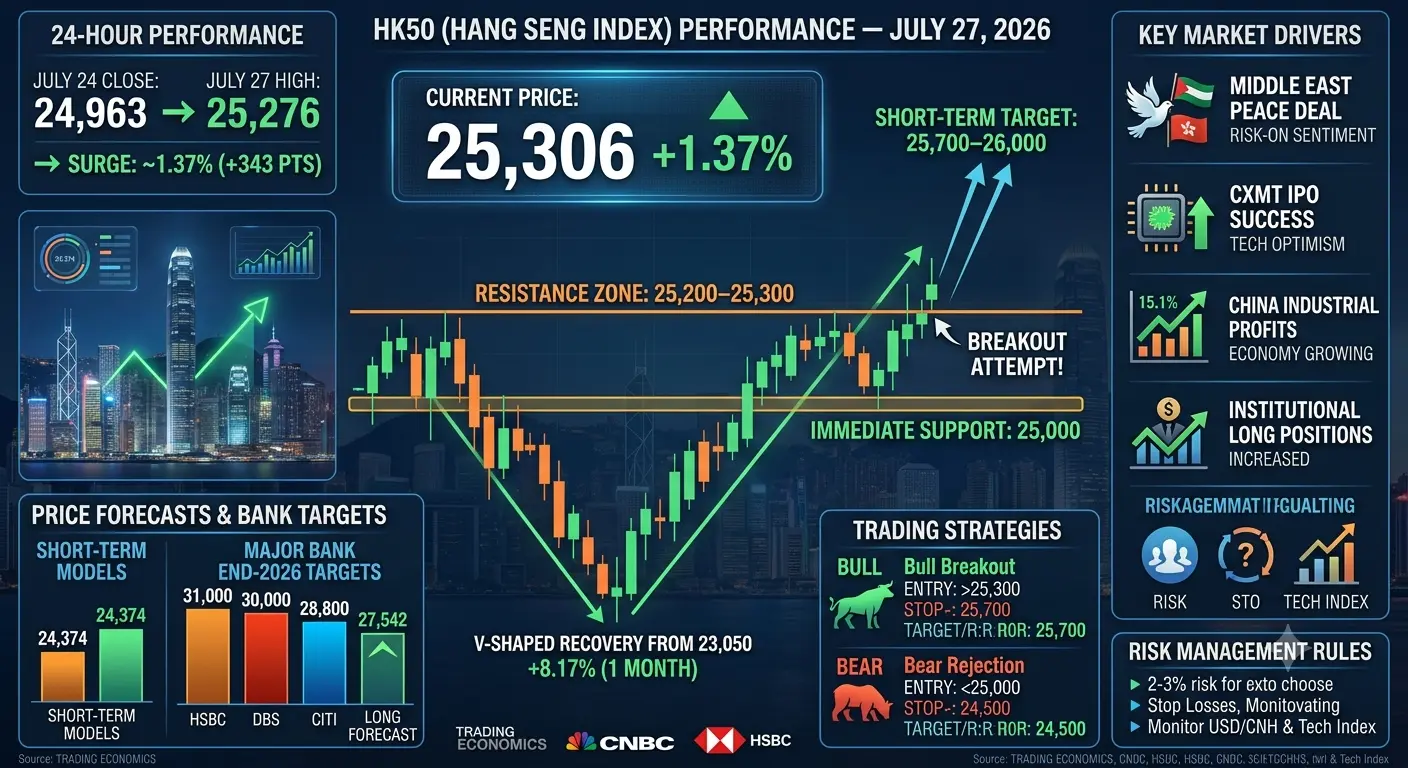
The HK50 has shown a strong recovery over the past 24 hours. On July 24, the index closed at 24,963 points after dropping 0.98% in that session. Today, July 27, the Hang Seng opened at 24,993 and climbed to an intraday high of 25,276 before closing around 25,207, which translates to approximately a 1% gain from the previous close. However, if you are seeing the current price at 25,306, that means the index has surged approximately 1.37% in the last 24 hours from the July 24 close of 24,963. That is a gain of roughly 343 points in a single session. The broader monthly picture is even more impressive. Over the past one month, the HK50 has climbed 8.17%, recovering from lows near 23,050 in early July to the current 25,306 level. This means the index has added roughly 2,250 points in just one month, which is a massive move driven by a combination of policy support from Beijing, tech sector recovery, and global risk-on sentiment following Middle East de-escalation.
Bullish or Bearish — The Verdict
The current momentum is clearly BULLISH in the short term, but with important caveats. The index has recovered more than 8% in a single month, which is a strong bullish signal. However, the longer-term picture remains mixed. The HK50 is still down 1.67% compared to one year ago, and it remains far below its all-time high of 33,484 reached in January 2018. The recent rally from 23,050 to 25,306 represents a strong V-shaped recovery, but the index is now approaching a critical resistance zone between 25,200 and 25,300 where it has repeatedly stalled over the past week. The July 23 close was 25,210, today's high touched 25,276, and your current reading of 25,306 suggests a breakout attempt is underway. If this level holds and the index closes above 25,300 with strong volume, it would confirm the bullish continuation. If it fails and reverses below 25,000, then it would signal a bearish double-top pattern and potential correction.
Key Market Drivers Right Now
Several factors are driving the current move. First, the Middle East peace deal has significantly reduced geopolitical risk premium, pushing oil prices down 5 to 7 percent today and boosting global equity sentiment. Second, Chinese chipmaker CXMT had a blockbuster IPO today, surging six-fold on its Shanghai debut to become China's biggest listed company by market cap, which is fueling massive optimism in the China tech narrative. Third, China's industrial profit data released today showed 15.1% growth in June, and while that is slower than May's 21.1%, it still confirms the economy is growing. Fourth, the Hang Seng saw net long positions increase as of July 27, meaning institutional traders are building bullish bets on the index. On the flip side, risks remain. The US Federal Reserve is holding rates at 3.5 to 3.75 percent, which keeps pressure on emerging market flows. Alibaba dropped 4.26% and Tencent fell 2.38% on July 24, showing that big tech is still vulnerable to profit-taking. The index concentration in a few mega-cap stocks means a bad day for two or three names can drag the entire index lower.
Support and Resistance Levels
The immediate support levels are 25,000 which is the psychological round number and also the area where the index found a floor on July 22 and 24, then 24,800 which was the July 22 intraday low, and below that 24,500 which was the July 17 close. On the resistance side, 25,300 is the immediate barrier that the index is testing right now. Above that, 25,500 is the next target which was the July 16 high, and then 25,700 to 26,000 represents a heavier supply zone from late December 2025. The 52-week range is 22,518 on the low side and 28,056 on the high side, so the current price is roughly in the middle of the yearly range.
Price Forecast — Where Can It Go
In the short term, meaning the next one to two weeks, if the 25,300 resistance breaks and holds, the HK50 can realistically move toward 25,700 to 26,000. That would represent another 400 to 700 points of upside from the current level, or roughly 1.5 to 3 percent. In the medium term, meaning by end of Q3 2026, Trading Economics models project the index at approximately 24,374, which is actually below the current price, suggesting the rally may not be sustainable without fresh catalysts. However, the major bank forecasts tell a different story. HSBC Private Bank targets 31,000 by end of 2026, DBS Bank targets 30,000, and Citi has a mid-year target of 27,500 and year-end target of 28,800. Long Forecast projects a gradual climb toward 27,542 by December 2026. The gap between the short-term models and the bank targets shows how divided the market is. The bull case depends on continued tech earnings growth, Beijing policy support, and global capital flows returning to Hong Kong. The bear case depends on US rates staying high, a potential slowdown in Chinese exports, and the risk that the AI trade unwinds as it did in Korea and Taiwan recently.
Trading Strategy — What Traders Should Do
For short-term traders, the play right now is to watch the 25,300 level very carefully. If the index breaks above 25,300 with volume and holds above it for at least two consecutive hourly candles, that is your confirmation to go long with a target of 25,700 and a stop loss at 24,950. The risk-to-reward on this trade is approximately 400 points of potential profit versus 350 points of risk, which is close to 1.15 to 1. For a more aggressive entry, you can go long right now at 25,306 with a stop loss at 24,800, which gives you 506 points of risk but also opens up 700 to 1,200 points of upside if the index reaches 26,000 to 26,500. The risk-to-reward here is 1.4 to 2.4 to 1, which is acceptable for experienced traders. For those who prefer the short side, wait for a rejection at 25,300 followed by a close below 25,000. That would confirm the double-top and open the door to a pullback toward 24,500 or even 24,300. The short entry would be below 24,950 with a stop at 25,350 and a target of 24,500. For swing and position traders, the monthly trend is clearly bullish with 8% gains in the last month alone. Consider building a long position in two tranches: one at the current 25,300 level and another on any pullback to 24,700 to 24,800. Use a wide stop at 24,000 and target 27,500 which is the Citi mid-year target. This is a longer-term play that could take several weeks to months to play out. The risk-to-reward is approximately 1,300 points of risk versus 2,200 points of reward, which is 1.7 to 1.
Key Risk Management Rules
Never risk more than 2 to 3 percent of your total account on a single HK50 trade. The index is volatile and can swing 300 to 500 points in a single session. Always use stop losses and do not move them further away when the trade goes against you. The HK50 tends to gap down at the open when negative news from China hits overnight, so be prepared for slippage. Avoid holding large positions over the weekend when Chinese regulatory announcements are most likely. Monitor the US Dollar to CNH exchange rate closely because a stronger dollar puts pressure on Hong Kong listed assets. Keep an eye on the Hang Seng Tech Index which often leads the direction of the main index. If the tech index starts breaking down while the main index is still rising, that is a divergence signal that the rally is losing steam.
The HK50 is in a short-term bullish phase with 1.37% gains in the last 24 hours and 8.17% gains over the past month. The current price of 25,306 is testing a critical resistance at 25,300. A breakout above this level opens the path to 25,700 and then 26,000. The major catalysts are the Middle East peace deal, the CXMT IPO euphoria, and strong Chinese industrial profit data. The risks are US rate policy, tech sector vulnerability, and the possibility that the current rally is overextended. Traders should watch the 25,300 level for direction and plan their entries accordingly with strict risk management. The medium-term outlook from major banks is optimistic with targets of 28,800 to 31,000 by year end, but the short-term models suggest caution with a potential pullback to 24,374 by end of Q3. Position sizing and stop losses are essential because this market can move fast in both directions.@Gate_Square
repost-content-media
  • Reward
  • 3
  • Repost
  • Share
BlackoutHawkCryptoBoy:
2026 GOGOGO 👊
View More
#SummerCreationCamp
#SOL
Solana (SOL) Market Analysis: Is the Next Major Move Finally Approaching?
Solana (SOL) has spent most of 2026 under pressure, but the recent market structure suggests that the network may be approaching one of its most important turning points of the year. While price action has remained relatively weak compared with previous cycles, development activity, institutional participation, and network upgrades continue moving forward at an impressive pace. This creates an interesting situation where market sentiment remains cautious while long-term fundamentals continue im
HighAmbition
#SummerCreationCamp
#SOL
Solana (SOL) Market Analysis: Is the Next Major Move Finally Approaching?
Solana (SOL) has spent most of 2026 under pressure, but the recent market structure suggests that the network may be approaching one of its most important turning points of the year. While price action has remained relatively weak compared with previous cycles, development activity, institutional participation, and network upgrades continue moving forward at an impressive pace. This creates an interesting situation where market sentiment remains cautious while long-term fundamentals continue improving.
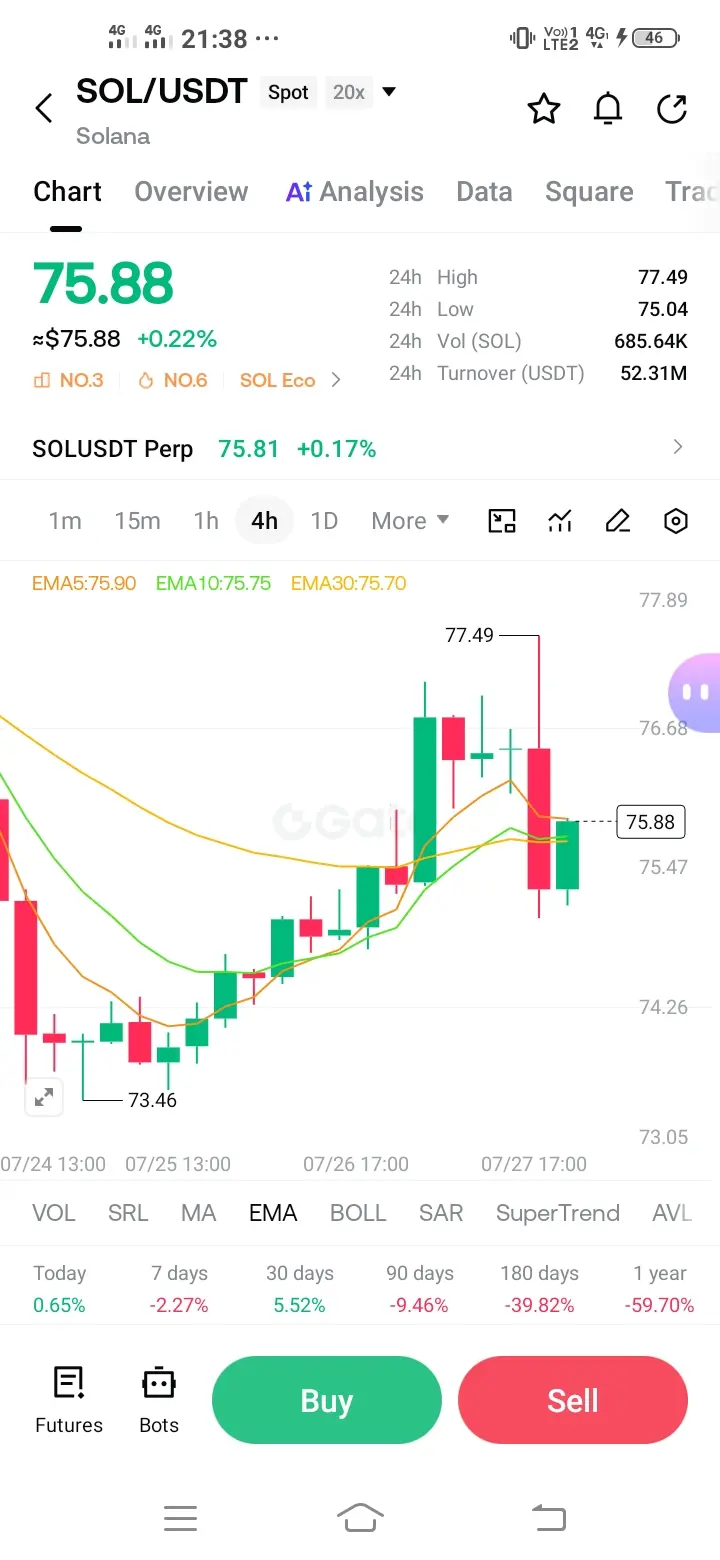
At the time of writing, SOL is trading around $75.84, remaining inside a consolidation range that has held for several weeks. Since early June, buyers have repeatedly defended the $63-$74 demand area while sellers continue protecting the $77-$80 resistance zone. This prolonged sideways movement usually signals that both bulls and bears are waiting for a major catalyst before committing to the next trend.
Looking at the broader picture, Solana remains approximately 74% below its all-time high of $293. The decline has been steady throughout 2026. January closed near $105.44, February around $84.37, March $83.11, April $83.02, May $82.30, June $73.52, and July has averaged close to $75.50. That represents nearly a 28% decline during the first seven months of the year. Although the chart appears weak, prolonged consolidations often become the foundation for larger trend reversals when accompanied by improving fundamentals.
One of the strongest bullish drivers is the upcoming Alpenglow upgrade. Expected to reach mainnet around October 2026, the upgrade aims to reduce transaction finality to roughly 150 milliseconds while increasing theoretical throughput toward 100,000 transactions per second. If delivered successfully, this would significantly strengthen Solana's competitive position against other smart contract networks. The upgrade also removes validator vote transaction fees, lowers operational costs, and improves decentralization by making validator participation more efficient.
Institutional interest has also remained surprisingly resilient despite weaker prices. Spot SOL investment products have reportedly attracted more than $1 billion in cumulative inflows, suggesting professional investors continue accumulating exposure during periods of market weakness rather than abandoning the asset completely. Large investors generally focus more on long-term infrastructure growth than short-term price volatility, making these inflows an encouraging signal.
Another important development is Solana's expanding role in real-world asset tokenization (RWA). More financial institutions are exploring blockchain-based asset issuance, and Solana has positioned itself as one of the preferred networks because of its speed and low transaction costs. On-chain RWA value has reportedly climbed above $1.6 billion, while payment-related initiatives, including stablecoin development, continue expanding the ecosystem beyond decentralized finance.
Developer activity also continues supporting the long-term investment thesis. During 2026, Solana reportedly surpassed Ethereum in new developer growth, with active developer participation increasing by roughly 45% and ecosystem share rising toward 23%. Historically, blockchain ecosystems attracting developers tend to experience stronger application growth, higher user activity, and increasing network demand over time.
Efficiency improvements remain another bullish factor. Proposed standards such as the P-token framework and SIMD-0266 aim to make the network substantially more resource efficient while reducing transaction costs and increasing scalability. Lower operational costs encourage broader application development and improve the overall user experience, strengthening network adoption over the long run.
From a technical perspective, Solana currently sits near the middle of its established trading range. Immediate support remains around $74.50-$74.80, where buyers have consistently stepped in during recent sessions. Below that, stronger demand exists between $73.00-$73.50, followed by another important support area near $71.70-$72.00. Losing these levels could expose $68-$69, while a deeper correction could eventually revisit the June low near $63, which remains the major structural support for the current cycle.
On the upside, the first resistance appears near $75.50, followed by the far more important $77-$78 zone. This level has become the primary battlefield between buyers and sellers. A convincing daily close above $77 would likely improve short-term momentum and could open the path toward $80-$82. Above that, the 100-day EMA near $81.70 becomes another technical hurdle before attention shifts toward the 200-day EMA around $97, which represents the first major medium-term recovery target.
Several analysts consider $77 the most important breakout level on the chart. If Solana successfully converts this resistance into support, momentum traders may begin targeting $97, followed by $120. Beyond those levels, forecasts for late 2026 become increasingly optimistic, with many projections ranging between $150 and $200 under favorable market conditions. Extremely bullish scenarios suggest potential moves toward $225-$300, although such targets would likely require strong Bitcoin performance, improving macroeconomic conditions, and continued institutional adoption.
Short-term technical indicators currently remain balanced. Momentum readings suggest approximately 47.5% bullish probability versus 52.5% bearish probability, indicating neither side has established decisive control. The daily RSI near 53.8 also reflects a neutral market without significant overbought or oversold conditions.
This combination generally supports continued consolidation unless an external catalyst appears.
Macroeconomic conditions continue influencing crypto markets. Higher oil prices, elevated Treasury yields, ongoing geopolitical uncertainty, and expectations surrounding the upcoming Federal Reserve meeting all contribute to cautious investor sentiment. At the same time, regulatory developments, including discussions surrounding the CLARITY Act, remain important for the broader digital asset industry. Any positive progress on regulation could improve confidence across the crypto market, while additional delays may temporarily limit upside momentum.
For traders focusing on the next 24 to 34 hours, the most likely scenario remains continued range trading between $73 and $78. Buying interest may appear near $74.50, while selling pressure could strengthen near $77-$78. A decisive breakout above $77 would shift short-term momentum in favor of buyers, whereas losing $73 would increase the probability of another test toward $68-$63.
Medium-term investors may find gradual accumulation between $73 and $75 attractive, provided they maintain proper risk management and understand that volatility could remain elevated ahead of major macroeconomic events. Patience remains important because infrastructure upgrades often require time before their full impact is reflected in market prices.
Overall, Solana remains one of the strongest blockchain ecosystems from a technology and development perspective despite its disappointing price performance throughout 2026. Network upgrades, institutional participation, growing developer activity, expanding RWA adoption, and increasing ecosystem utility all continue strengthening the long-term outlook. However, price recovery ultimately depends on broader market conditions and whether buyers can finally reclaim the critical $77-$80 resistance zone.
Key Levels to Watch
Current Price: $75.84
Immediate Support: $74.50
Major Support: $73.00 → $71.70 → $68.00 → $63.00
Immediate Resistance: $75.50
Major Resistance: $77.00 → $80.00 → $81.70 → $97.00
Medium-Term Targets: $97 → $120 → $150 → $200
Extended Bullish Scenario: $225-$300
For now, $77 remains the most important price level on the chart. A confirmed breakout above it could mark the beginning of Solana's next sustained recovery, while failure to reclaim it would likely keep the market trapped inside its current consolidation range until a stronger catalyst arrives.@Gate_Square
repost-content-media
  • Reward
  • 3
  • Repost
  • Share
BlackoutHawkCryptoBoy:
2026 GOGOGO 👊
View More
  • Pinned