GregMiller

vip
Web3 Creator
Crypto Market Researcher
Memecoin Hunter
Verified Content Creator | Educational Content | Do Your Own Research
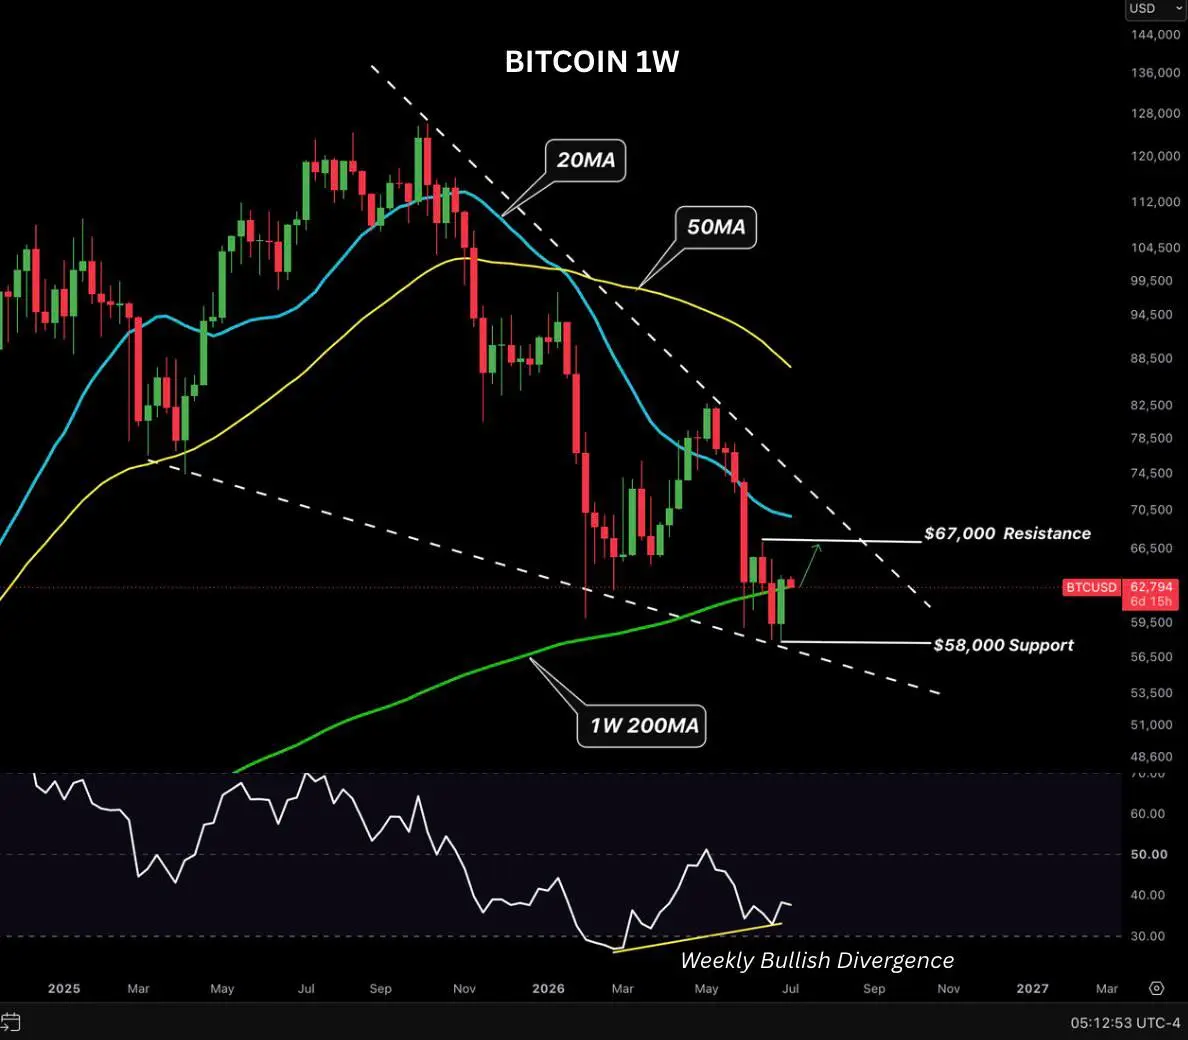
$BTC ripped 7% and reclaimed the 200W MA, decent sign after slipping below it. Still stuck under the 20W and 50W though, and the death cross hasn't flipped.
RSI divergence is forming, which is the real tell here. Macro's helping too, ISM near 4-year highs, Russell at ATHs, less noise from US-Iran talks.
$58K held. $67K decides if this is a reversal or just another lower high. Above it, $83K comes into view. Below it, the Q4 cycle-low crowd still has the mic.
Watching $67K, not the green candle.
BTC1.98%
post-image
  • Reward
  • Comment
  • Repost
  • Share
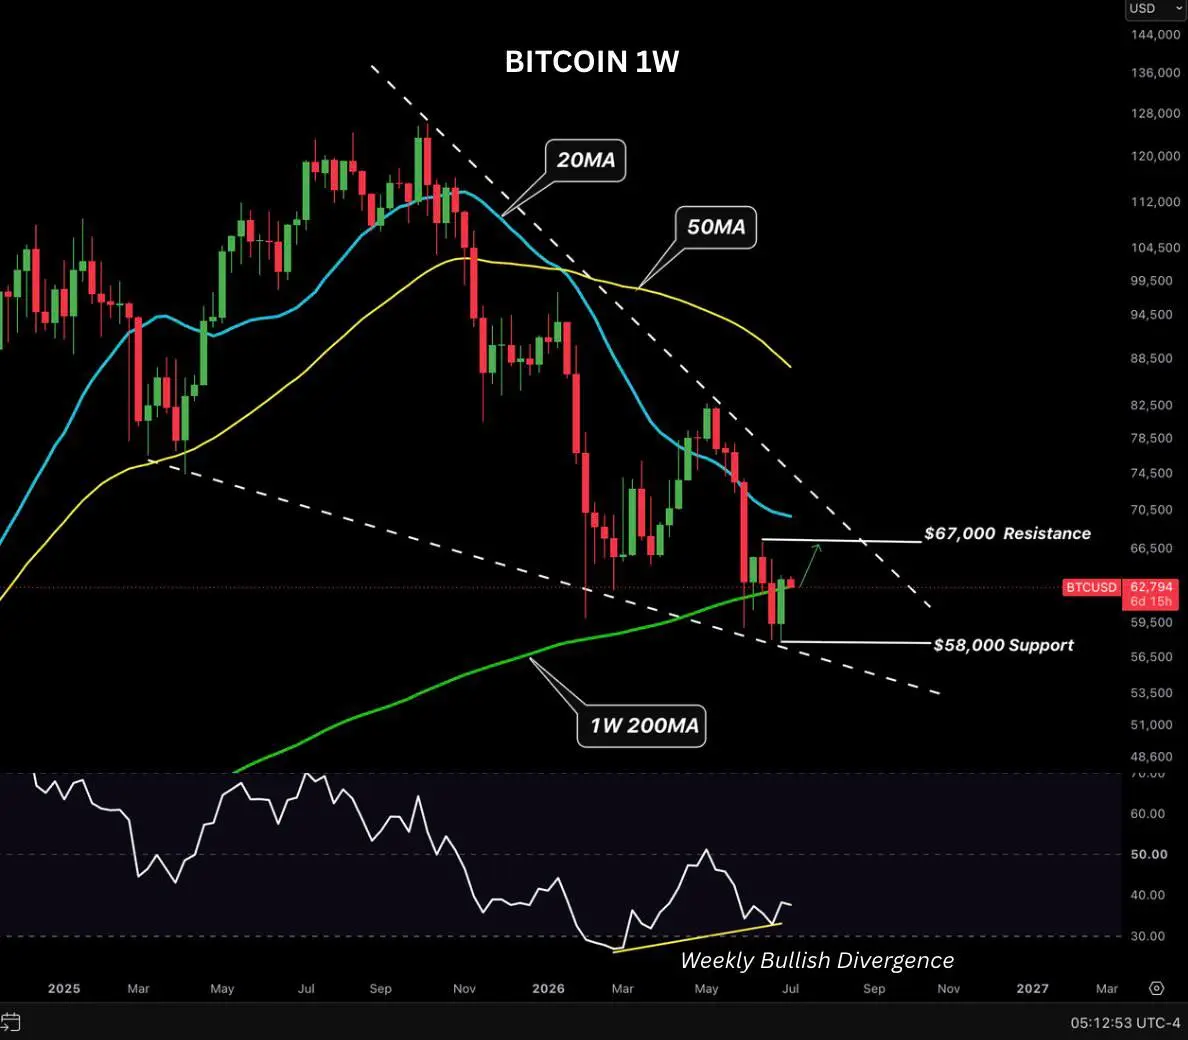
$BTC ripped 7% and reclaimed the 200W MA, decent sign after slipping below it. Still stuck under the 20W and 50W though, and the death cross hasn't flipped.
RSI divergence is forming, which is the real tell here. Macro's helping too, ISM near 4-year highs, Russell at ATHs, less noise from US-Iran talks.
$58K held. $67K decides if this is a reversal or just another lower high. Above it, $83K comes into view. Below it, the Q4 cycle-low crowd still has the mic.
Watching $67K, not the green candle.
BTC1.98%
post-image
  • Reward
  • Comment
  • Repost
  • Share
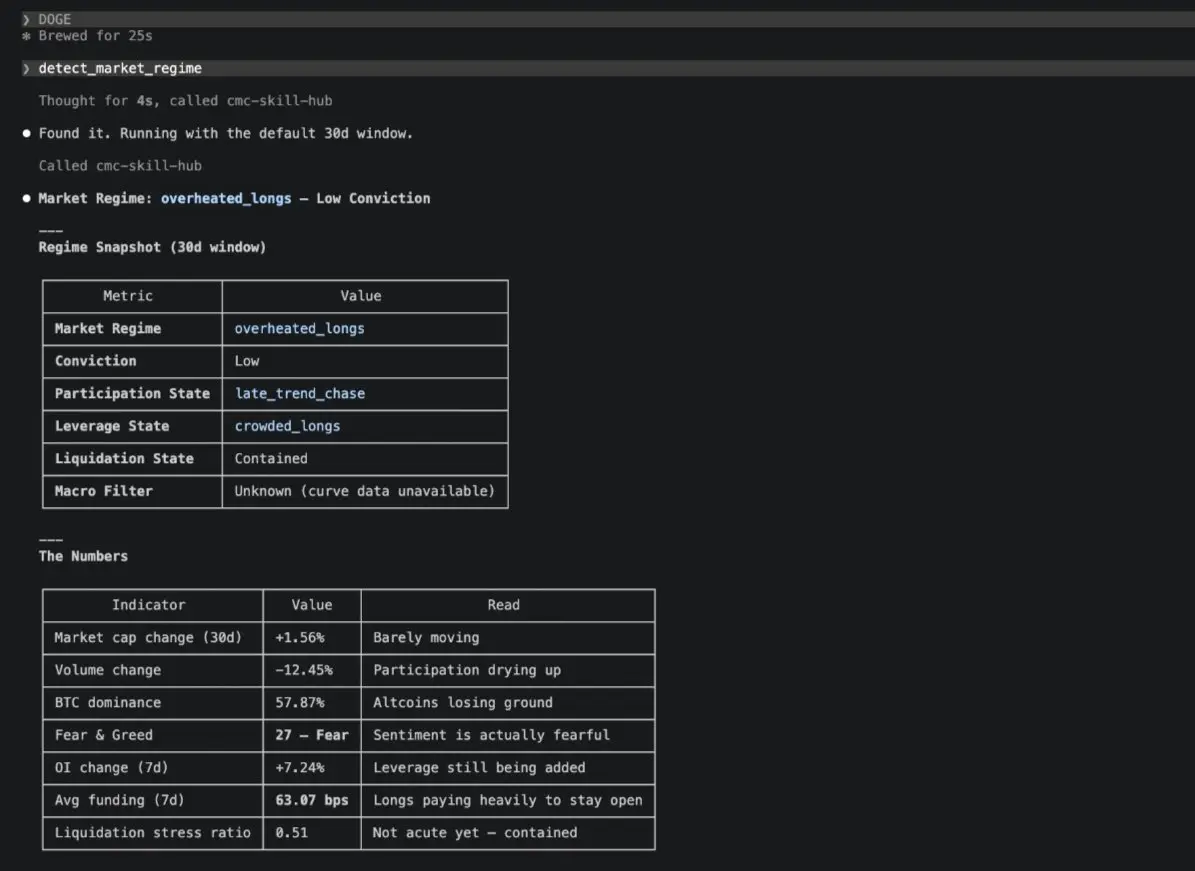
The market looks calm... but the data tells a different story.
Today I used the detect_market_regime skill from CoinMarketCap Agent Hub to understand what the current crypto market is really telling us.
Here's what caught my attention:
🔹 The market is currently in "Overheated Longs" with low conviction. This means many traders are opening long positions, but the overall confidence isn't very strong.
🔹 Open Interest is up 7.24%, showing that more leveraged positions are entering the market.
🔹 Trading volume is down 12.45%, while the market has only gained 1.56% over the last 30 days. Buyers
BTC2.08%
post-image
  • Reward
  • Comment
  • Repost
  • Share
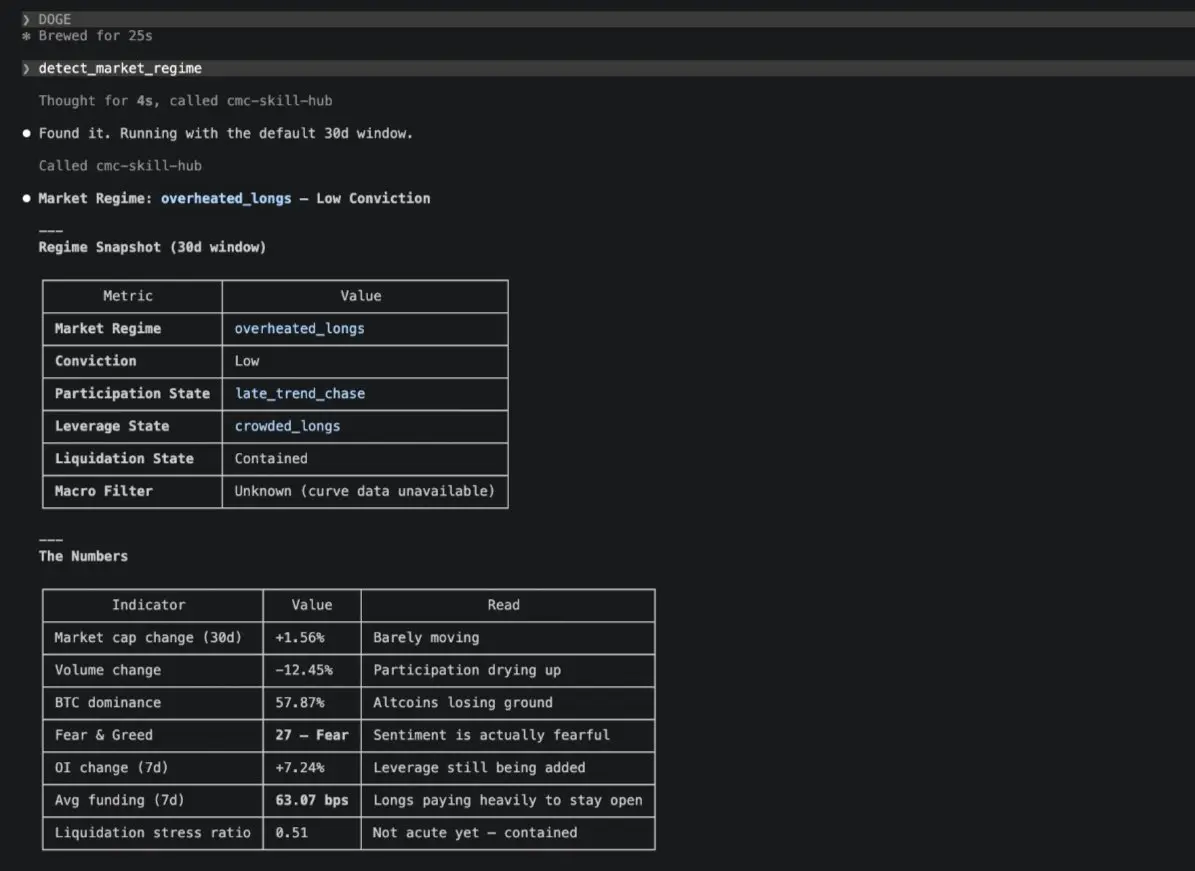
The market looks calm... but the data tells a different story.
Today I used the detect_market_regime skill from CoinMarketCap Agent Hub to understand what the current crypto market is really telling us.
Here's what caught my attention:
🔹 The market is currently in "Overheated Longs" with low conviction. This means many traders are opening long positions, but the overall confidence isn't very strong.
🔹 Open Interest is up 7.24%, showing that more leveraged positions are entering the market.
🔹 Trading volume is down 12.45%, while the market has only gained 1.56% over the last 30 days. Buyers
post-image
  • Reward
  • Comment
  • Repost
  • Share
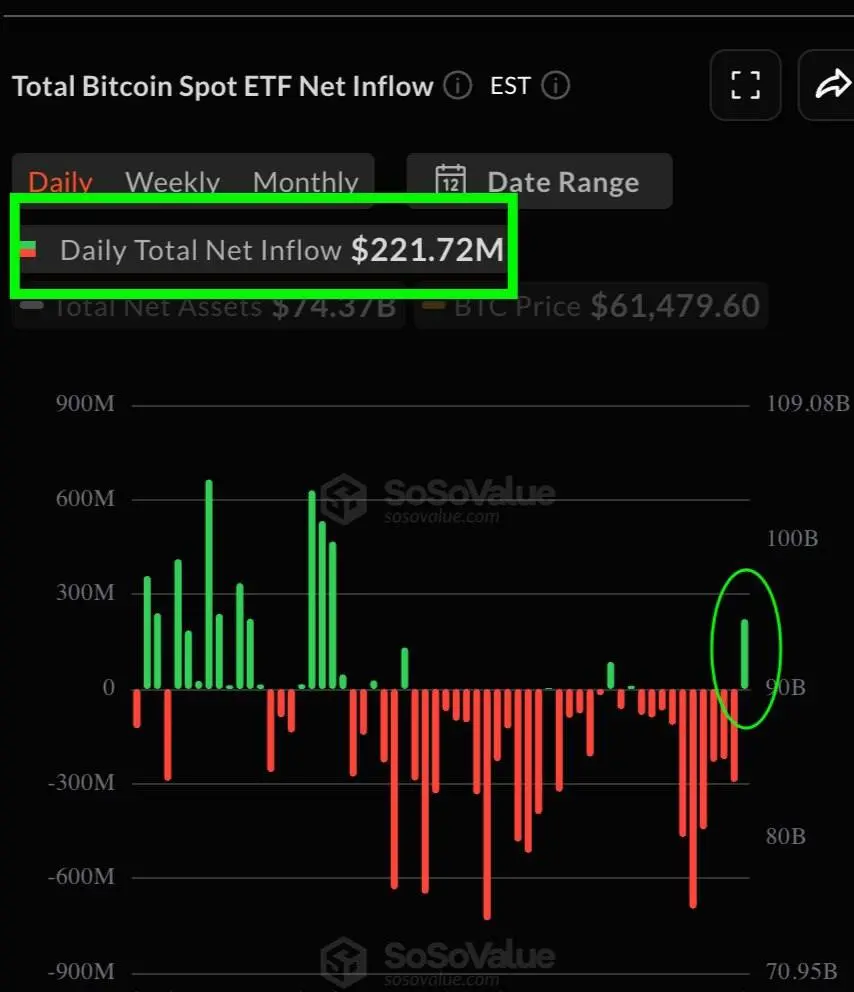
$BTC ETFs are back in accumulation mode.
After 10 consecutive days of outflows, U.S. Spot Bitcoin ETFs recorded a massive $221.7M net inflow, the largest single-day buy in 59 days.
This shift could signal renewed institutional confidence. If sustained, ETF demand may become a strong tailwind for the next phase of Bitcoin's price action.
Smart money is buying again.
post-image
  • Reward
  • 2
  • Repost
  • Share
TimeBoilsRainPlusSpace:
When the rebound is almost done, the outflow begins.
View More
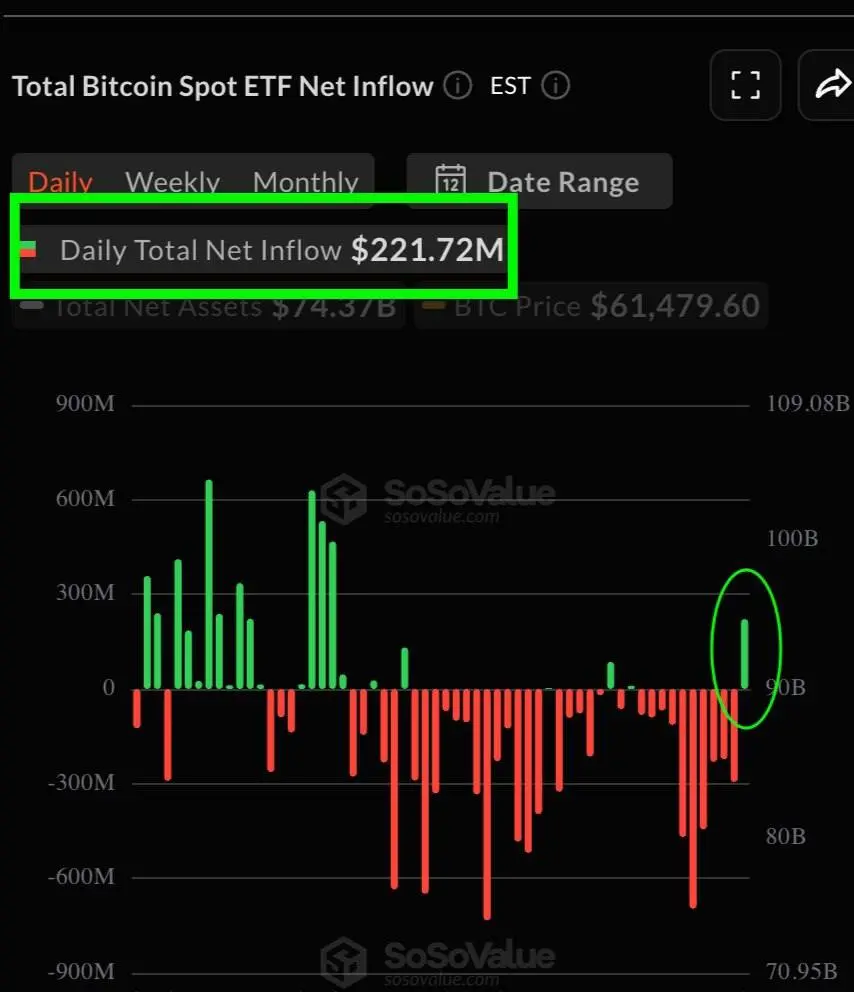
$BTC ETFs are back in accumulation mode.
After 10 consecutive days of outflows, U.S. Spot Bitcoin ETFs recorded a massive $221.7M net inflow, the largest single-day buy in 59 days.
This shift could signal renewed institutional confidence. If sustained, ETF demand may become a strong tailwind for the next phase of Bitcoin's price action.
Smart money is buying again.
post-image
  • Reward
  • Comment
  • Repost
  • Share
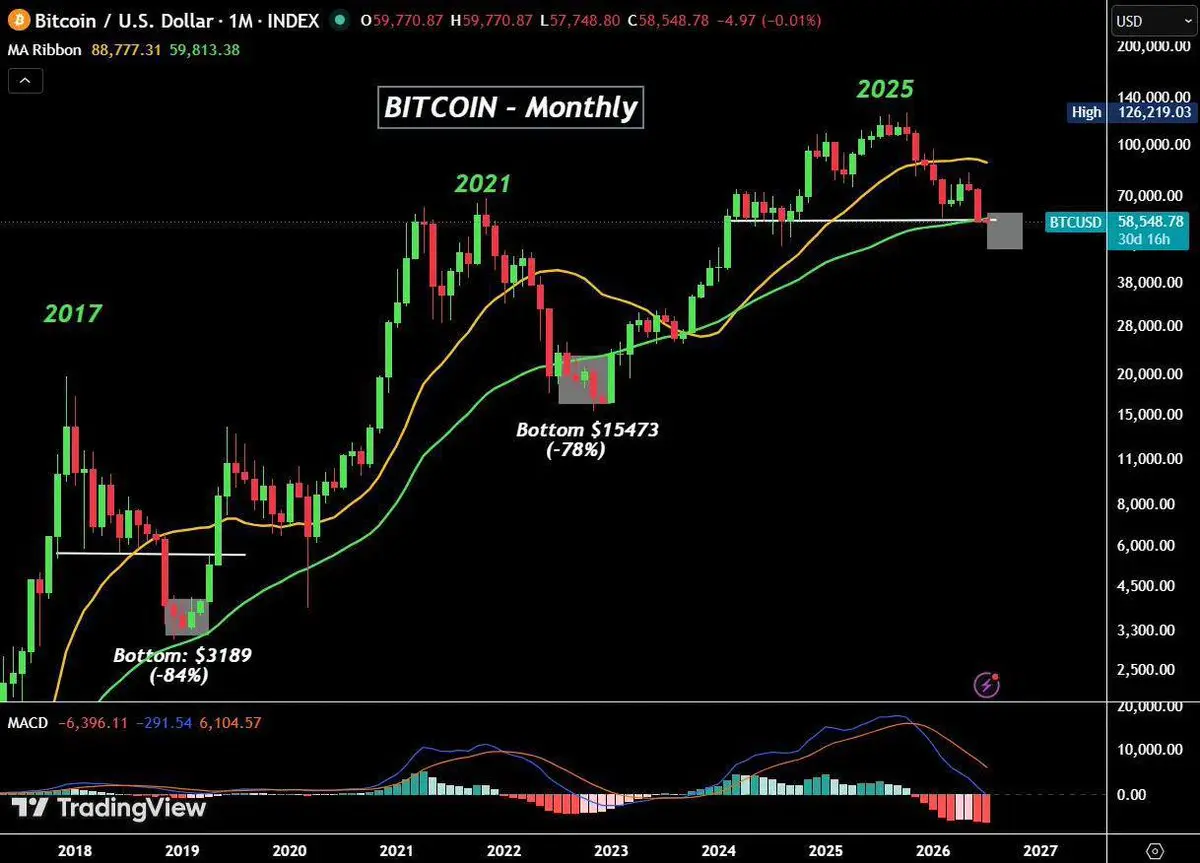
$BTC is back at a familiar point in the cycle.
The monthly candle closed below the 50 MA, and the MACD is now at its weakest level since the last bear market. In the past, this is where fear was highest, but it also marked good accumulation areas.
At the same time, the macro picture is getting better:
• ISM PMI is at a 4-year high
• Oil is below $68.50, helping ease inflation
• Job openings are at a 2-year high
If the 4-year cycle plays out again, the next 2–3 months could be the last good accumulation phase before the next big move.
The key level to watch is $62.6K (200W MA). A move above it
BTC1.98%
post-image
  • Reward
  • 3
  • 1
  • Share
GateUser-378c4af2:
thanks for the useful information 🤠
View More
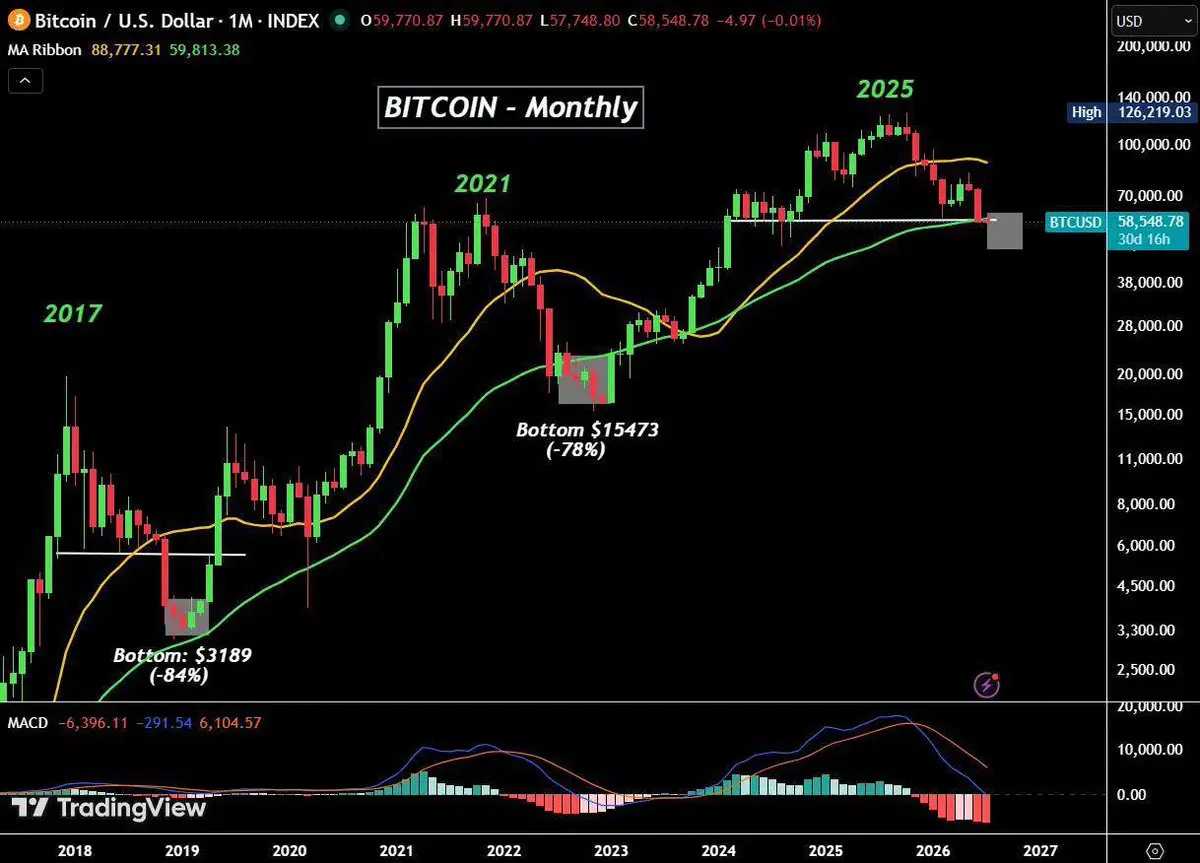
$BTC is back at a familiar point in the cycle.
The monthly candle closed below the 50 MA, and the MACD is now at its weakest level since the last bear market. In the past, this is where fear was highest, but it also marked good accumulation areas.
At the same time, the macro picture is getting better:
• ISM PMI is at a 4-year high
• Oil is below $68.50, helping ease inflation
• Job openings are at a 2-year high
If the 4-year cycle plays out again, the next 2–3 months could be the last good accumulation phase before the next big move.
The key level to watch is $62.6K (200W MA). A move above it
BTC1.98%
post-image
  • Reward
  • 1
  • Repost
  • Share
BcryptexBTC:
Macro conditions are improving but price still needs to confirm the trend Patience usually pays better than predictions
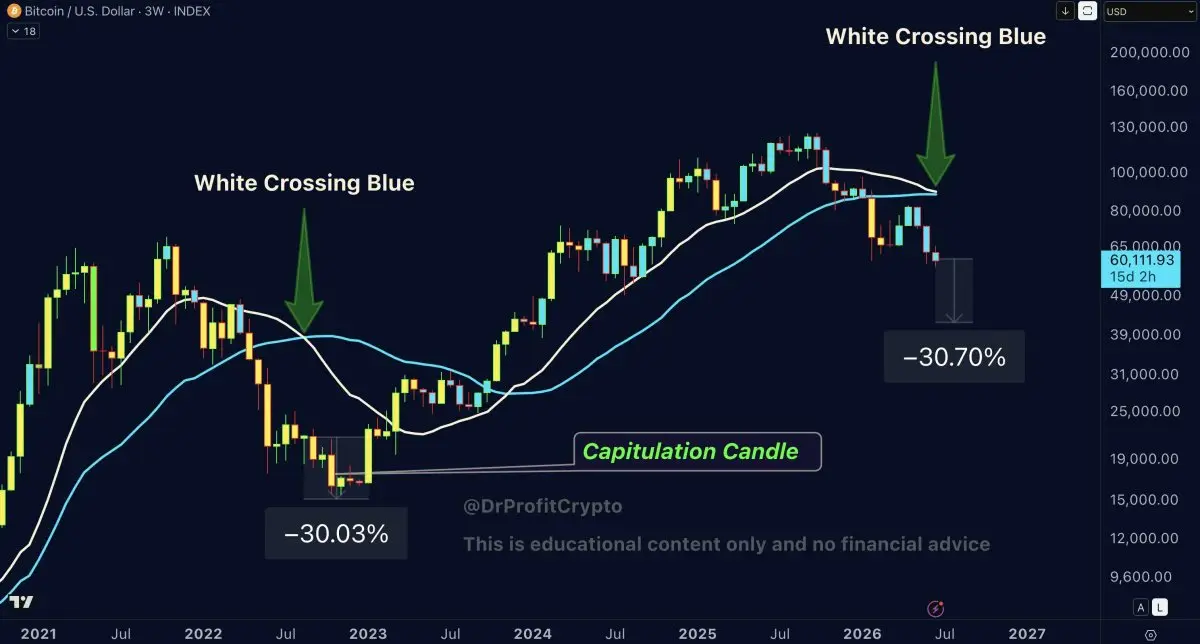
Looking at this 3-week $BTC chart and something is hard to ignore.
Back in 2022, the white MA crossed below the blue, and within two months Bitcoin printed a capitulation candle down −30.03% before finding any real bottom.
That same "white crossing blue" setup is forming again right now.
From current levels near $60K, a −30.70% move puts price directly in the $42K–$43K range.
The scary part? Capitulation hasn't even happened yet. This is just the setup phase.
BTC1.98%
post-image
  • Reward
  • Comment
  • Repost
  • Share
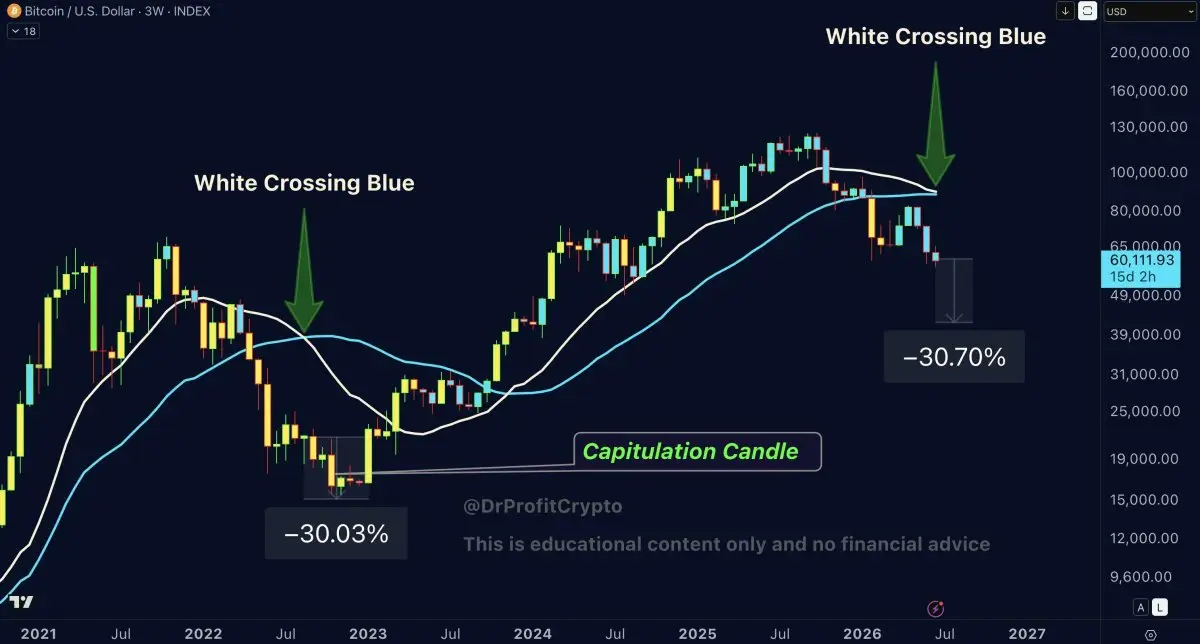
Looking at this 3-week $BTC chart and something is hard to ignore.
Back in 2022, the white MA crossed below the blue, and within two months Bitcoin printed a capitulation candle down −30.03% before finding any real bottom.
That same "white crossing blue" setup is forming again right now.
From current levels near $60K, a −30.70% move puts price directly in the $42K–$43K range.
The scary part? Capitulation hasn't even happened yet. This is just the setup phase.
BTC1.98%
post-image
  • Reward
  • Comment
  • Repost
  • Share
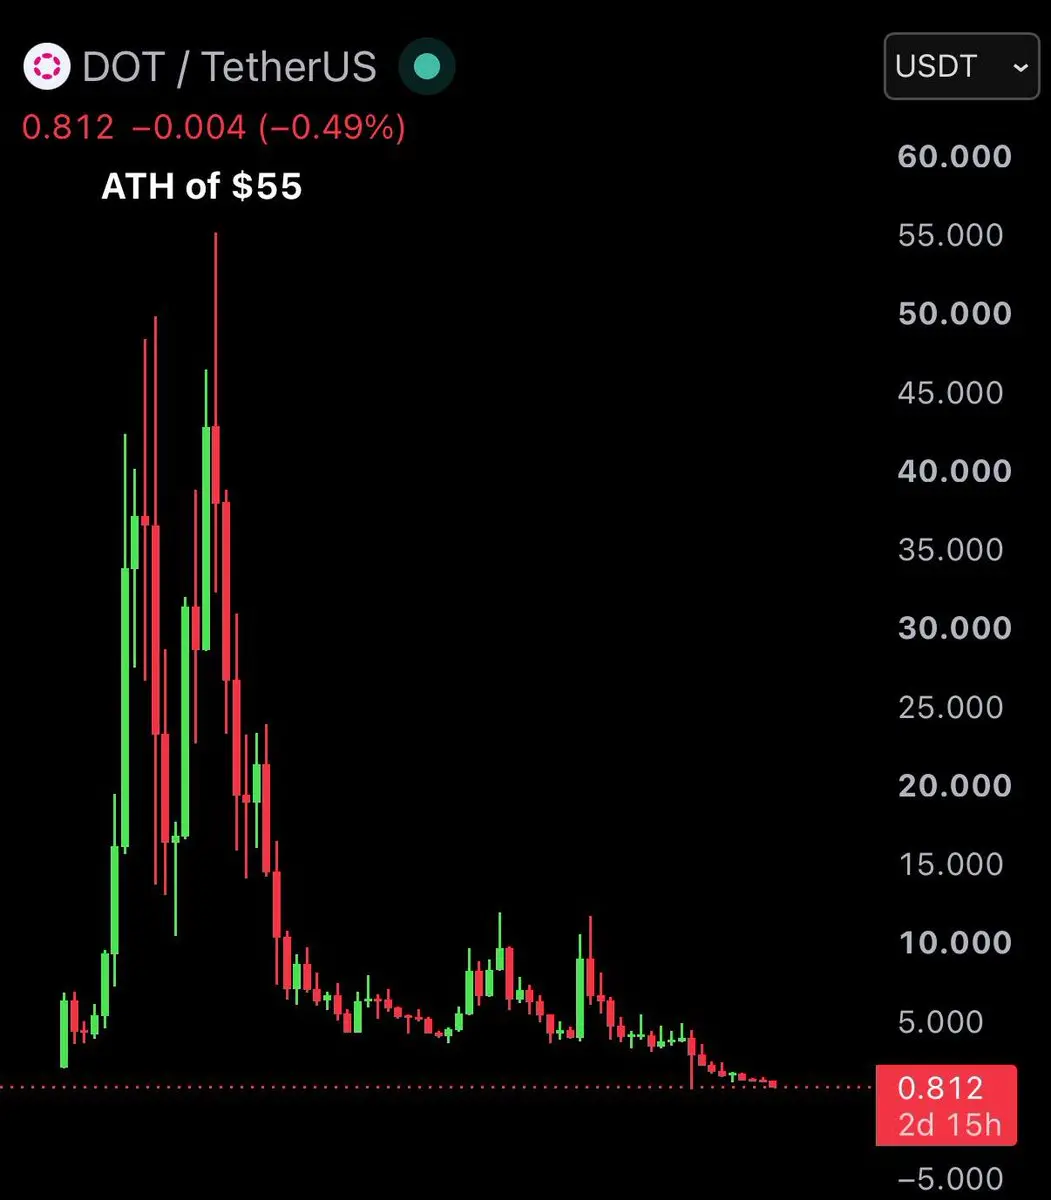
$DOT hit an ATH of $55 back in 2021. Today it's sitting at $0.81.
If you put $10,000 in at the peak, your portfolio is worth $136 right now.
That's a 98.5% drawdown over 4 years from a top-10 project with real technology and serious backing. Not some random memecoin. @Polkadot
This is why entry point matters more than almost anything else in crypto. The best project in the world can still destroy your portfolio if you buy at the wrong time.
Do your research. Manage your position sizes. And never put in money you aren't prepared to lose entirely.
DOT-0.04%
post-image
  • Reward
  • Comment
  • Repost
  • Share
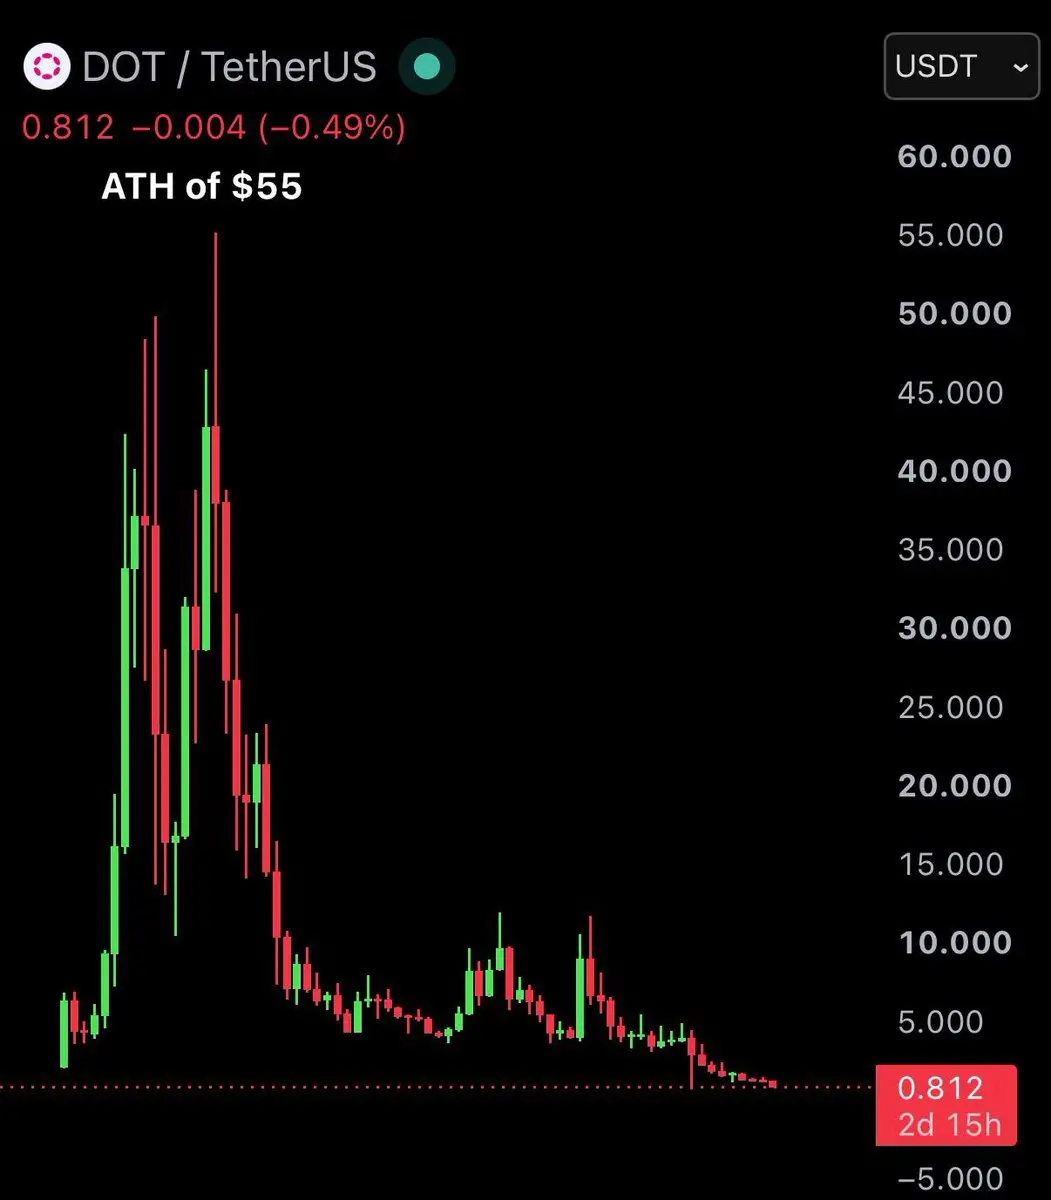
$DOT hit an ATH of $55 back in 2021. Today it's sitting at $0.81.
If you put $10,000 in at the peak, your portfolio is worth $136 right now.
That's a 98.5% drawdown over 4 years from a top-10 project with real technology and serious backing. Not some random memecoin. @Polkadot
This is why entry point matters more than almost anything else in crypto. The best project in the world can still destroy your portfolio if you buy at the wrong time.
Do your research. Manage your position sizes. And never put in money you aren't prepared to lose entirely.
DOT-0.04%
post-image
  • Reward
  • Comment
  • Repost
  • Share
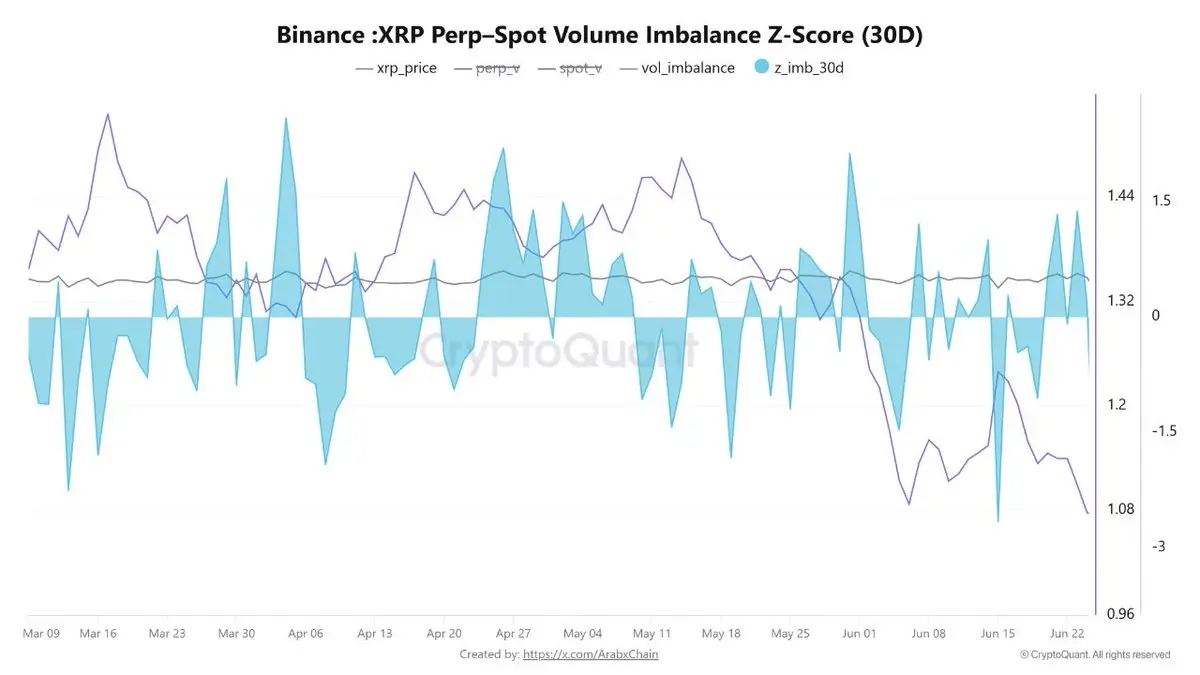
$XRP perp-spot volume imbalance Z-score just crashed toward -3 on Binance.
For most of March through May, the Z-score oscillated near neutral. Price held between $1.20–$1.44 during that range.
Then June hit. The imbalance flipped sharply negative as price dumped from $1.44 all the way to $1.06.
Perpetual volume is collapsing relative to spot. That's not a healthy reset, that's derivatives traders stepping away from the long side entirely.
The last time the Z-score touched these levels, price was already in recovery mode. This time it's still falling.
No extreme crowding yet. But no reversal si
XRP0.67%
post-image
  • Reward
  • Comment
  • Repost
  • Share
Crypto is the most undervalued it has ever been.
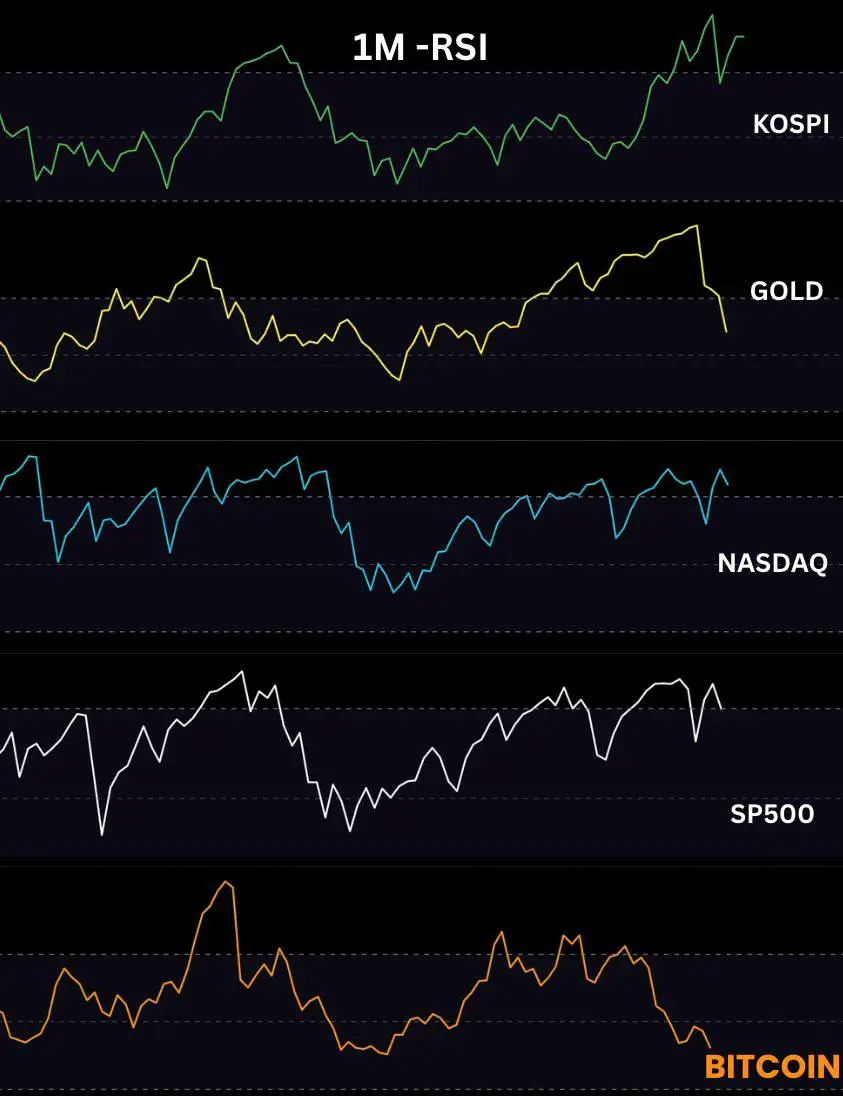
Look at the 1M RSI. KOSPI pushing highs. Gold near highs. NASDAQ and SP500 both recovered. Bitcoin RSI still at the bottom.
Every major asset has already moved. Crypto hasn't.
When liquidity rotates, the catch up rally will be insane.
BTC1.98%
post-image
  • Reward
  • Comment
  • 1
  • Share
Crypto is the most undervalued it has ever been.
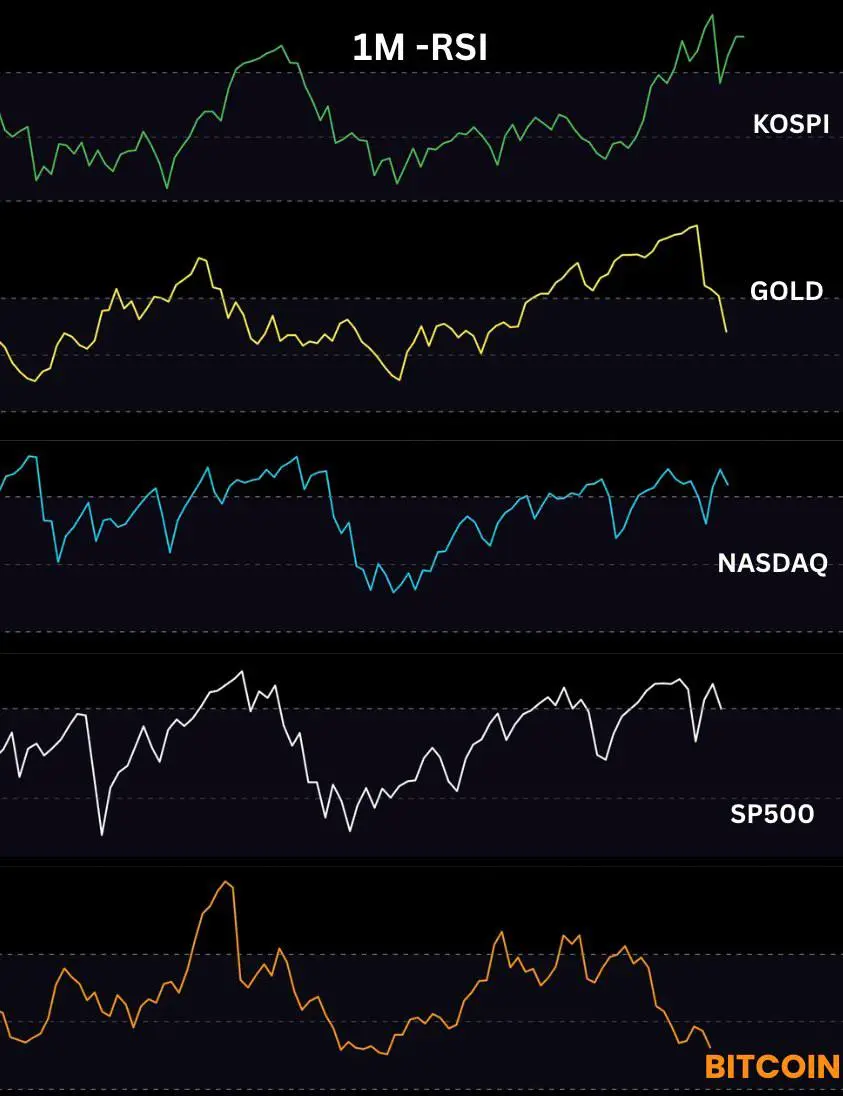
Look at the 1M RSI. KOSPI pushing highs. Gold near highs. NASDAQ and SP500 both recovered. Bitcoin RSI still at the bottom.
Every major asset has already moved. Crypto hasn't.
When liquidity rotates, the catch up rally will be insane.
XAU0.34%
BTC1.98%
post-image
  • Reward
  • Comment
  • Repost
  • Share
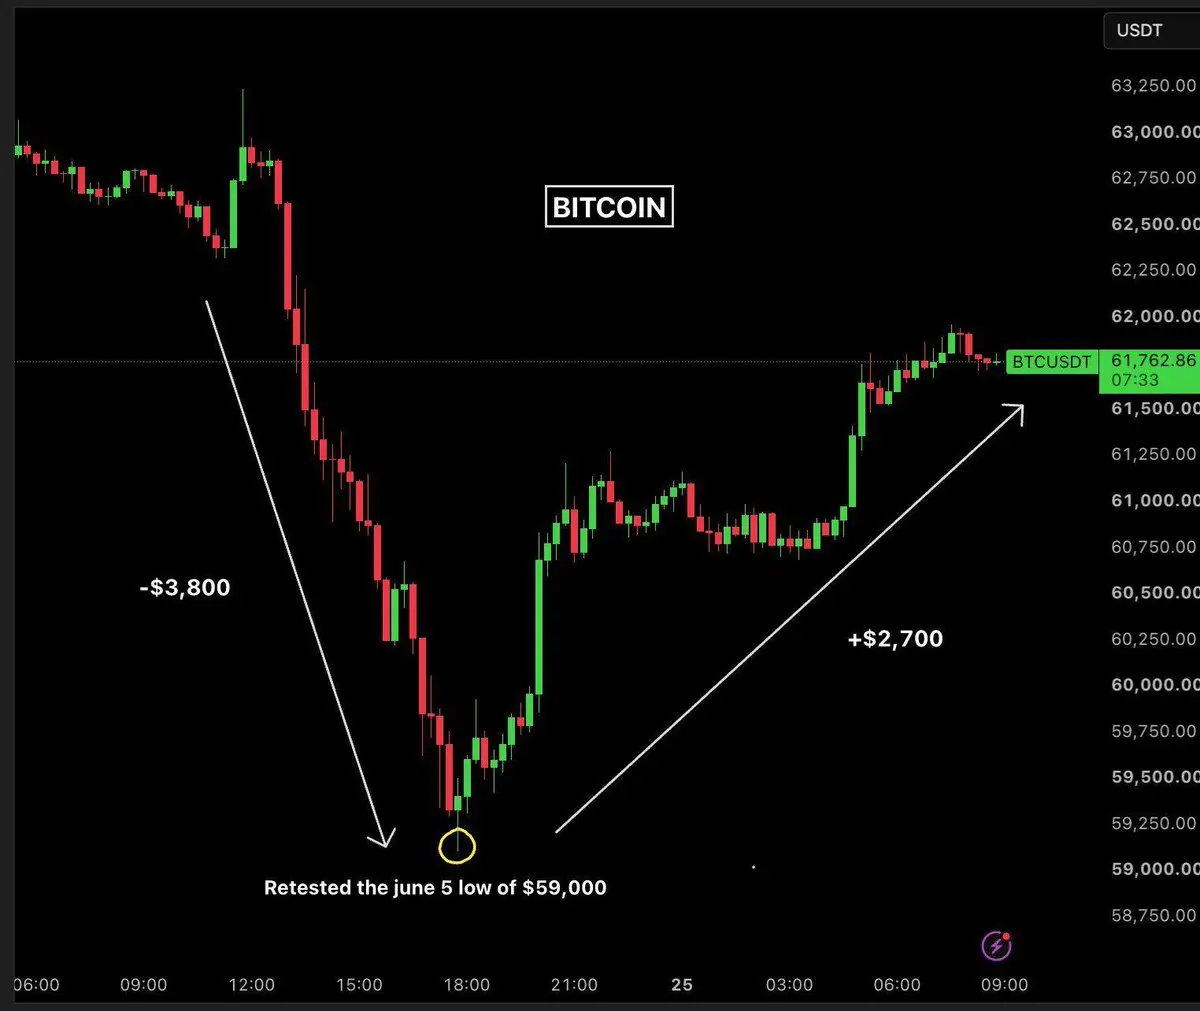
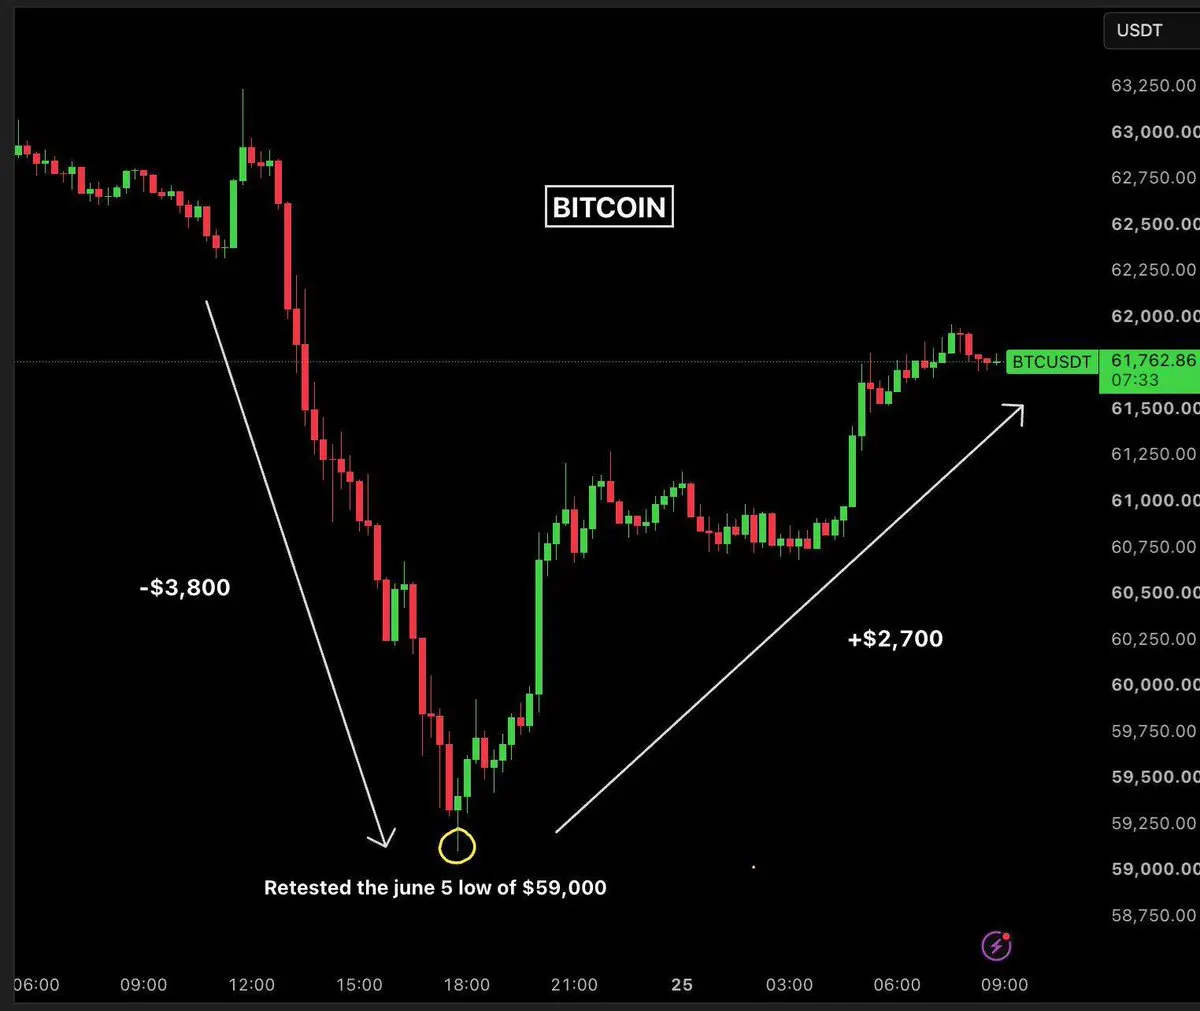
$BTC dropped $3,800, liquidated $300M in longs, retested the June 5 low at $59,100, then bounced $2,700 in the same session.
Yearly low touched. Panic cleared. Price closed back above $61K.
$59K has now been tested twice. Third time will be the real answer.
BTC2.08%
post-image
  • Reward
  • Comment
  • Repost
  • Share
$BTC dropped $3,800, liquidated $300M in longs, retested the June 5 low at $59,100, then bounced $2,700 in the same session.
Yearly low touched. Panic cleared. Price closed back above $61K.
$59K has now been tested twice. Third time will be the real answer.
BTC2.08%
post-image
  • Reward
  • Comment
  • Repost
  • Share
US and Iran just agreed on a 60-day roadmap for a final deal in Switzerland.
Strait of Hormuz communication line active. Lebanon deconfliction mechanism done. 18 hours of talks that almost fell apart midway.
Markets already reacted. Oil down $4. Bitcoin back above $64K. Nikkei all-time high. Gold at $4,200.
This is what risk-off to risk-on looks like in real time.
War premium coming off oil means inflation pressure easing means capital rotating back into risk assets.
Not saying it's over. 60 days is still 60 days. But the map exists now.
Watch this space
BTC1.98%
post-image
  • Reward
  • Comment
  • Repost
  • Share
  • Pinned