Sand谋3S

vip
Age 0.5 Year
Peak Tier 0
Student,crypto lover
#StakeUSD1Earn8.88%APR
Gate has updated its soft staking product for the USD1 stablecoin, setting the current annual yield at 8.88%. This product provides passive income to users holding USD1 without any lock-up period.
The product works quite simply: the system takes a snapshot of the user's USD1 balance 24 times a day, or once an hour. Daily returns are calculated based on the average of these snapshots and transferred to the Assets account the next day. For users with a Combined Account, the trading account is included in this calculation, while for those with a Classic Account, spot, futu
USD10.01%
WhyFay
#StakeUSD1Earn8.88%APR
Gate has updated its soft staking product for the USD1 stablecoin, setting the current annual yield at 8.88%. This product provides passive income to users holding USD1 without any lock-up period.
The product works quite simply: the system takes a snapshot of the user's USD1 balance 24 times a day, or once an hour. Daily returns are calculated based on the average of these snapshots and transferred to the Assets account the next day. For users with a Combined Account, the trading account is included in this calculation, while for those with a Classic Account, spot, futures, delivery, and options accounts are considered. USD1 held in Flexible or Fixed Term Earnings products is excluded from this calculation.
The most notable aspect of this product is that users can simultaneously use their USD1 for trading or as collateral without any lock-up period. This means a user can both hold active positions in the market and continue earning daily returns on their balance, providing two different benefits without limiting their capital to a single purpose.
It's important to note that the rate of return is not fixed. According to the campaign rules, the annual rate of return is dynamically adjusted daily based on the remaining reward budget for that month and the total amount of USD1 available on the platform, with any changes announced in advance. This mechanism means that the rate may decrease over time during periods of increased participation, making early participation generally more advantageous.
There are also some important warnings on the risk side. USD1 itself carries inherent risks such as price volatility, smart contract vulnerabilities, and potential regulatory changes. The displayed annual rate of return is an estimate, not a guaranteed return; the actual reward value can fluctuate depending on the market price of USD1. Users in the UK and some restricted regions are not eligible for this service.
For users seeking stable returns through Gate while also holding active market positions, the main practical advantage of this product is that it offers both trading flexibility and daily returns without leaving capital immobile. Given that the current rate may change daily, it is recommended to check the current APR page before participating.

  • Reward
  • Comment
  • Repost
  • Share
Gate has launched a new gold-themed campaign for futures traders, incentivizing both new and existing users with the chance to win both cash and gold.
The first tier of the campaign is for new users; those who make their first futures trade of 300 USDT or more receive 2 USDT directly. The second tier operates through a referral program; users who invite friends and help them complete their first trades can earn up to an additional 10 USDT.
The most notable aspect of the campaign is the gold raffle. Users earn one raffle entry for every 2,000 USDT in futures trading volume, and each raffle entr
XAU0.07%
XAUT0.07%
SinCity
Gate has launched a new gold-themed campaign for futures traders, incentivizing both new and existing users with the chance to win both cash and gold.
The first tier of the campaign is for new users; those who make their first futures trade of 300 USDT or more receive 2 USDT directly. The second tier operates through a referral program; users who invite friends and help them complete their first trades can earn up to an additional 10 USDT.
The most notable aspect of the campaign is the gold raffle. Users earn one raffle entry for every 2,000 USDT in futures trading volume, and each raffle entry offers a chance to win up to 10 grams of gold in XAUT, which is automatically credited to their account. XAUT is a tokenized asset backed one-to-one with physical gold, meaning the prize from this raffle is credited to the account as an asset based on the value of real gold.
This structure reflects Gate's recent emphasis on gold and commodity-related products. The platform ranks highly globally in both XAUT and physical gold-backed futures contracts, and these types of lottery-based campaigns aim to increase user interest, especially given the recent high volatility in gold prices.
Participation generally doesn't require registration; users simply need to meet the minimum trading volume and are automatically included in the lottery pool with cash prizes. As futures trading volume increases, the number of lottery entries increases proportionally, offering active traders a greater chance of winning.
For users considering or already actively trading futures through Gate, the main practical advantage is that their regular trading activity automatically counts towards these rewards, offering both instant cash earnings and participation in the gold lottery without extra effort. It's recommended to check the relevant announcement page for current details regarding participation conditions and campaign duration, as account type restrictions and time limits may apply to such campaigns.
Join 👉https://www.gate.com/campaigns/5421?ref_type=132
DYOR 🔍 NFA ✅
  • Reward
  • Comment
  • Repost
  • Share
Japan's 10-year government bond yield has reached a truly dramatic level, climbing above 2.8 percent, its highest level since May 1997 – practically unseen in nearly thirty years.
Several factors are at play behind this rise. The most concrete trigger was a weak 10-year bond auction this week, where the tail – the difference between the lowest accepted price and the average price – widened from 0.05 points in the previous June auction to 0.2 points, indicating significantly weaker demand. Market commentators attribute this to growing concerns about the government's spending plans.
The bigger p
Yuewen
Japan's 10-year government bond yield has reached a truly dramatic level, climbing above 2.8 percent, its highest level since May 1997 – practically unseen in nearly thirty years.
Several factors are at play behind this rise. The most concrete trigger was a weak 10-year bond auction this week, where the tail – the difference between the lowest accepted price and the average price – widened from 0.05 points in the previous June auction to 0.2 points, indicating significantly weaker demand. Market commentators attribute this to growing concerns about the government's spending plans.
The bigger picture, however, lies in the comprehensive long-term economic strategy announced by the Japanese government. The plan aims to mobilize over 370 trillion yen, approximately $2.29 trillion, in investment by fiscal year 2040, through a combination of public and private sector investment, to strengthen strategic sectors. A spending commitment on this scale naturally implies a need for additional borrowing, and the bond market is pricing in this uncertainty. The 30-year bond yield has also risen to 4 percent under similar pressure, indicating that long-term borrowing costs are moving in the same direction.
The yen itself is both a cause and an effect in this picture. Its near-weakness against the dollar in forty years is putting pressure on the central bank to raise interest rates further, pushing bond yields higher. But rising yields also create a problem in themselves, because Japan is an economy carrying debt roughly 260 percent of its gross domestic product, and much of this debt has been managed for many years under the assumption of cheap yen financing. As yields rise, debt servicing costs also increase directly, creating a real constraint on how quickly the central bank can raise interest rates.
This puts Japan in a real dilemma. A weak yen fuels import-driven inflation, necessitating interest rate hikes, but these hikes increase debt servicing costs and can further strain already weak bond demand. In a scenario where the central bank cannot react quickly enough between these two pressures, the cycle can become self-reinforcing, with a weaker yen leading to even weaker yen, while rising yields fuel concerns about fiscal sustainability.
For those tracking yen-linked assets and global liquidity conditions via Gate, the key question is to what extent these rising yields will incentivize Japanese investors to sell off their overseas assets and bring them back home. Japan has long been one of the largest exporters of capital to global markets, and such a return could directly impact global liquidity conditions and risk assets, including cryptocurrencies.
  • Reward
  • Comment
  • Repost
  • Share
SAYLOR SOLD #StrategySells3588BTC , TOM LEE #BitMineAdded42197ETH .
These two developments, occurring within the same week, demonstrate that institutional crypto treasury strategies can no longer be reduced to a single model, and the contrast between the two is truly striking.
Between June 29 and July 5, Strategy sold 3,588 bitcoins, generating $216 million in return. This was the first truly noteworthy bitcoin sale in the company's institutional history, following founder Michael Saylor's long-held "never sell" stance. The proceeds from the sale were used to fund dividend payments on the com
BTC2.63%
ETH2.62%
Yuewen
SAYLOR SOLD #StrategySells3588BTC , TOM LEE #BitMineAdded42197ETH .
These two developments, occurring within the same week, demonstrate that institutional crypto treasury strategies can no longer be reduced to a single model, and the contrast between the two is truly striking.
Between June 29 and July 5, Strategy sold 3,588 bitcoins, generating $216 million in return. This was the first truly noteworthy bitcoin sale in the company's institutional history, following founder Michael Saylor's long-held "never sell" stance. The proceeds from the sale were used to fund dividend payments on the company's preferred stock series and increase its dollar reserves to approximately $2.55 billion, marking the first actual application of its newly adopted Digital Credit Capital Framework. Following the sale, the company still holds the title of the world's largest institutional bitcoin holder with 843,775 BTC.
Meanwhile, during the same period, BitMine moved in the completely opposite direction. Last week, the company purchased an additional 42,197 ETH, bringing its total holdings to 5,742,237 ETH, which is approximately 4.8% of Ethereum's circulating supply. BitMine's acquisition rate increased compared to the previous week, and the company is now ninety-five percent closer to its five percent target, which it calls the "alchemy of five." 4.88 million ETH of its total holdings are actively staked, generating approximately $235 million in annual staking revenue.
The real question is whether BitMine will adopt Strategy's new capital management model in the future, or remain a pure accumulation vehicle. The fundamental difference in the structure of the two companies provides a key clue here. Strategy's preferred stock series create obligations requiring regular cash dividend payments, which can sometimes force the company to sell assets to meet its cash needs. BitMine's model is built on a different revenue mechanism; staked ETH generates yield directly on the network, meaning a continuous income stream can be created without the company needing to sell assets to meet its cash needs. This structural difference suggests that BitMine may not face the same level of liquidity pressure as Strategy at the same pace.
But this doesn't mean BitMine will never transition to a similar framework. BitMine's preferred stock is already traded on the exchange, and if the company moves towards issuing similar fixed-income instruments over time, the likelihood of facing cash flow pressure similar to what Strategy experienced may increase. The company's current aggressive buying pace and staking revenue-based model keep it away from such pressure in the short term, but as it continues to raise more funds from capital markets in the long term, similar liabilities are a likely scenario.
How the market interprets these two movements is also important; some commentators see it as a partial rotation of institutional capital from Bitcoin to Ethereum, especially with ETH's strong performance against Bitcoin in recent weeks. For those following both assets and institutional treasury companies through Gate, the key question is whether BitMine's staking revenue-based model can continue to grow without facing the kind of structural cash flow problem Strategy encountered, because the path these two companies are following provides the most concrete example of the direction institutional crypto treasury strategies will evolve in the coming period.
$BTC $ETH
  • Reward
  • Comment
  • Repost
  • Share
#PredictWorldCup🇦🇷vs🇪🇬
Today's match is actually a round of 16 encounter, not a quarter-final, but it's one of the most noteworthy matchups of the tournament, bringing together two of the biggest names in football history.
Argentina hosts Egypt at Atlanta Stadium, and the duel between Lionel Messi and Mohamed Salah is the biggest draw for the match in terms of ratings. Argentina topped their group but almost fell victim to one of the biggest upsets in history against Cape Verde in the round of 32, only managing a 3-2 victory after an own goal in extra time. Egypt, on the other hand, reach
User_any
#PredictWorldCup🇦🇷vs🇪🇬
Today's match is actually a round of 16 encounter, not a quarter-final, but it's one of the most noteworthy matchups of the tournament, bringing together two of the biggest names in football history.
Argentina hosts Egypt at Atlanta Stadium, and the duel between Lionel Messi and Mohamed Salah is the biggest draw for the match in terms of ratings. Argentina topped their group but almost fell victim to one of the biggest upsets in history against Cape Verde in the round of 32, only managing a 3-2 victory after an own goal in extra time. Egypt, on the other hand, reached the round of 16 for the first time after beating Australia 4-2 on penalties following a 1-1 draw, which was also the country's first ever World Cup victory.
The history between the two teams is quite limited; they have never met in an official World Cup match, except for a friendly in 2008 where Argentina won 2-0, and a 6-0 victory at the 1928 Olympics. This will be the first official World Cup match between the two countries.
Opta's supercomputer model gives Argentina a 69.1% chance of winning in regulation time, while Egypt has a 12.3% chance, with the remaining approximately 18.5% attributed to the possibility of the match going into extra time. The numbers clearly favor Argentina, but Egypt's resilience in this tournament, especially with Salah in form, makes the possibility of a surprise not entirely ruled out. If Egypt wins, they will become the fifth African country to reach the quarterfinals, following Cameroon, Senegal, Ghana, and Morocco.
The winner will face the winner of the Switzerland-Colombia match in Kansas City on July 11th.
Who do you think is the favorite? Share your prediction now via Gate. (I don't know much about football.)
repost-content-media
  • Reward
  • Comment
  • Repost
  • Share
Gate CFD Stocks lists 10 new CFDs, with fixed 4x leverage.
See the full list below:
STRC (Strategy Variable Rate Series A Perpetual Stretch Preferred Stock),
TSEM (Tower Semiconductor Ltd.), AMKR (Amkor Technology, Inc.),
ASX (ASE Technology Holding Co., Ltd. ADR), MVLL (GraniteShares 2x Long MRVL Daily ETF), FLEX (Flex Ltd.),
MUU (Direxion Daily MU Bull 2X Shares),
CGNX (Cognex Corporation),
XLU (Utilities Select Sector SPDR Fund),
LITE (Lumentum Holdings Inc.)
#TradFiCFDGoldMasters
https://www.gate.com/cfd
MVLL-14.17%
  • Reward
  • Comment
  • Repost
  • Share
Gate has launched a learn-and-earn campaign to promote Espresso Systems' ESP token, with a total of 897,505 ESP to be distributed. The campaign will run for two weeks, from July 6th at 08:00 to July 20th at 08:00 UTC.
The participation process consists of three stages. First, users learn about Espresso by reading a designated article, then they complete a quiz. An important detail to note is that all questions must be answered correctly for the quiz to be successfully submitted; incorrect answers will result in the submission being unsuccessful. Each user can only submit the quiz once, so care
ESP3.43%
User_any
Gate has launched a learn-and-earn campaign to promote Espresso Systems' ESP token, with a total of 897,505 ESP to be distributed. The campaign will run for two weeks, from July 6th at 08:00 to July 20th at 08:00 UTC.
The participation process consists of three stages. First, users learn about Espresso by reading a designated article, then they complete a quiz. An important detail to note is that all questions must be answered correctly for the quiz to be successfully submitted; incorrect answers will result in the submission being unsuccessful. Each user can only submit the quiz once, so careful reading and correct answers are crucial.
The reward structure consists of two separate tiers. The first tier is a participation reward of 577,505 ESP, equally shared among all those who successfully complete the quiz. This amount is divided among the eligible users. The second tier is a draw, where 4,000 users are randomly selected from those who successfully complete the quiz and have traded at least $100 worth of ESP spot volume during the campaign period. Each winner receives an additional 80 ESP, creating a separate pool of 320,000 ESP. This second prize can be claimed separately from the first prize.
To participate, you must first click the "Participate" button on the campaign page and complete identity verification. This step must be done before the campaign ends. Trading volume calculations consider both buy and sell volume. Abuse attempts such as creating multiple accounts, malicious transactions, or coordinated transactions are strictly prohibited. Multiple accounts linked to the same verified identity will be counted as a single account; sub-accounts cannot participate in this campaign. Market makers, institutional, corporate, and affiliate accounts are also excluded.
For users wishing to participate in this campaign via Gate, the practical steps are as follows: first, carefully reading the article and answering the quiz correctly guarantees the first prize. Then, by performing a small ESP spot transaction during the campaign period, you can gain a chance to enter the second draw. Prizes are credited to accounts within fourteen business days after the campaign ends.
https://www.gate.com/campaigns/5409?ref=BVVEVQ9c&ref_type=132
https://www.gate.com/announcements/article/100519
repost-content-media
  • Reward
  • Comment
  • Repost
  • Share
Gate has launched a special live event campaign to share the excitement of the World Cup final with its users, the final taking place on July 19th and set to be the biggest night of the tournament.
Participation is limited to the first 300 people; those interested need to register early and complete the required tasks. This limited number of entries, determined by registration and task completion, offers a chance to win a World Cup Final Viewing Party Kit, which includes crayfish and beer – a classic match-watching feast.
The event is not only a chance to win a prize, but also combines the exp
User_any
Gate has launched a special live event campaign to share the excitement of the World Cup final with its users, the final taking place on July 19th and set to be the biggest night of the tournament.
Participation is limited to the first 300 people; those interested need to register early and complete the required tasks. This limited number of entries, determined by registration and task completion, offers a chance to win a World Cup Final Viewing Party Kit, which includes crayfish and beer – a classic match-watching feast.
The event is not only a chance to win a prize, but also combines the experience of watching the live stream and exploring the Prediction Market. Participants can both follow the match live and actively participate in the prediction market before and during the final. Winners will receive the viewing party kit as well as official Gate merchandise.
There is also a $5,000 Position Coupon prize pool, which will be distributed among participants. These types of coupons are usually a bonus added to your trading account and usable on specific trades, meaning participants get both an enjoyable viewing experience and a tangible trading advantage.
In these limited-capacity events, acting early is crucial, as registrations close once the initial 300-person limit is reached. For those wishing to participate in this event via Gate, the practical step is to go to the campaign page, register immediately, and complete the specified tasks without delay, as both the viewing party kit and coupon rewards will be shared among a limited number of participants. The final night promises to be the biggest moment of the tournament, where the champion will be crowned and this special event will take place.
https://www.gate.com/campaigns/5418
repost-content-media
  • Reward
  • Comment
  • Repost
  • Share
XRP's referral airdrop is back for another round, and this time the campaign runs from July 6 at 08:00 UTC through July 16 at 08:00 UTC, a ten day window.
The mechanics are straightforward and built around inviting friends into futures trading. Anyone who invites a friend who goes on to complete a futures trade earns 2 XRP right away, credited instantly rather than held until the campaign wraps up. The friend on the receiving end isn't left out either, new users who join through this route can unlock their own futures growth rewards, claiming up to 8 XRP once they complete the required steps.
XRP0.37%
User_any
XRP's referral airdrop is back for another round, and this time the campaign runs from July 6 at 08:00 UTC through July 16 at 08:00 UTC, a ten day window.
The mechanics are straightforward and built around inviting friends into futures trading. Anyone who invites a friend who goes on to complete a futures trade earns 2 XRP right away, credited instantly rather than held until the campaign wraps up. The friend on the receiving end isn't left out either, new users who join through this route can unlock their own futures growth rewards, claiming up to 8 XRP once they complete the required steps. It's a two sided setup where both the person doing the inviting and the person being invited walk away with something.
The total prize pool for this round is set at 20,000 XRP, and it's distributed on a first come, first served basis. That means the earlier someone gets their invites moving and their friends trading, the better their odds of actually claiming a share before the pool runs dry. For existing users, this is really a way to turn an existing social network into tangible rewards, and for newcomers just getting into futures trading, it offers a fairly low cost way to earn real tokens off a first trade.
Participation itself is simple on the surface, current users generate their own referral link or code, share it with friends, and once those friends register and complete the required futures trade, both sides receive their respective rewards. That said, it's worth being upfront about the risk involved here, futures trading carries leverage and price volatility, and the reward itself shouldn't be the main reason to open a position. Anyone new to futures should take the time to actually understand margin, liquidation, and position sizing before diving in, rather than treating this campaign as a shortcut into trading. It's also standard practice for platforms to flag and disqualify accounts involved in bulk registration or fake trading activity, so this campaign is no exception, those kinds of exploits typically void any earned rewards.
For anyone on Gate looking to take part, the practical move is to generate an invite code now, given the pool is capped and rewards are handed out in order of completion, and to make sure any friends being invited go in with realistic expectations about futures trading rather than chasing the XRP reward alone.
https://www.gate.com/campaigns/5410?ref=BVVEVQ9c&ref_type=132&utm_cmp=UpECttVw
Details 👉 https://www.gate.com/announcements/article/100520
repost-content-media
  • Reward
  • Comment
  • Repost
  • Share
$ETH
ETH $1,798.21: +14.15% Week From $1,512 Low. $1,807 Break Next, or Pullback to $1,779?
Quick Look
ETH is at $1,798.21, up 0.93% today. 24h range: $1,729.02 to $1,807.84. Flow hit 361.03K ETH / $636.82M. After tagging $1,512.11, ETH ran 19.5% to current levels. Trend is up, but short-term gauges are hot.
What The Chart Says: Bullish Structure Meets Overheat
1. 4h Trend Is Clean: MA5 $1,779.73, MA10 $1,777.02, MA30 $1,739.38 are stacked and rising. MA7 > MA30 > MA120 on the 4h confirms a bull setup. Price holds above all three. PDI > MDI with high ADX on 15m and 4h also shows buyers in c
ETH2.62%
BTC2.63%
SinCity
$ETH
ETH $1,798.21: +14.15% Week From $1,512 Low. $1,807 Break Next, or Pullback to $1,779?
Quick Look
ETH is at $1,798.21, up 0.93% today. 24h range: $1,729.02 to $1,807.84. Flow hit 361.03K ETH / $636.82M. After tagging $1,512.11, ETH ran 19.5% to current levels. Trend is up, but short-term gauges are hot.
What The Chart Says: Bullish Structure Meets Overheat
1. 4h Trend Is Clean: MA5 $1,779.73, MA10 $1,777.02, MA30 $1,739.38 are stacked and rising. MA7 > MA30 > MA120 on the 4h confirms a bull setup. Price holds above all three. PDI > MDI with high ADX on 15m and 4h also shows buyers in control. 2. Short-Term Too Hot: 4h and daily CCI + WR sit in the high zone. That means overbought. Price went from $1,729 to $1,807 in 24h and paused right at the wall. After 14.15% in 7 days, profit-taking risk rises. 3. Daily Gives A Contrarian Bull Case: Daily MACD and RSI show bullish splits. Price made a lower low at $1,512, but MACD and RSI made higher lows. That’s a bottom signal. It means the drop to $1,512 lost force, and the path of least push is up.
Flow And BTC Context
Flow expanded with price. $636.82M in 24h is solid and backs the move. Still, ETH underperformed BTC by 0.85% this week. If BTC keeps leading, ETH tends to lag then play catch-up once $1,800 breaks clean.
Key Levels
The gate is $1,807.84, the 24h high. Above it sits $1,849.41, then $1,883.13 and the June high near $1,950.
If Bulls Win: A 4h close over $1,808 opens $1,849 → $1,883 → $1,950. Break $1,883 and the move from $1,512 targets $2,000 round level.
If Bears Step In: Lose $1,798 and MA5 $1,779.73 is first hold. Below that, $1,777.02 MA10 and $1,781.94 zone line up. Break $1,739.38 MA30 and $1,729 24h low gets tested. That would be a 4% dip but still hold the 4h up trend.
MACD Detail
4h MACD is -3.97, but DIF 28.40 is about to cross DEA 32.37 from below. Histogram bars are shrinking on the downside. A cross up in the low zone often leads to a fast leg up. If it triggers, $1,849 comes quick.
Game Plan
Aggressive: $1,779 – $1,777 zone is ideal for bids. Stop under $1,770. Target $1,807, then $1,849.
Safe: Wait for a 1h close above $1,810 with rising flow. Then aim for $1,849 and $1,883.
Risk Off: If MA30 $1,739 breaks, step aside. Next solid buy zone is $1,729 to $1,680.
Bottom Line: ETH flipped trend from $1,512 and holds a clean 4h bull structure. Flow supports the move and daily splits point up. But CCI and WR are high on 4h/daily. Break $1,807 and $1,883 is open. Reject it, and $1,779 to $1,739 is the first dip zone.
Did you catch ETH at $1,512 or are you waiting for $1,810 to break? What’s your level? Drop it below.
$ETH ‌ #Ethereum #ETH #Crypto
  • Reward
  • Comment
  • Repost
  • Share
$CL Crude oil continued its consolidation trend at the start of the week, with WTI stuck around $68.60, briefly rising to $69.26 during the day before falling below $69 on Monday. This follows a weak attempt at a recovery that has continued since last Friday, but the strength of the recovery remains limited.
The situation in the Strait of Hormuz remains central to this pricing. According to the latest reports, some tankers were still making unusual route changes on Saturday, while major sea lanes reportedly returned to near-normal levels by Sunday. Saudi Arabia's crude oil exports have recover
CL0.71%
XTIUSD0.55%
XBRUSD0.80%
Yuewen
$CL Crude oil continued its consolidation trend at the start of the week, with WTI stuck around $68.60, briefly rising to $69.26 during the day before falling below $69 on Monday. This follows a weak attempt at a recovery that has continued since last Friday, but the strength of the recovery remains limited.
The situation in the Strait of Hormuz remains central to this pricing. According to the latest reports, some tankers were still making unusual route changes on Saturday, while major sea lanes reportedly returned to near-normal levels by Sunday. Saudi Arabia's crude oil exports have recovered to approximately ninety percent of pre-war levels, and the United Arab Emirates has similarly returned to pre-war export levels using the pipeline through the strait. Total daily flow through the strait has exceeded 10 million barrels.
However, supply-side pressure remains quite significant. OPEC+ has approved an additional production increase of 188,000 barrels per day for next month, primarily led by Saudi Arabia and Russia. Iran is also reportedly in talks to resume crude oil sales to Japanese companies under a temporary US sanctions waiver, which is reflected in expectations of additional supply to the market. Saudi Arabia also lowered its main crude oil price for Asia, discounting it to $1.50 per barrel compared to the Oman/Dubai reference, indicating that the supply surplus is also being felt on the pricing side.
However, geopolitical risk has not completely disappeared. Last week, the Iranian Revolutionary Guard warned tankers about unauthorized passage, and the dispute between Iran and the US over the long-term management of the strait and transit fees remains unresolved. Iran defines it as a maritime service fee, while the US argues that it is an international waterway and should not be charged. This unresolved dispute remains a real source of fragility underlying the current calm price environment.
The given resistance and support levels accurately reflect this balanced but tense environment. Short-term resistance starts at 68.90 and extends to 69.25, 69.95, 70.20, and 70.80, while support starts at 68.35 and extends to 68.00, 67.70, 67.40, and 67.00. The technical outlook remains weak at the moment; WTI is trading below its short-term moving averages, and the $70 level stands out as a critical ceiling. Some analysts suggest that if prices remain below this level, they could fall to $60, while a decisive breakout above $70 could reverse the outlook upwards.
For those following energy-related assets via the Gate, the key point to watch is that as long as transit through the strait continues to normalize, the geopolitical risk premium appears likely to continue eroding. However, it is still too early to assume this calm will be permanent until the transit fee dispute between Iran and the US is resolved. Any news of new friction could quickly break this narrow consolidation band upwards.
$XTIUSD $XBRUSD
DYOR 🔍
  • Reward
  • Comment
  • Repost
  • Share
$EURUSD The euro has gained short-term momentum against the dollar, currently trading between 1.1424 and 1.1442, following a 0.5% weekly gain last week after weak employment data.
The story behind this movement is that both sides are largely balancing each other out. On the dollar side, June's non-farm payrolls data came in at just 57,000, significantly below expectations, and the unemployment rate fell to 4.2%, but this is due to a decline in labor force participation. This data significantly reduced the likelihood of a July rate hike, and the dollar is trading near its lowest level in two we
EURUSD-0.06%
Yuewen
$EURUSD The euro has gained short-term momentum against the dollar, currently trading between 1.1424 and 1.1442, following a 0.5% weekly gain last week after weak employment data.
The story behind this movement is that both sides are largely balancing each other out. On the dollar side, June's non-farm payrolls data came in at just 57,000, significantly below expectations, and the unemployment rate fell to 4.2%, but this is due to a decline in labor force participation. This data significantly reduced the likelihood of a July rate hike, and the dollar is trading near its lowest level in two weeks. However, there is a similar softening on the euro side; June inflation fell to 2.8%, below expectations, and core inflation also dropped to 2.4%, leading European Central Bank President Christine Lagarde to present a more balanced outlook at the Sintra forum, making statements that weakened the possibility of a third rate hike.
So, while both central banks are signaling tightening on their side, signs of the limits of this tightening are emerging on both sides, which explains why the pair is stuck in a narrow range. The main determining event this week will be the release of the FOMC meeting minutes. If the minutes show that the Fed maintained its hawkish stance, the dollar could regain strength despite last week's weak employment data, increasing the likelihood of a continued downward trend in the pair. On the European Central Bank side, the next meeting is on July 23rd, and any official statements leading up to that date are also worth watching.
Looking at the given technical levels, a break above 1.1450 could bring 1.1462, 1.1472, and 1.1488 into play, which would be a scenario where the euro's short-term momentum continues. On the downside, a break below 1.1433 could open a series of declines to 1.1426, 1.1418, 1.1407, 1.1394, and 1.1378, signaling a resurgence of dollar strength. In a broader technical context, the 1.1400 level stands out as a critical reference point; a sustained drop below this level could mean the pair enters a much larger downtrend.
For those following dollar-linked assets and the crypto market through Gate, the key point to watch is whether this week's Fed minutes will reinforce the market's expectation of loose monetary policy following last week's weak employment data. This narrow range in the euro-dollar pair reflects a balance where both central banks are on a similar tightening trajectory, but the market is still unsure how long either can sustain it.
DYOR 🔍 NFA ✅
#TradFiCFDGoldMasters
  • Reward
  • Comment
  • 2
  • Share
🚨#XLMUSDT
XLM/USDT ANALYSIS | IS STELLAR QUIETLY PREPARING FOR ITS NEXT BIG MOVE? 📊🚀
The cryptocurrency market never moves in a straight line, and XLM/USDT is currently demonstrating why patience is one of the most valuable skills a trader can develop. While many market participants are focused on the recent decline and short-term bearish momentum, experienced investors understand that periods of weakness often create the foundation for the next major opportunity. The question isn't whether the market is moving—it's who is preparing while everyone else is reacting. 💡
📉 Looking at the 1-h
XLM-2.48%
2In1
🚨#XLMUSDT
XLM/USDT ANALYSIS | IS STELLAR QUIETLY PREPARING FOR ITS NEXT BIG MOVE? 📊🚀
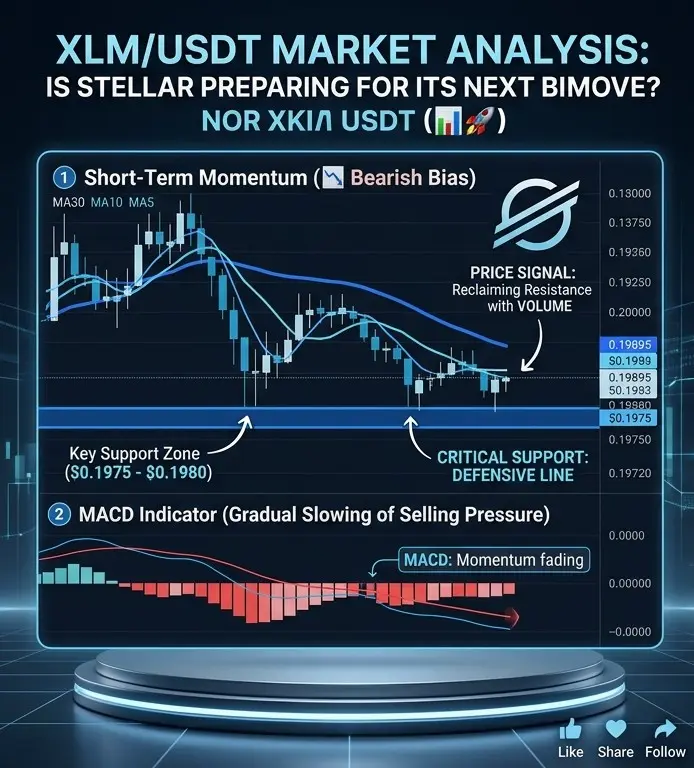
The cryptocurrency market never moves in a straight line, and XLM/USDT is currently demonstrating why patience is one of the most valuable skills a trader can develop. While many market participants are focused on the recent decline and short-term bearish momentum, experienced investors understand that periods of weakness often create the foundation for the next major opportunity. The question isn't whether the market is moving—it's who is preparing while everyone else is reacting. 💡
📉 Looking at the 1-hour timeframe, XLM is trading around $0.19895, remaining below the MA5, MA10, and MA30 moving averages. This clearly indicates that sellers are still controlling the short-term trend. Every attempt by buyers to push the price higher has been met with resistance, preventing the market from establishing a sustainable bullish structure. As long as the price remains below these moving averages, traders should remain cautious and avoid assuming that the correction has already ended.
📊 The MACD indicator also supports the current bearish outlook. Although bearish momentum remains dominant, the histogram suggests that selling pressure is gradually slowing compared to earlier sessions. This subtle change is worth monitoring because markets rarely reverse instantly. Instead, they usually move through a phase where sellers begin losing strength before buyers gradually regain control. Recognizing this transition early is what often separates disciplined traders from emotional ones.
🎯 One of the most critical areas on the chart is the support zone between $0.1975 and $0.1980. This level is currently acting as the market's defensive line. If buyers successfully defend this region, XLM could spend time building an accumulation range before attempting a recovery. However, if this support fails under strong selling pressure, the market may experience another wave of downside before finding stronger demand.
🚀 On the upside, the first challenge for the bulls will be reclaiming the $0.201–$0.203 resistance zone. A breakout above this area, especially with increasing trading volume, would signal that buyers are regaining confidence and could shift short-term momentum in their favor. Until such confirmation appears, traders should avoid chasing small green candles and instead focus on waiting for higher-probability setups.
💰 One lesson that every successful trader eventually learns is that capital preservation is more important than constant trading. Not every market condition offers a high-quality opportunity. Sometimes, the best decision is simply to stay patient, observe price action, and allow the market to reveal its direction before committing capital. Professional traders understand that protecting capital during uncertain conditions is just as important as making profits during trending markets.
🧠 Market psychology also plays a significant role during phases like this. When prices fall, fear spreads quickly, convincing many traders that the market will continue dropping forever. On the other hand, when prices rise sharply, greed convinces people to buy without a proper plan. Smart money avoids both emotions. Instead, it focuses on technical confirmation, trading volume, risk management, and disciplined execution.
✨ The biggest opportunities rarely appear when everyone is confident—they appear when uncertainty is at its highest. Whether XLM begins a recovery from current levels or experiences one final shakeout, traders who remain patient, disciplined, and focused on confirmed signals will always have a better chance of long-term success than those driven by emotions.
📌 Remember: Trading is not about predicting every move—it's about managing risk, waiting for confirmation, and consistently following a proven strategy. The market rewards discipline far more than excitement.
Follow for daily professional crypto analysis, educational market insights, and high-quality trading content that helps you trade smarter—not harder.
repost-content-media
  • Reward
  • 1
  • Repost
  • Share
ybaser:
Just go for it 👊
$SOL $GT $LAB
Conan the Trump-track Dogecoin detective, born on the Solana chain—🔥 ecosystem cooperation continues to advance, the community has been continuously built for more than a year, and market enthusiasm has surged. An explosive period is almost here. #ETH突破1700
#gStocks代币化股票上线
SOL2.71%
GT0.74%
LAB-19.88%
DOGE-0.74%
ETH2.62%
ConanDafe
$SOL $GT $LAB
Conan the Trump-track Dogecoin detective, born on the Solana chain—🔥 ecosystem cooperation continues to advance, the community has been continuously built for more than a year, and market enthusiasm has surged. An explosive period is almost here. #ETH突破1700
#gStocks代币化股票上线
repost-content-media
  • Reward
  • Comment
  • Repost
  • Share
$ONDO /USDT
ONDO continues to attract attention as Real World Asset projects remain a major focus across the crypto market. The recent recovery has improved the chart structure, but price is now approaching an important resistance level. My strategy is to wait for confirmation rather than predict the breakout. If buyers successfully reclaim resistance with healthy volume, I'll look toward the next target while managing risk with a stop loss below support. If the move fails, I'll remain patient and wait for another setup. Good trading isn't about being right every time—it's about managing risk
ONDO2.80%
Elara12
$ONDO /USDT
ONDO continues to attract attention as Real World Asset projects remain a major focus across the crypto market. The recent recovery has improved the chart structure, but price is now approaching an important resistance level. My strategy is to wait for confirmation rather than predict the breakout. If buyers successfully reclaim resistance with healthy volume, I'll look toward the next target while managing risk with a stop loss below support. If the move fails, I'll remain patient and wait for another setup. Good trading isn't about being right every time—it's about managing risk and letting profitable trades outweigh losing ones over the long run.
#gStocksTokenizedStocksLive #TradFiCFDGoldMasters #StakeUSD1Earn8.26%APR
  • Reward
  • Comment
  • Repost
  • Share
🚨💢💥 JUST IN: Nearly 1 Million Investors Lost $3.8B on Trump's $TRUMP Memecoin — NYT
A New York Times report, citing data from crypto analytics firm Nansen, lays out the stark math behind Trump's official memecoin: most people who bought it lost money, while a small group of insiders and sophisticated traders profited heavily.
The numbers:
📉 988,905 buyers (roughly two out of every three) are underwater, with combined losses of $3.81 billion through the end of June
📈 Meanwhile, about 500,000 wallets recorded combined profits of nearly $4 billion — concentrated among early buyers and algori
TRUMP2.32%
WLFI5.54%
BTC2.63%
TheBuzzingBee
🚨💢💥 JUST IN: Nearly 1 Million Investors Lost $3.8B on Trump's $TRUMP Memecoin — NYT
A New York Times report, citing data from crypto analytics firm Nansen, lays out the stark math behind Trump's official memecoin: most people who bought it lost money, while a small group of insiders and sophisticated traders profited heavily.
The numbers:
📉 988,905 buyers (roughly two out of every three) are underwater, with combined losses of $3.81 billion through the end of June
📈 Meanwhile, about 500,000 wallets recorded combined profits of nearly $4 billion — concentrated among early buyers and algorithmic traders
💥 The token has fallen ~97% from its all-time high of $75.35 down to $1.76
How Trump made money regardless: $TRUMP's structure meant Trump and affiliated entities earned revenue whenever tokens were traded — not just when the price went up. He reportedly promoted the coin heavily on Truth Social, launching it three days before his inauguration. His 2025 financial disclosure shows a $636 million payout from the coin, part of at least $2.2 billion in total earnings from his business ventures that year.
Wider fallout: The Times also flagged that most tracked holders of the Trump family's other crypto project, WLFI, are similarly in the red — about 85% of over 26,000 analyzed wallets. Legal experts quoted suggest post-presidency class-action risk isn't off the table, and Senator Elizabeth Warren has pushed to bar the president, VP, and officials from crypto earnings via the CLARITY Act.
$TRUMP ‌$BTC #gStocksTokenizedStocksLive
repost-content-media
  • Reward
  • Comment
  • Repost
  • Share
#gt $GT ‌ ‌GT $6.74: Coiled Spring Ready to Snap. $7.10 in Sight?
Quick Look
GT is holding $6.74 after a 24h range of $6.70 to $6.82. Down 0.74% today, but the chart is screaming for a move. Volume hit 23.94K GT while open interest jumped 11.36%. Big money is getting in position.
Why This Setup Matters
1. Bollinger Squeeze at Historic Lows: The 30-day band width is only 0.42. That’s as tight as it gets. The last three times GT squeezed this hard, it moved 15%+ within a week. Pressure is building. 2. MACD Tells a Different Story: Price tagged a new low near $6.33, but the daily MACD is risin
GT0.85%
Venüs_
#gt $GT ‌ ‌GT $6.74: Coiled Spring Ready to Snap. $7.10 in Sight?
Quick Look
GT is holding $6.74 after a 24h range of $6.70 to $6.82. Down 0.74% today, but the chart is screaming for a move. Volume hit 23.94K GT while open interest jumped 11.36%. Big money is getting in position.
Why This Setup Matters
1. Bollinger Squeeze at Historic Lows: The 30-day band width is only 0.42. That’s as tight as it gets. The last three times GT squeezed this hard, it moved 15%+ within a week. Pressure is building. 2. MACD Tells a Different Story: Price tagged a new low near $6.33, but the daily MACD is rising. Sellers are losing power. When price drops and momentum rises, reversals follow. 3. Leverage Pile-Up: Open interest up 11.36% on a down day. Traders are loading shorts and longs into a tight range. That’s kindling for a sharp move once one side gives up.
Key Levels to Watch
The line in the sand is $6.82. That’s the 24h high and the top of this coil.
If Bulls Win: A clean 4h close above $6.83 flips the switch. First stop $6.95. Clear that, and $7.11 to $7.18 opens up fast. Shorts from the $7.00 zone would rush to cover.
If Bears Win: Lose $6.70 and MA30 at $6.64 is next. Break that, and $6.48 then $6.33 come back into play. Below $6.33, the whole bounce structure breaks.
The Tape Right Now
On the 4h, MA5 and MA10 are both at $6.74, right on price. MA30 at $6.64 is acting as base support. Bulls have the mid-term edge. On the 15m, things look heavy with CCI and WR up high, so expect fake-outs before the real move.
Game Plan
Aggressive: Buy the $6.65-$6.70 zone. Stop under $6.60. Target $7.11.
Safe: Wait for a 4h candle to close above $6.83. Then look for $6.95 and $7.11.
Risk Off: If $6.64 fails, step aside. $6.33 would be the next buy area.
Bottom Line: GT is coiled tight, leverage is high, and momentum is shifting. $6.82 is the trigger. Whoever wins that level decides if GT sees $7.10 or $6.30 next.
What’s your play here — front-run the breakout or wait for confirmation? Drop your target below.
$GT #Crypto #GT #PriceMove
repost-content-media
  • Reward
  • Comment
  • 2
  • Share
The Russell 2000 forward price-to-earnings ratio, when considering all companies, has risen to approximately 33x, surpassing even the peak of the dot-com bubble in 2000. Excluding loss-making companies, the ratio remains around 16x, a level not seen in nearly thirty years.
The gap between these two figures is actually the most telling detail. It's widely known that approximately forty percent of the components of the small business index are currently not profitable, which is the main factor mathematically inflating the index's headline P/E ratio. Such a large segment of an index having negati
US20000.14%
US500-0.20%
User_any
The Russell 2000 forward price-to-earnings ratio, when considering all companies, has risen to approximately 33x, surpassing even the peak of the dot-com bubble in 2000. Excluding loss-making companies, the ratio remains around 16x, a level not seen in nearly thirty years.
The gap between these two figures is actually the most telling detail. It's widely known that approximately forty percent of the components of the small business index are currently not profitable, which is the main factor mathematically inflating the index's headline P/E ratio. Such a large segment of an index having negative or near-zero earnings can make the average ratio appear absurdly high, as the earnings side becomes almost irrelevant as a denominator. Even when you exclude loss-making companies and only look at profitable ones, reaching a level of 16x indicates a real strain on the pure valuation side as well; this isn't just a statistical distortion.
This picture is the result of a dramatic transformation in the small business sector over the past year. At the start of the year, the Russell 2000 was trading at a historic valuation discount compared to the S&P 500, with forward P/E ratios around 18 times, while the S&P 500 was over 24 times. This rotation, driven by the expectation that Fed interest rate cuts would ease the variable-rate debt burden on small businesses, gained momentum over time, and the index experienced several sharp upward periods during the year. However, much of this growth came from multiple expansions rather than profit growth—meaning prices increased much faster than earnings.
The risk side of this should not be ignored. A significant portion of small business debt is variable-rate, and many of these companies will have to refinance debt taken out during low-rate periods. With the possibility of interest rate hikes back on the table and the Fed adopting a hawkish stance, these highly valued but low-earnings companies are particularly vulnerable. Historically, such widespread valuation excesses, especially in parts not supported by earnings growth, tend to experience the sharpest corrections when the interest rate environment tightens.
This means that beneath the strong performance story of the small business index lie two different realities: a reasonable recovery of genuinely profitable companies with solid balance sheets, and the simultaneous overvaluation of underperforming companies inflated by speculative interest and low interest rate expectations. For those following both the stock and crypto markets through Gate, the crucial point is that as long as this divergence continues, every new signal regarding the Fed's interest rate path will continue to produce much sharper reactions in the small business index compared to large stock indices, because this segment's debt structure and earnings quality represent a much more fragile version of the average.
#gStocksTokenizedStocksLive
#ShareYourUSStocks #IntroducingGateStocks #USStocks
$US2000
repost-content-media
  • Reward
  • Comment
  • 4
  • Share
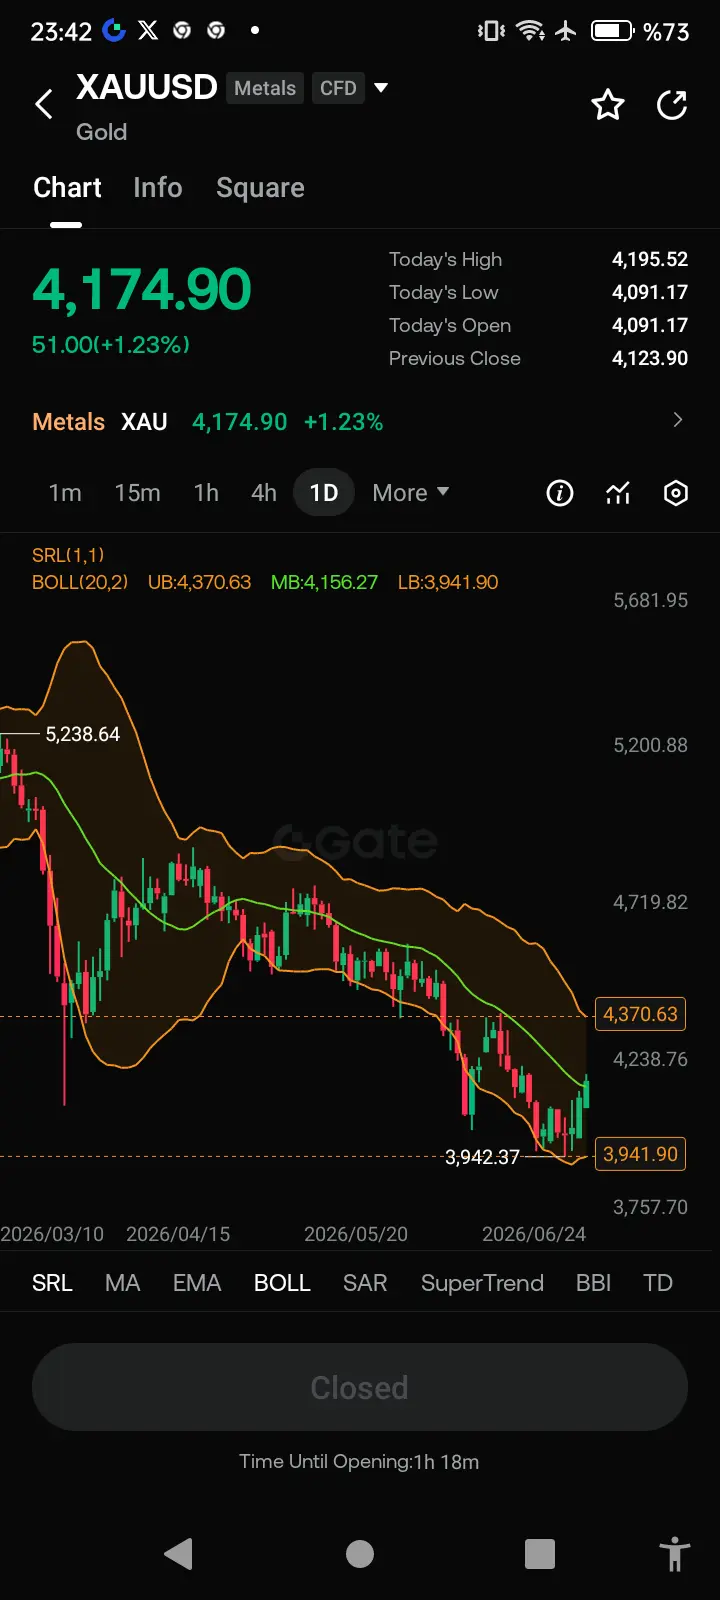
$XAUT Gold appears to be stuck within a broadly defined range for the coming week, and these weekly technical levels largely coincide with XAUT's current movement.
Short-term resistance starts in the 4,190-4,200 range; if broken above, the 4,220 and 4,280 levels come into play. For a medium-term trend reversal, 4,400 stands out as a real threshold. On the support side, 4,140-4,150 are marked as a short-term defense zone, 4,100 and 4,050 are medium-term support, and 3,900 is identified as an extremely strong base on a weekly basis. The breadth of these levels actually shows how volatile a rang
XAUT0.07%
User_any
$XAUT Gold appears to be stuck within a broadly defined range for the coming week, and these weekly technical levels largely coincide with XAUT's current movement.
Short-term resistance starts in the 4,190-4,200 range; if broken above, the 4,220 and 4,280 levels come into play. For a medium-term trend reversal, 4,400 stands out as a real threshold. On the support side, 4,140-4,150 are marked as a short-term defense zone, 4,100 and 4,050 are medium-term support, and 3,900 is identified as an extremely strong base on a weekly basis. The breadth of these levels actually shows how volatile a range gold is currently stuck in, and JPMorgan's recent downward revision of its year-end target from $6,000 to $4,500 is also an indication that this uncertainty is being felt on the institutional side.
Looking at XAUT, it moved within an extremely narrow range between 4,157.5 and 4,169.6 in the last 24 hours, remaining almost flat with practically a 0.1% change. However, beneath this calm appearance lies a serious contradiction among the technical indicators. The 15-minute chart shows a bullish alignment, with the MA7 above the MA30, which in turn is above the MA120. But the daily chart says the opposite; the MA7 is below the MA30, which in turn is below the MA120, indicating a clear downtrend. While the PDI crossing the MDI on the 4-hour chart suggests a short-term uptrend, the WR indicator is in the overbought region at -16.88, meaning this short-term rise is also running out of steam.
The most striking detail is probably the KDJ's J value, which is in the extremely overbought region at 110.43 and showing a blunt trajectory. Furthermore, the fact that volume increased to approximately four times the 7-day average while the price was falling indicates a classic panic selling pattern, meaning both technical indicators and volume are simultaneously signaling downward pressure. The attempt at recovery on the 4-hour chart is being suppressed by bearish divergence signals on both the daily and 4-hour charts, suggesting that a short-term bounce attempt is trapped within a larger downtrend.
Combining this with the weekly support and resistance levels, the downside risk appears to outweigh the downside risk in the short term. Whether the 4,140-4,150 band will hold is the most critical question in the coming days; if this area is broken, 4,100 and then 4,050 could quickly come into play. For those following XAUT via Gate, the main point to watch is whether this panic selling signal on the volume side will continue, because the current technical picture shows that the daily downtrend remains dominant rather than a recovery.
#TradFiCFDGoldMasters
DYOR 🔍 NFA ✅
repost-content-media
  • Reward
  • Comment
  • 3
  • Share
$BTC So where are we with Bitcoin?
Price is hovering around 62,500, down slightly on the day. The daily trend is still bearish, MA7 below MA30 below MA120, plain as day. But the daily MACD is showing a bullish divergence, price made a lower low, but the MACD made a higher low. That is usually a sign that selling pressure is exhausting. The 4 hour chart is also bullish, with the PDI above the MDI, so short term momentum is actually pointing up. But then you have the ETF flows, which have been a nightmare. Over 6 billion dollars left in the last 30 days. That is not a trickle, that is a flood.
GT0.74%
DYOR-22.52%
User_any
$BTC So where are we with Bitcoin?
Price is hovering around 62,500, down slightly on the day. The daily trend is still bearish, MA7 below MA30 below MA120, plain as day. But the daily MACD is showing a bullish divergence, price made a lower low, but the MACD made a higher low. That is usually a sign that selling pressure is exhausting. The 4 hour chart is also bullish, with the PDI above the MDI, so short term momentum is actually pointing up. But then you have the ETF flows, which have been a nightmare. Over 6 billion dollars left in the last 30 days. That is not a trickle, that is a flood.
The real tension here is between the technicians who see the divergence and say the bottom is near, and the flow analysts who say the only thing that matters is that capital is leaving. And honestly, the flow guys have a point. Price follows money, not oscillators. If institutions keep selling, no divergence in the world is going to save the price.
The Fear and Greed Index is at 21, which is Extreme Fear. Historically, that has been a good contrarian buy signal. But the analyst makes a really good point here. Historical patterns break. The ETF structure is new. Institutional selling at this scale is new. The old rules may not apply. And if 60,000 is the level everyone is watching, that means stops are lined up right below it. A break below could trigger a cascade down to 57,700 pretty quickly.
The emotional read is spot on. Divergence hunters are feeling excited, almost certain they found the bottom. But that certainty is dangerous because the environment is not clean. The signals are too conflicted for high conviction.
So what is the play? If you are already long from the 58,000 bounce, take some profits and move your stop to breakeven. Let the rest run if the 4 hour trend stays intact, but do not get greedy. If you are flat, do not chase. Wait for either a break above 64,000 with volume and two consecutive days of positive ETF flows for a bullish entry, or a break below 60,000 to short with a stop above 61,500. If you are already short, hold with a stop above 64,500. The daily trend is on your side.
The one question that really matters is whether this is just a bear market rally inside a downtrend or the start of a real reversal. And the answer is not on the chart. It is in the ETF flows. When inflows return for three straight days, the regime changes. Until then, assume this is a bounce. Confidence is medium. The signals are just too conflicted for anything else. Size your risk accordingly.
$BTC $GT $ETH
DYOR 🔍
repost-content-media
  • Reward
  • Comment
  • 1
  • Share
  • Pinned