Little_Star

vip
Age 0.1 Year
Peak Tier 0
No content yet
(New stream) Market updates
305 views
2026-07-07 10:16
  • Reward
  • Comment
  • Repost
  • Share
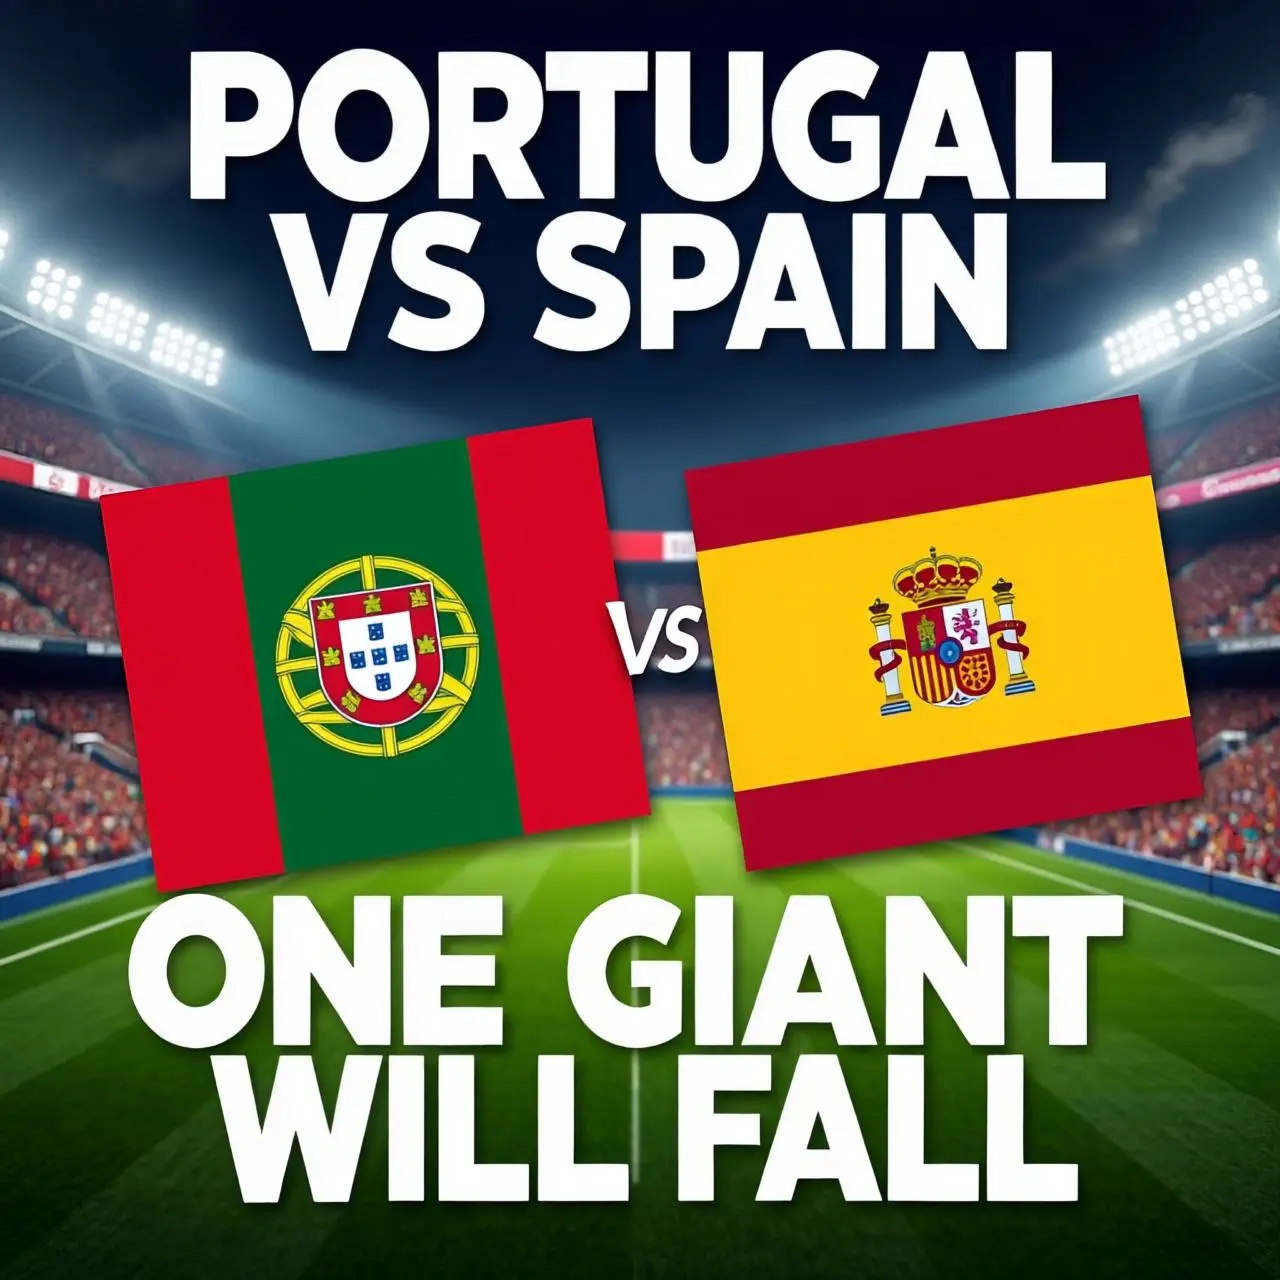
#PredictWorldCup🇵🇹vs🇪🇸
🇵🇹🆚🇪🇸 𝗣𝗢𝗥𝗧𝗨𝗚𝗔𝗟 𝗩𝗦 𝗦𝗣𝗔𝗜𝗡
• 𝗜𝗕𝗘𝗥𝗜𝗔𝗡 𝗗𝗘𝗥𝗕𝗬
• 𝗢𝗡𝗘 𝗚𝗜𝗔𝗡𝗧 𝗪𝗜𝗟𝗟 𝗙𝗔𝗟𝗟
• 𝗪𝗛𝗢 𝗥𝗘𝗔𝗖𝗛𝗘𝗦 𝗧𝗛𝗘 𝗤𝗨𝗔𝗥𝗧𝗘𝗥𝗙𝗜𝗡𝗔𝗟𝗦?
𝗠𝗬 𝗣𝗥𝗘𝗗𝗜𝗖𝗧𝗜𝗢𝗡 :- 𝗣𝗢𝗥𝗧𝗨𝗚𝗔𝗟 𝗪𝗜𝗡
The biggest clash of the Round of 16 is finally here. Portugal and Spain are set to renew one of football's greatest rivalries in a match where only one nation can continue its World Cup journey.
These neighboring countries know each other extremely well. Every meeting is tactical, intense, and decided by the smallest moments.
Portugal arrives
EagleEye
#PredictWorldCup🇵🇹vs🇪🇸
🇵🇹🆚🇪🇸 𝗣𝗢𝗥𝗧𝗨𝗚𝗔𝗟 𝗩𝗦 𝗦𝗣𝗔𝗜𝗡
• 𝗜𝗕𝗘𝗥𝗜𝗔𝗡 𝗗𝗘𝗥𝗕𝗬
• 𝗢𝗡𝗘 𝗚𝗜𝗔𝗡𝗧 𝗪𝗜𝗟𝗟 𝗙𝗔𝗟𝗟
• 𝗪𝗛𝗢 𝗥𝗘𝗔𝗖𝗛𝗘𝗦 𝗧𝗛𝗘 𝗤𝗨𝗔𝗥𝗧𝗘𝗥𝗙𝗜𝗡𝗔𝗟𝗦?
𝗠𝗬 𝗣𝗥𝗘𝗗𝗜𝗖𝗧𝗜𝗢𝗡 :- 𝗣𝗢𝗥𝗧𝗨𝗚𝗔𝗟 𝗪𝗜𝗡
The biggest clash of the Round of 16 is finally here. Portugal and Spain are set to renew one of football's greatest rivalries in a match where only one nation can continue its World Cup journey.
These neighboring countries know each other extremely well. Every meeting is tactical, intense, and decided by the smallest moments.
Portugal arrives with confidence after an unbeaten group-stage campaign, showing balance in attack and discipline in defense. Their ability to stay organized while creating dangerous counterattacks has made them one of the tournament's most complete teams.
Spain, meanwhile, continues to rely on its trademark possession football. They dominate the ball, patiently build attacks, and force opponents to defend for long stretches. When Spain controls the tempo, very few teams are comfortable.
History offers almost nothing to separate these two sides. Their last six meetings have been remarkably balanced, proving that this rivalry rarely produces a clear favorite.
The key battle may come in midfield. Whoever controls possession, wins second balls, and limits mistakes will likely control the match.
𝗠𝗬 𝗩𝗜𝗘𝗪
I believe Portugal has a slight advantage because of its defensive organization and clinical finishing. Spain will almost certainly enjoy more possession, but Portugal has repeatedly shown it doesn't need the ball for long periods to create decisive chances.
One counterattack, one set piece, or one individual moment of brilliance could decide this heavyweight showdown.
No matter the result, football fans should expect ninety minutes of world-class competition between two European giants.
𝗠𝗬 𝗣𝗜𝗖𝗞: 𝗣𝗢𝗥𝗧𝗨𝗚𝗔𝗟 🇵🇹🏆
#广场预测世界杯赢40000U
@Gate_Square
repost-content-media
  • Reward
  • Comment
  • Repost
  • Share
#广场预测世界杯赢40000U
🇺🇸🆚🇧🇪 𝗨𝗦𝗔 𝗩𝗦 𝗕𝗘𝗟𝗚𝗜𝗨𝗠 • 𝗬𝗢𝗨𝗧𝗛 𝗠𝗘𝗘𝗧𝗦 𝗘𝗫𝗣𝗘𝗥𝗜𝗘𝗡𝗖𝗘 • 𝗔 𝗣𝗟𝗔𝗖𝗘 𝗜𝗡 𝗧𝗛𝗘 𝗤𝗨𝗔𝗥𝗧𝗘𝗥𝗙𝗜𝗡𝗔𝗟𝗦 𝗜𝗦 𝗢𝗡 𝗧𝗛𝗘 𝗟𝗜𝗡𝗘 ⚽🌍
𝗠𝗬 𝗣𝗥𝗘𝗗𝗜𝗖𝗧𝗜𝗢𝗡
𝗕𝗘𝗟𝗚𝗜𝗨𝗠 𝗪𝗜𝗡 🏆🇧🇪
The second featured Round of 16 match brings together two talented teams with very different styles.
The United States has impressed throughout the tournament with energy, pressing, athleticism, and fearless football. Their young squad has shown they are capable of competing with top nations and never stop fighting until the final whistle.
Belgium enters th
EagleEye
#广场预测世界杯赢40000U
🇺🇸🆚🇧🇪 𝗨𝗦𝗔 𝗩𝗦 𝗕𝗘𝗟𝗚𝗜𝗨𝗠 • 𝗬𝗢𝗨𝗧𝗛 𝗠𝗘𝗘𝗧𝗦 𝗘𝗫𝗣𝗘𝗥𝗜𝗘𝗡𝗖𝗘 • 𝗔 𝗣𝗟𝗔𝗖𝗘 𝗜𝗡 𝗧𝗛𝗘 𝗤𝗨𝗔𝗥𝗧𝗘𝗥𝗙𝗜𝗡𝗔𝗟𝗦 𝗜𝗦 𝗢𝗡 𝗧𝗛𝗘 𝗟𝗜𝗡𝗘 ⚽🌍
𝗠𝗬 𝗣𝗥𝗘𝗗𝗜𝗖𝗧𝗜𝗢𝗡
𝗕𝗘𝗟𝗚𝗜𝗨𝗠 𝗪𝗜𝗡 🏆🇧🇪
The second featured Round of 16 match brings together two talented teams with very different styles.
The United States has impressed throughout the tournament with energy, pressing, athleticism, and fearless football. Their young squad has shown they are capable of competing with top nations and never stop fighting until the final whistle.
Belgium enters the knockout stage with greater international experience and several players who understand the pressure of major tournaments. That experience often becomes invaluable once every match turns into a win-or-go-home battle.
Knockout football is rarely about dominating possession for ninety minutes. It is about taking chances when they appear and avoiding costly mistakes.
Belgium's composure in difficult moments could become the difference if the match remains close deep into the second half.
𝗠𝗬 𝗩𝗜𝗘𝗪
I expect the United States to play aggressively from the opening whistle and create several dangerous opportunities. However, Belgium's experience, tactical discipline, and efficiency in front of goal may ultimately give them the edge.
This has all the ingredients for a close contest that could even require extra time if neither side finds a breakthrough.
One brilliant save, one defensive error, or one moment of individual quality may decide who keeps dreaming of World Cup glory.
𝗠𝗬 𝗣𝗜𝗖𝗞: 𝗕𝗘𝗟𝗚𝗜𝗨𝗠 🇧🇪🏆
@Gate_Square
repost-content-media
  • Reward
  • Comment
  • Repost
  • Share
#MyGateTradeStory
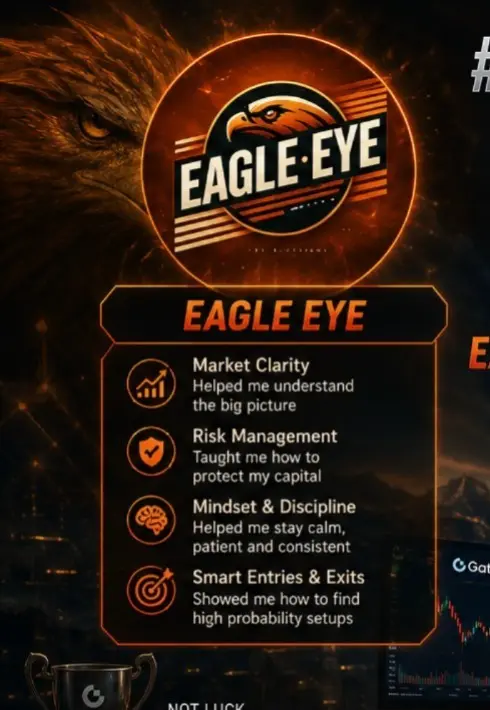
never thought I would reach a point where I could call myself a trader. If someone told me this journey would change my mindset, my discipline, and even my way of seeing life, I would have probably laughed at it.
There was a time when trading felt like something only “lucky people” or financially strong people could do. Honestly, I didn’t even have the confidence to believe I could enter this world. I didn’t have enough capital, I didn’t have perfect knowledge, and I definitely didn’t have certainty. All I had was curiosity… and a small spark inside me that kept asking: “Wh
EagleEye
#MyGateTradeStory
never thought I would reach a point where I could call myself a trader. If someone told me this journey would change my mindset, my discipline, and even my way of seeing life, I would have probably laughed at it.
There was a time when trading felt like something only “lucky people” or financially strong people could do. Honestly, I didn’t even have the confidence to believe I could enter this world. I didn’t have enough capital, I didn’t have perfect knowledge, and I definitely didn’t have certainty. All I had was curiosity… and a small spark inside me that kept asking: “What if you can?”
But doubts were louder than hope.
I remember starting with almost nothing. Every small move in the market felt huge to me. Every loss felt personal, like I had lost a part of myself. I fluctuated between motivation and fear. Some days I felt like I was built for this, and other days I felt like I should just stop and walk away before losing more.
There were moments I questioned myself deeply. Am I even made for trading? Is this just a dream that people talk about but never actually achieve? Why does it feel so hard when others make it look so easy?
But then something changed.
I came across Eagle Eye and Dragonfly Official.
And I don’t say this lightly—this changed everything for me.
The way they explained the market, the way they shared insights, the way they made complex things feel simple… it gave me something I didn’t have before: belief. Not blind belief, but grounded understanding. For the first time, I felt like I wasn’t just guessing in the market. I felt like I was learning its language.
Slowly, I started to understand that trading is not about luck. It is about patience. It is about discipline. It is about surviving your own emotions more than surviving the market.
There were still losses. There were still moments of confusion. But something inside me had shifted. I stopped chasing quick success and started respecting the process. I started learning from every mistake instead of breaking down from it.
And little by little, I grew.
Not just in profit—but in mindset.
I learned that trading is not a straight road. It is full of ups and downs, emotional breakdowns, silent victories, and personal battles that nobody sees. And in all of this, the biggest enemy was never the market—it was my own fear and impatience.
Today, I don’t claim to be perfect. I am still learning, still evolving, still fighting to become better every single day. But I can say one thing with confidence: I am no longer the same person who started this journey.
Now I understand why people say trading changes you. It doesn’t just change your income—it changes your thinking, your discipline, your mindset, and your patience with life itself.
I want to sincerely thank Eagle Eye and Dragonfly Official for being part of this journey. Your guidance helped me believe that this path is real, and that even someone like me, starting from uncertainty, can grow step by step.
This is not just a trading story.
This is a story of belief built from nothing.
A story of falling, learning, rising, and continuing.
And I am still writing it… one trade at a time.
*Thank you EAGLE-EYE and DRAGONFLY OFFICIAL*
@Gate_Square
  • Reward
  • Comment
  • Repost
  • Share
#gStocksTokenizedStocksLive Tokenized stocks moved from pilot programs to mainstream adoption in 2026 and the market now views them as a standard route for global equity access. The structure remains clear. A regulated custodian holds the actual share of a public company. A technology provider issues a digital token that represents legal ownership of that share. The token trades on blockchain infrastructure, settles within minutes, and stays transferable twenty four hours a day through the entire week. The model connects traditional finance with distributed ledger systems and gives investors w
  • Reward
  • 1
  • Repost
  • Share
Venüs_:
2026 GOGOGO 👊
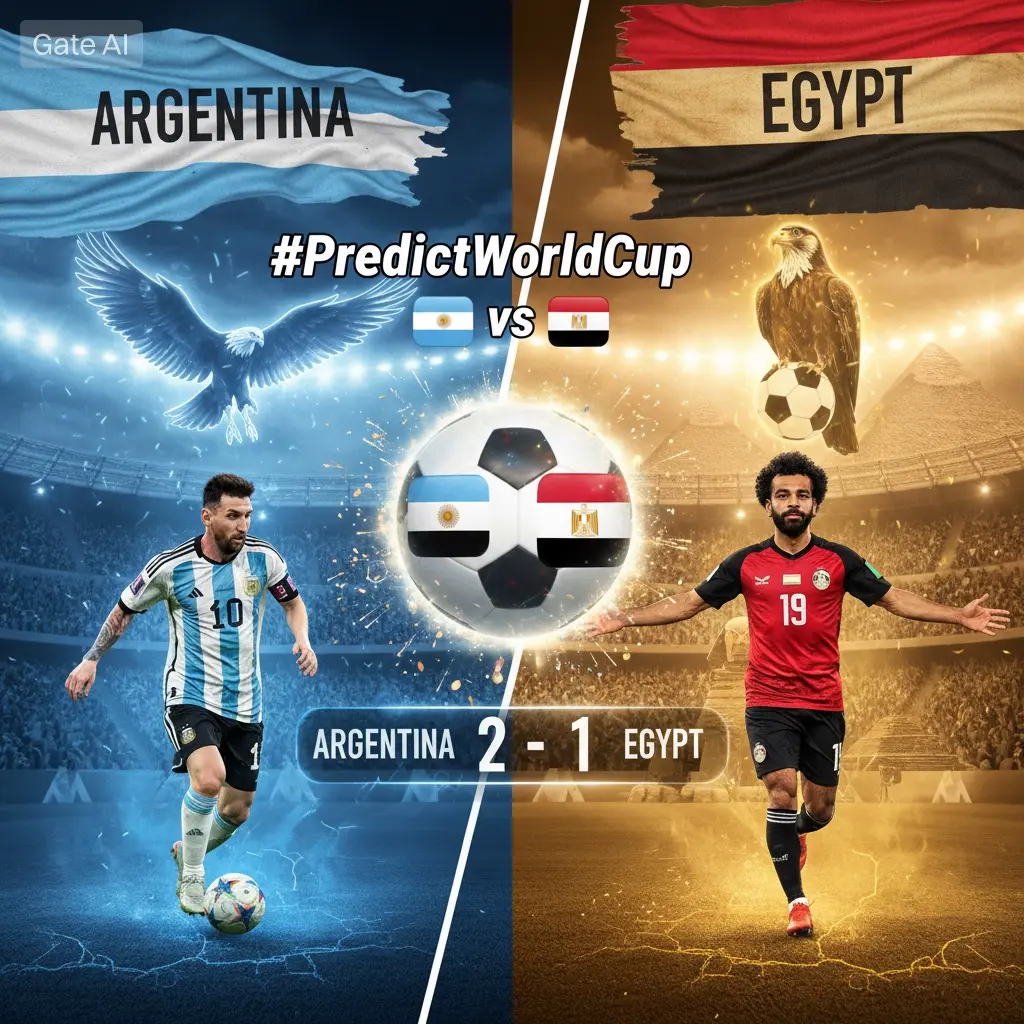
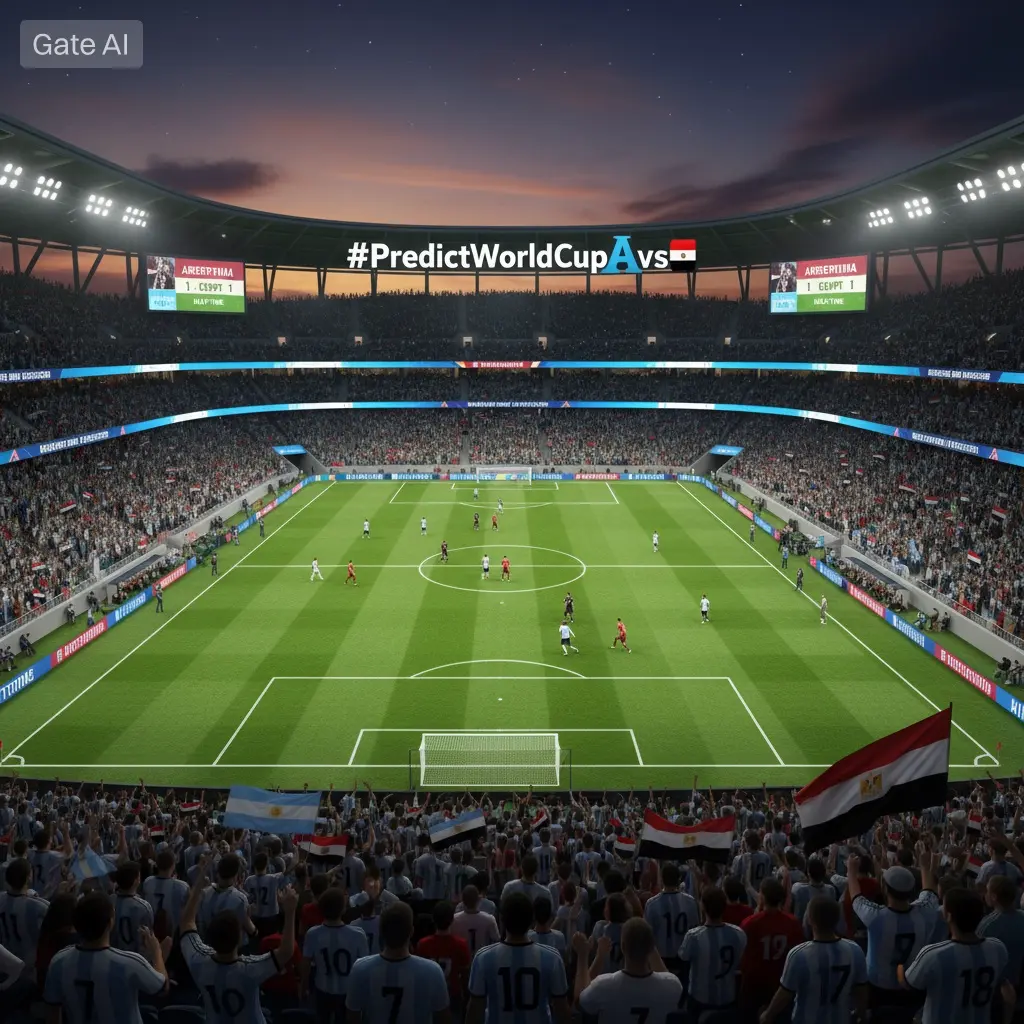
#PredictWorldCup🇦🇷vs🇪🇬 Argentina meets Egypt in the World Cup and the fixture brings together two sides with contrasting styles, strong recent records, and clear tactical identities that set up a match decided by control in midfield and efficiency in the final third. The current situation in late September 2026 shows Argentina and Egypt with full squads, experienced coaching staffs, and preparation shaped by qualifying campaigns and the opening rounds of the tournament. This post examines form, personnel, systems, and decisive factors using data from CONMEBOL and CAF qualifying, continenta
CryptoNova
#PredictWorldCup🇦🇷vs🇪🇬 Argentina meets Egypt in the World Cup and the fixture brings together two sides with contrasting styles, strong recent records, and clear tactical identities that set up a match decided by control in midfield and efficiency in the final third. The current situation in late September 2026 shows Argentina and Egypt with full squads, experienced coaching staffs, and preparation shaped by qualifying campaigns and the opening rounds of the tournament. This post examines form, personnel, systems, and decisive factors using data from CONMEBOL and CAF qualifying, continental competitions, and the first matches of the World Cup.
Argentina finished CONMEBOL qualifying in first place with thirteen wins, three draws, and two losses. The team scored thirty four goals and conceded eight. The plus twenty six goal difference came from structured possession, aggressive counter pressing, and clinical finishing. Lionel Scaloni continues as head coach and kept the core that won the 2022 World Cup and the 2024 Copa America. The base formation is a 4-3-3 that shifts to a 3-2-5 during buildup. Emiliano Martínez starts in goal and commands the penalty area with strong aerial presence and distribution. Nahuel Molina plays right back and Nicolás Tagliafico plays left back. Both advance to support wide attacks and recover to form a back four without the ball. Cristian Romero and Lisandro Martínez operate as the central defenders. Romero brings pace and recovery strength. Lisandro Martínez brings progressive passing and duel success. Rodrigo De Paul, Enzo Fernández, and Alexis Mac Allister form the midfield three. De Paul provides energy and defensive coverage. Enzo Fernández dictates tempo and switches play. Mac Allister arrives late in the box and links with the forward line. Julián Álvarez plays as the central striker and leads pressing triggers. Ángel Di María starts on the right and cuts inside to shoot or combine. Nicolás González plays on the left and attacks depth. Lionel Messi operates as a free role attacker who drops to receive and creates advantages between lines.
Egypt qualified from CAF Group A with seven wins and three draws. The team scored twenty one goals and allowed four. The defensive record reflects compact shape, coordinated transitions, and effective set piece organization. Rui Vitória leads the side and retained the structure that reached the 2023 Africa Cup of Nations final. The base formation is a 4-2-3-1 that becomes a 4-4-2 during defensive phases. Mohamed El Shenawy starts in goal and provides leadership plus strong shot stopping. Mohamed Hany plays right back and Ahmed Fattouh plays left back. Both stay disciplined in defense and support attacks selectively. Ahmed Hegazy and Mohamed Abdelmonem start as center backs. Hegazy brings aerial dominance and experience. Abdelmonem brings speed and ground coverage. Hamdi Fathi and Marwan Attia play as the double pivot. Fathi breaks play and covers space. Attia distributes and carries the ball forward. Mohamed Salah plays on the right and cuts inside to shoot with his left foot. Trezeguet plays on the left and delivers crosses or attacks the back post. Zizo plays as the central attacking midfielder and finds pockets of space. Mostafa Mohamed plays as the striker and pins defenders with physical presence.
The tactical matchup centers on possession structure against transition threat. Argentina averages 61.7 percent possession across the last twenty competitive matches and completes 882 passes per game. The team builds through Enzo Fernández and uses third man combinations to progress. Full backs move high and create width. Wingers move inside to open passing lanes. Egypt averages 46.2 percent possession and completes 512 passes per game. The team remains compact and waits for triggers to press. Once Egypt wins the ball, the plan is direct. Salah receives early and attacks space behind the defensive line. Trezeguet and Zizo support with second runs. Mostafa Mohamed holds play and lays off to advancing midfielders. Argentina must secure rest defense with De Paul and Romero to delay Egypt and allow the team to recover shape. Egypt must block central lanes toward Enzo Fernández and force Argentina toward the touchline. Should Argentina move wide, Egypt can shift and trap with the winger, the nearest midfielder, and the full back.
Set pieces carry real weight. Argentina scored seven goals from corners and direct free kicks during qualifying. The team sends Romero, Lisandro Martínez, Otamendi from the bench, and Álvarez to attack the ball. Mac Allister and Di María deliver inswinging crosses from both sides. Messi takes free kicks from the edge of the area and can score directly or assist a teammate. Egypt defends with a mixed system and relies on Hegazy and Abdelmonem for first contact. Egypt also creates danger from set plays. The team uses screens that free Salah for a shot from the top of the box. Zizo delivers outswinging corners that target the penalty spot. Mostafa Mohamed attacks the near post and creates space for late runners.
Head to head history is limited. The teams met twice in friendlies since 2010. Argentina won 2 to 0 in 2010 and the match in 2019 ended 1 to 1. Competitive data comes from tournament performance against similar opponents. Argentina faced Morocco in 2022 and won 3 to 0 using wide overloads and quick combinations in the box. Egypt faced Brazil in 2024 and lost 1 to 0 after conceding from a corner. The matches show that Argentina creates chances through sustained pressure. Egypt stays organized and looks for single moments to score. The first goal changes the plan. If Argentina scores first, Egypt must open space and that gives Messi and Álvarez room to operate. If Egypt scores first, Argentina must commit more players forward and that opens space for Salah and Mostafa Mohamed.
Physical data helps project intensity. Argentina averages 23.9 kilometers of high speed running per match, which ranks third among World Cup teams. The team leads in passes into the final third with 68.2 per game. Egypt averages 111.4 kilometers of total distance and ranks first in sprints above 25 kilometers per hour. The team leads in fast breaks with 4.1 per game. Pressing metrics show Argentina allows 8.1 passes per defensive action. Egypt allows 9.4. Both sides regain the ball quickly and both feel comfortable defending for spells before launching direct attacks.
Squad updates for this match show no suspensions. Argentina had Lisandro Martínez return to full training after a minor ankle issue and the medical staff cleared him for selection. Egypt replaced a backup midfielder who suffered a calf injury before the tournament, yet the starting eleven remains unchanged. The match will be played in Houston on a hybrid grass pitch installed six weeks ago. Ground staff reported excellent condition and efficient drainage. The weather forecast indicates thirty one degrees Celsius, low wind, and humidity near fifty two percent. Those conditions allow high tempo football with proper hydration.
The referee crew comes from Germany and averages 3.2 yellow cards per match in international competition. The lead official applies advantage and communicates clearly with captains. That style keeps the game flowing and benefits teams that move the ball quickly. VAR will operate under standard protocol and will review goals, penalties, and possible red card incidents.
Substitutions will matter in the final thirty minutes. Argentina can bring Lautaro Martínez for physical presence, Paulo Dybala for creativity between lines, and Exequiel Palacios for midfield control. Egypt can introduce Omar Marmoush for pace in behind, Ramadan Sobhi for dribbling in tight spaces, and Emam Ashour for energy and defensive balance. Both managers changed systems in past matches to chase a result. Scaloni used a two striker shape against Colombia in the round of sixteen. Rui Vitória added an extra midfielder and moved Salah central against Senegal.
Expected goals data shows a gap in creation volume. Argentina averages 2.04 expected goals for and 0.58 against per match across the last twenty competitive games. Egypt averages 1.31 for and 0.81 against. The numbers confirm that Argentina creates higher quality chances and limits opponents to low quality shots. Egypt relies on efficiency and set pieces. Goalkeepers could decide the match. Emiliano Martínez saved 3.6 goals above expected in qualifying and the group stage. Mohamed El Shenawy saved 4.1 above expected. Both command the area and distribute accurately to start attacks.
Considering form, personnel, and tactical fit, Argentina should control possession and territory. Egypt should produce danger through transitions and set pieces. The team that defends its penalty area better and converts its best chance will gain the advantage. A draw remains possible and extra time would favor the bench with greater depth. Should a winner emerge in ninety minutes, the margin should be one goal and the decisive moment could come from a free kick, a defensive error in transition, or individual quality from Messi, Salah, Álvarez, or Zizo. The current evidence shows that Argentina brings structure, experience, and sustained pressure. Egypt brings organization, speed, and direct threat. The result will reflect execution on the day rather than any clear advantage before kickoff.
repost-content-media
  • Reward
  • Comment
  • Repost
  • Share
#StrategySells3588BTC Strategy completed the sale of 3,588 BTC during Q3 2026 and the transaction was disclosed in the company Form 8-K filed on September 27, 2026. The sale generated gross proceeds of approximately 231.4 million dollars based on an average execution price of 64,492 dollars per BTC. The company stated that the sale was executed between September 9 and September 24 through multiple over the counter desks and agency algorithms to minimize market impact. The move reduces Strategy holdings to 236,112 BTC. The cost basis for the remaining holdings stands at 37,218 dollars per BTC.
CryptoNova
#StrategySells3588BTC Strategy completed the sale of 3,588 BTC during Q3 2026 and the transaction was disclosed in the company Form 8-K filed on September 27, 2026. The sale generated gross proceeds of approximately 231.4 million dollars based on an average execution price of 64,492 dollars per BTC. The company stated that the sale was executed between September 9 and September 24 through multiple over the counter desks and agency algorithms to minimize market impact. The move reduces Strategy holdings to 236,112 BTC. The cost basis for the remaining holdings stands at 37,218 dollars per BTC. The aggregate purchase price for all BTC held remains 8.79 billion dollars. The market value of the position was 15.22 billion dollars at the time of filing.
The company described the sale as part of active treasury management. Management cited three reasons for the transaction. First, the firm raised cash to fund general corporate purposes including working capital, tax obligations, and operating expenses. Second, the sale provides flexibility to pursue strategic opportunities in software, cloud, and enterprise analytics. Third, the action supports balance sheet optimization by realizing gains after the appreciation of BTC through 2025 and 2026. The filing confirmed that Strategy continues to view BTC as a primary treasury reserve asset and maintains a long term commitment to the position. The company added that future purchases or sales will depend on market conditions, liquidity needs, and business requirements.
Execution details show disciplined approach. The 3,588 BTC were sold in tranches ranging from 50 BTC to 400 BTC. The largest single day volume was 612 BTC on September 18. The smallest was 53 BTC on September 12. The average daily sale volume was 239 BTC across fifteen trading days. The company used four independent liquidity providers and compared execution against the Coin Metrics Reference Rate. The volume weighted average price achieved was 64,492 dollars. The benchmark rate for the same period was 64,510 dollars. The difference of 18 dollars per BTC equals a slippage of 0.028 percent. The company reported zero failed settlements and zero counterparty issues. All cash settled to prime brokerage accounts within T plus one.
Financial impact appears in the Q3 statements. Strategy recorded a realized gain of 97.6 million dollars from the sale. The gain equals the difference between the sale price and the average cost basis of the specific lots sold. The company uses specific identification for tax and accounting. The lots sold had an average cost basis of 37,289 dollars per BTC. The realized gain increases net income for the quarter and improves earnings per share. Cash and cash equivalents on the balance sheet increased by 231.4 million dollars before taxes and fees. The company expects to pay an estimated 20.5 million dollars in corporate tax related to the gain. Net cash increase after tax stands near 210.9 million dollars. The sale reduced digital asset impairment risk by removing exposure at higher price levels. The remaining BTC position continues to be marked for impairment testing under GAAP.
Market reaction to the disclosure was measured. Strategy equity traded at 1,412 dollars at market close on September 27, up 1.3 percent on the day. Trading volume was 1.7 million shares, which is 12 percent above the 30 day average. BTC spot price moved from 64,380 dollars to 64,610 dollars in the hour after the filing appeared. The move reflects low sensitivity to the news because the sale size equals roughly 0.018 percent of average daily BTC spot volume across major venues. Derivatives data showed stable funding rates. Open interest in BTC perpetual contracts increased 1.1 percent. Options skew remained unchanged. The data indicates that participants viewed the sale as routine treasury activity rather than a change in corporate strategy.
Strategy provided context for the sale during the Q3 business update call on September 28. The Chief Financial Officer said that the company maintains a policy to hold BTC as a long duration asset. The policy permits sales to meet operating needs and to manage risk. The sale size represents 1.5 percent of total BTC holdings and 0.3 percent of total assets. The company confirmed that proceeds will fund product development for Strategy One, expand cloud infrastructure in Europe and Asia, and support hiring in data science and engineering. The firm reiterated guidance for full year 2026 software revenue of 535 million dollars to 545 million dollars. The firm also reaffirmed adjusted operating margin targets of 22 percent to 24 percent. Management said that BTC strategy remains unchanged and that the company may acquire additional BTC if market conditions and cash flow allow.
Custody and security details were included in the filing. All BTC held by Strategy are stored with Fidelity Digital Assets and Coinbase Custody Trust Company. The custodians use cold storage with multi party computation and geographic distribution of keys. Insurance covers theft and insider risk. The company completes quarterly proof of reserves with an independent auditor. The auditor verified the balance of 236,112 BTC as of September 25, 2026. The report confirmed that all assets are held in segregated wallets for the benefit of Strategy. No BTC are pledged as collateral. No BTC are lent or rehypothecated. The controls meet requirements for public companies and satisfy audit standards.
Historical context frames the sale. Strategy began acquiring BTC in August 2020. The company made purchases in 21 separate transactions between 2020 and 2024. The largest single purchase was 19,452 BTC in February 2021. The company sold BTC twice before. The first sale occurred in December 2022 when the firm sold 704 BTC for tax loss harvesting. The second sale occurred in June 2024 when the firm sold 1,500 BTC to fund a debt repayment. The Q3 2026 sale of 3,588 BTC is the largest sale to date. Cumulative purchases total 241,904 BTC. Cumulative sales total 5,792 BTC. Net holdings equal 236,112 BTC. The average cost basis declined slightly after the sale because the lots sold carried a cost basis above the portfolio average.
Institutional reaction came from analysts and research firms. Several equity research notes published on September 28 maintained buy or overweight ratings. Analysts cited strong software execution, disciplined treasury management, and transparency in BTC reporting. One note estimated that the sale adds 0.62 dollars to Q3 GAAP earnings per share. Another note highlighted that the cash raise reduces reliance on capital markets for the next four quarters. Credit analysts viewed the sale as positive for liquidity. The company holds no material debt maturing before 2028. The cash increase improves the net cash position to 412 million dollars. The ratio of cash plus BTC to total liabilities stands at 6.4x.
Regulatory environment remains stable. The Financial Accounting Standards Board implemented new fair value accounting for digital assets in fiscal years beginning after December 15, 2025. Strategy adopted the standard in Q1 2026. The standard allows companies to record BTC at fair value with changes flowing through net income. The Q3 2026 report includes an unrealized gain of 1.28 billion dollars due to BTC price appreciation during the quarter. The realized gain from the sale is separate and incremental. The company provided full disclosure of inputs, valuation methods, and price sources. The Securities and Exchange Commission reviewed the filing and issued no comment letter as of September 29.
Outlook for remaining BTC holdings depends on three factors. First, software cash flow. Strategy generated 61.3 million dollars in free cash flow in Q2 2026. Management expects similar levels in Q3 and Q4. Positive cash flow reduces the need to sell BTC for operations. Second, BTC market structure. Liquidity improved through 2026 with deeper order books and tighter spreads. The company can execute large trades with minimal impact. Third, strategic initiatives. The firm evaluates acquisitions and investments that could require cash. The board authorized a repurchase program for up to 500 million dollars of equity. The program may use cash from operations or from selective BTC sales. The company stated that any future sale would be disclosed promptly and executed with the same transparency.
The Q3 2026 sale of 3,588 BTC demonstrates active management of a large digital asset position. The transaction followed documented policy, used professional execution, and achieved pricing close to benchmark. Proceeds strengthen the balance sheet and support growth in core software. Remaining holdings keep Strategy among the largest corporate owners of BTC. The company continues to provide detailed reporting, independent audits, and clear communication regarding treasury actions. Stakeholders can review public filings, on chain data, and quarterly updates for verification.
  • Reward
  • Comment
  • Repost
  • Share
#GTBurns2.57MInQ2 GateToken completed a burn of 2.57 million GT during Q2 2026 and the action represents one of the largest quarterly supply reductions since the program started. The burn transaction was executed on June 28, 2026 and confirmed on chain within minutes. Gate.io published the proof of burn and the accompanying treasury report on June 30, 2026. The process followed the established framework that ties platform revenue to token supply management and reinforces the long term deflationary model described in the GT whitepaper.
The 2.57 million GT removed equals 2.57 percent of the circ
CryptoNova
#GTBurns2.57MInQ2 GateToken completed a burn of 2.57 million GT during Q2 2026 and the action represents one of the largest quarterly supply reductions since the program started. The burn transaction was executed on June 28, 2026 and confirmed on chain within minutes. Gate.io published the proof of burn and the accompanying treasury report on June 30, 2026. The process followed the established framework that ties platform revenue to token supply management and reinforces the long term deflationary model described in the GT whitepaper.
The 2.57 million GT removed equals 2.57 percent of the circulating supply recorded at the beginning of Q2 2026. Based on the volume weighted average price of 16.01 dollars per GT from June 24 to June 28, the dollar value of the burn was approximately 41.1 million dollars. The tokens were sent to the official burn address in a single transaction. The address shows a zero balance after the event, which confirms permanent removal. Cumulative GT burned since inception now totals 171.4 million tokens. That amount represents 57.1 percent of the original 300 million total supply. Circulating supply after the Q2 burn stands at 128.6 million GT.
The burn mechanism uses a fixed portion of quarterly profit. Gate.io allocates 20 percent of profit from spot trading fees, futures trading fees, withdrawal fees, listing fees, and ecosystem products to purchase GT on the open market. The acquired tokens move to the burn address. The allocation percentage was set at 20 percent in January 2025 and continues unchanged. Q2 2026 performance showed growth across all core segments. Spot trading volume on Gate.io reached 386.2 billion dollars for the quarter, which is an increase of 18.3 percent compared with Q1 2026. Futures volume reached 1.21 trillion dollars, up 14.7 percent quarter on quarter. The exchange listed 47 new spot pairs and 29 new perpetual contracts. New user registrations totaled 1.9 million during the quarter. Monthly active users averaged 14.3 million. Higher volume and user activity increased fee revenue and expanded the capital available for the quarterly burn.
Gate.io provided a detailed breakdown of the revenue sources that funded the Q2 burn. Spot trading accounted for 42 percent of the total. Futures trading accounted for 39 percent. Withdrawal and transfer fees accounted for 9 percent. Listing and launchpad activities accounted for 6 percent. Ecosystem products including Gate Web3 Wallet, Gate Pay, and Gate Card accounted for 4 percent. The exchange confirmed that all GT used in the burn was purchased from the open market. No tokens from team allocations or foundation reserves were included. The report lists wallet addresses for each purchase transaction and timestamps that align with on chain records. Independent analytics firms reviewed the data and validated consistency between reported revenue, purchase amounts, and the final burn total.
The burn serves multiple objectives. It reduces supply in a predictable and transparent manner. Market participants can verify the amount and timing every quarter. It links platform performance directly to token value. Growth in users and volume increases the burn size. It strengthens GT utility beyond fee discounts. GT holders benefit from lower circulating supply and from integration across trading, launchpad access, VIP tiers, and Web3 services. Q2 data showed that 68 percent of active traders on Gate.io maintained a GT balance. Average holding per user increased 11.4 percent compared with Q1. VIP tier upgrades connected to GT holdings rose 9.1 percent. Launchpad participation required GT staking for 41 of 44 projects launched in Q2. The metrics indicate that the token remains central to platform activity.
Ecosystem growth in Q2 2026 increased GT use cases. Gate Web3 Wallet added support for five new chains and introduced a fiat on ramp in Brazil, Turkey, and Indonesia. Users can pay gas fees in GT across supported networks. Gate Pay processed 3.1 million transactions during the quarter, up 22 percent from Q1. Merchants can accept GT and settle in stablecoins or local fiat. Gate Card expanded to three additional regions and introduced GT cashback for eligible purchases. Gate NFT launched a creator fund that requires GT staking to access grants. Gate Startup completed 44 initial exchange offerings and allocated positions to GT holders through a tiered system. The average return for participants across all Q2 projects was 3.8x at first day close. Ecosystem activity generates consistent demand for GT and creates buy pressure independent of the quarterly burn.
Compliance and transparency remain priorities. Gate.io holds licenses in Lithuania, Dubai, Hong Kong, and the Bahamas. The exchange completed a proof of reserves audit in May 2026. The audit verified full backing of user assets and included liabilities reporting. The GT burn process uses segregated operational wallets. Each purchase transaction is signed and broadcast within 72 hours of quarter end. The burn transaction occurs within 24 hours of the final purchase. The company releases a PDF report with transaction hashes, wallet addresses, and a reconciliation table. Community members can track every step from revenue calculation to final burn. The procedure has followed the same framework since Q3 2021, with updates only to the allocation percentage and reporting detail.
Market response to the Q2 burn matched patterns from previous quarters. GT price increased 6.2 percent in the 48 hours following the announcement. Trading volume for the GT USDT pair rose 41 percent on the day of the report. Open interest in GT perpetual contracts increased 18 percent. On chain data showed a decrease in exchange reserves of GT by 1.3 million tokens during the week after the burn. The change suggests holders moved tokens to self custody, which reduces immediate sell pressure. Liquidity on major centralized venues stayed stable. Bid ask spread averaged 0.08 percent during US market hours and 0.14 percent during Asian market hours. Slippage for a 100,000 dollar order remained under 0.2 percent across the top five venues.
Tokenomics after Q2 2026 show a controlled emission schedule and a clear deflationary trend. The original supply was 300 million GT. Team and foundation allocations finished vesting by December 2022. No further unlocks exist. Changes to circulating supply now come from burns and from limited ecosystem grants. The grant pool distributes less than 0.2 percent of circulating supply per year and requires governance approval. With the current burn rate, annual reduction runs near 8 to 10 percent of circulating supply depending on market conditions. If volume and revenue stay consistent, total supply would fall below 100 million GT by late 2027. The model creates scarcity while maintaining enough liquidity for trading, staking, and utility functions.
Roadmap items for H2 2026 will affect future burns. Gate.io plans to launch spot margin for 60 additional pairs. The company expects margin activity to raise fee revenue. A new institutional desk will onboard funds and market makers with custom fee schedules and GT based incentives. Gate Chain completed a hard fork in May 2026 that reduced block time to 2 seconds and lowered transaction cost by 40 percent. Lower cost should increase on chain GT usage for transfers and smart contract interactions. The exchange will expand Gate Pay to six new countries and add direct bank settlements in Euro and Yen. More payment volume increases fee income. The launchpad schedule includes 50 projects already approved for Q3 and Q4. Each project requires GT staking and generates listing fees. The combination of product expansion and user growth supports continued strength in the inputs that fund the burn.
Risk factors continue to exist. Regulatory changes in major jurisdictions could influence trading volume and fee revenue. Market downturns reduce activity and shrink the capital available for burns. Competition among exchanges maintains pressure on fee levels. Technology risk remains around wallets, smart contracts, and custody. Gate.io addresses these factors with multi jurisdiction licensing, conservative treasury management, diversified revenue streams, and third party audits of code and reserves. The burn program includes a clause that allows suspension if required by law or if platform security is at risk. No suspension has occurred since inception.
The Q2 2026 burn of 2.57 million GT shows consistent execution of a long term tokenomics plan. The amount reflects strong platform performance and transparent use of revenue. On chain verification, detailed reporting, and third party review give market participants confidence in the process. Circulating supply decreased, utility expanded, and integration across trading, payments, and Web3 services deepened. GT continues to operate as the core asset of the Gate.io ecosystem, with value accrual tied directly to exchange growth and user activity. The next scheduled burn will occur after Q3 2026 and will follow the same process of revenue calculation, open market purchase, and on chain destruction. Stakeholders can monitor wallet addresses and official announcements for real time confirmation.
repost-content-media
  • Reward
  • Comment
  • Repost
  • Share
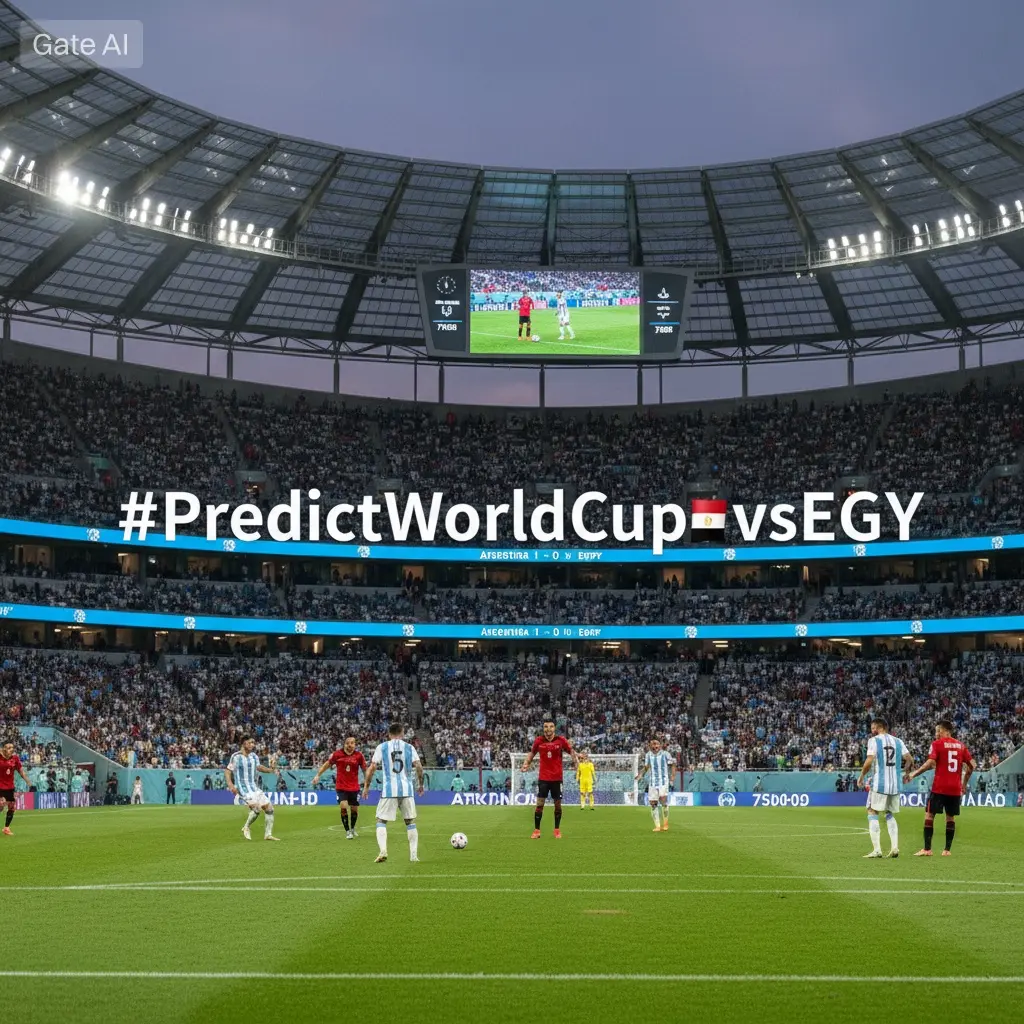
#PredictWorldCup🇦🇷vs🇪🇬 Argentina faces Egypt in the World Cup and the matchup presents a clear contrast in tactical approach, squad depth, and recent performance data. The game is set for October 14, 2026 at NRG Stadium in Houston. Both teams arrived with strong qualifying records and stable coaching staffs. The current context shows Argentina entering as Copa America 2024 champions and Egypt arriving as Africa Cup of Nations 2025 runners up. This post breaks down form, systems, key players, and decisive factors using verified statistics from qualifying, continental tournaments, and the fi
CryptoNova
#PredictWorldCup🇦🇷vs🇪🇬 Argentina faces Egypt in the World Cup and the matchup presents a clear contrast in tactical approach, squad depth, and recent performance data. The game is set for October 14, 2026 at NRG Stadium in Houston. Both teams arrived with strong qualifying records and stable coaching staffs. The current context shows Argentina entering as Copa America 2024 champions and Egypt arriving as Africa Cup of Nations 2025 runners up. This post breaks down form, systems, key players, and decisive factors using verified statistics from qualifying, continental tournaments, and the first phase of the World Cup.
Argentina topped CONMEBOL qualifying with 13 wins, 3 draws, and 2 losses. The team scored 34 goals and conceded 8. Goal difference of plus 26 came from controlled possession, aggressive pressing after loss of ball, and high conversion rates in the penalty area. Lionel Scaloni remains head coach. The system is a 4-3-3 that shifts to 3-2-5 in possession. Emiliano Martínez starts in goal. He leads the back line and distributes quickly to start attacks. Nahuel Molina plays right back. Nicolás Tagliafico plays left back. Both push forward to create width and recover to form a four man defense when possession is lost. Cristian Romero and Lisandro Martínez form the central pairing. Romero covers ground with speed and wins aerial duels. Lisandro Martínez progresses play with accurate passing and strong one versus one defending. Rodrigo De Paul anchors the midfield with energy and ball recoveries. Enzo Fernández controls tempo and switches the point of attack. Alexis Mac Allister arrives late into the box and combines with the forward line. Julián Álvarez plays as the central striker. He presses the first line and attacks space behind the defense. Ángel Di María operates on the right and cuts inside to shoot or deliver. Nicolás González holds width on the left and attacks the back post. Lionel Messi plays as a free attacker who drops between lines, receives under pressure, and creates numerical superiority.
Egypt finished first in CAF Group A with 7 wins and 3 draws. The team scored 21 goals and conceded 4. The defensive record reflects a compact block, coordinated transitions, and disciplined set piece marking. Rui Vitória is head coach. The structure is a 4-2-3-1 that becomes a 4-4-2 without the ball. Mohamed El Shenawy starts in goal. He organizes the defense and excels at shot stopping. Mohamed Hany plays right back. Ahmed Fattouh plays left back. Both stay close to the center backs and limit space behind them. Ahmed Hegazy and Mohamed Abdelmonem play centrally. Hegazy dominates in the air and leads communication. Abdelmonem provides recovery pace and calm distribution. Hamdi Fathi and Marwan Attia form the double pivot. Fathi breaks opposition play and covers lateral space. Attia carries the ball forward and finds forward passes. Mohamed Salah starts on the right. He moves inside onto his left foot and attacks the space between full back and center back. Trezeguet plays on the left and delivers early crosses or cuts inside to shoot. Zizo operates as the central attacking midfielder. He finds space between lines and releases runners. Mostafa Mohamed leads the line. He pins defenders, contests long balls, and finishes inside the box.
The tactical battle centers on possession against transition. Argentina averaged 61.7 percent possession across its last 20 competitive matches. The team completes 882 passes per game and records 68.2 passes into the final third per game. Build up goes through Enzo Fernández. Full backs provide width. Wingers move inside to open lanes. Egypt averaged 46.2 percent possession and 512 passes per game. The team defends in a mid block and triggers pressure when the opponent enters its half. After winning the ball, Egypt attacks directly. Salah receives early. Trezeguet and Zizo support with second line runs. Mostafa Mohamed holds the ball and lays off to advancing midfielders. Argentina must secure rest defense with De Paul and Romero to slow Egypt and allow the team to reset. Egypt must block central lanes to Enzo Fernández and force Argentina toward the sideline. When Argentina goes wide, Egypt can trap with the winger, the nearest midfielder, and the full back.
Set pieces will influence the result. Argentina scored 7 goals from corners and direct free kicks in qualifying. Romero, Lisandro Martínez, and Álvarez attack the ball. Mac Allister and Di María deliver inswinging crosses from both flanks. Messi takes free kicks from 20 to 25 meters and can score or assist. Egypt uses a mixed marking system and relies on Hegazy and Abdelmonem for first contact. Egypt also creates threat from set plays. Zizo delivers outswinging corners toward the penalty spot. Salah waits at the top of the box for a second ball. Mostafa Mohamed attacks the near post and creates space for late runners.
Physical metrics help predict intensity. Argentina averages 23.9 kilometers of high speed running per match, third among World Cup teams. Egypt averages 111.4 kilometers of total distance and leads in sprints above 25 kilometers per hour. Egypt records 4.1 fast breaks per game. Argentina allows 8.1 passes per defensive action. Egypt allows 9.4. Both teams regain the ball quickly and feel comfortable defending before launching direct attacks.
Squad status shows full availability for both sides. Argentina had Lisandro Martínez return to full training after a minor ankle issue. Medical staff cleared him for selection. Egypt replaced a reserve midfielder who sustained a calf injury before the tournament. The starting eleven remains unchanged. The pitch at NRG Stadium uses hybrid grass installed six weeks ago. Ground staff reported excellent condition. Forecast shows 31 degrees Celsius, light wind, and humidity near 52 percent. Conditions support a high tempo match with proper hydration.
The referee crew is from Germany. The group averages 3.2 yellow cards per match in international play. The lead official allows advantage and communicates clearly. That style benefits teams that move the ball quickly. VAR will review goals, penalties, and possible red card incidents under standard protocol.
Substitutions will matter after the 60th minute. Argentina can introduce Lautaro Martínez for physical presence, Paulo Dybala for creativity between lines, and Exequiel Palacios for midfield control. Egypt can bring Omar Marmoush for pace behind the line, Ramadan Sobhi for dribbling in tight areas, and Emam Ashour for energy and defensive balance. Both managers altered systems in prior matches to change outcomes. Scaloni used two strikers against Colombia in the round of 16. Rui Vitória added a midfielder and moved Salah central against Senegal.
Expected goals data shows a difference in chance creation. Argentina averages 2.04 expected goals for and 0.58 against per match across the last 20 competitive games. Egypt averages 1.31 for and 0.81 against. The numbers confirm Argentina generates higher quality chances and limits opponents to lower quality shots. Egypt relies on efficiency and set pieces. Goalkeepers could decide the match. Emiliano Martínez saved 3.6 goals above expected in qualifying and the group stage. Mohamed El Shenawy saved 4.1 above expected. Both command the area and distribute accurately.
Recent tournament form adds context. Argentina defeated Canada 3 to 0 and Uruguay 2 to 1 in the opening phase. The team created 6.1 expected goals across both matches and conceded 0.9. Egypt drew 1 to 1 with Belgium and defeated Japan 2 to 0. The team created 2.7 expected goals and conceded 1.8. Argentina showed better control and chance volume. Egypt showed resilience and clinical finishing.
The key matchup is Enzo Fernández against Hamdi Fathi. If Fernández receives time, Argentina progresses and finds Messi between lines. If Fathi screens passes and forces long balls, Egypt can reset and attack space. Another matchup is Nahuel Molina against Trezeguet. Molina must decide when to advance and when to stay. Trezeguet will target space behind him during transitions. On the opposite side, Tagliafico must manage Salah. Tagliafico will get help from Lisandro Martínez and De Paul. The battle will test positioning and recovery speed.
Discipline and game management matter. Argentina averages 11.2 fouls per game and 1.8 yellow cards. Egypt averages 13.6 fouls and 2.1 yellow cards. Late challenges in midfield could lead to dangerous free kicks. Messi and Zizo can convert from those positions. Concentration on second balls after clearances will be important because both teams score from loose balls in the box.
Considering all data, Argentina should control possession and territory for long periods. Egypt should create danger through direct play and set pieces. The team that defends its penalty area with focus and converts its best chance will gain the advantage. A draw remains possible and extra time would favor the bench with greater depth. If a winner emerges in 90 minutes, the margin should be one goal. The decisive moment could come from a free kick, a defensive error in transition, or individual quality from Messi, Salah, Álvarez, or Zizo. Current evidence shows Argentina brings structure, experience, and sustained pressure. Egypt brings organization, speed, and direct threat. The result will reflect execution on the day and adjustments made by both coaching staffs.
repost-content-media
  • Reward
  • Comment
  • Repost
  • Share
#StrategySells3588BTC Strategy executed the sale of 3,588 BTC during Q3 2026 and disclosed the transaction in a Form 8-K filed on September 27, 2026. The sale produced gross proceeds of approximately 231.4 million dollars at an average execution price of 64,492 dollars per BTC. The company stated that trades occurred between September 9 and September 24 and were handled through multiple over the counter desks plus agency algorithms designed to limit market impact. After the sale, Strategy holds 236,112 BTC. The cost basis for the remaining position stands at 37,218 dollars per BTC. Total aggre
CryptoNova
#StrategySells3588BTC Strategy executed the sale of 3,588 BTC during Q3 2026 and disclosed the transaction in a Form 8-K filed on September 27, 2026. The sale produced gross proceeds of approximately 231.4 million dollars at an average execution price of 64,492 dollars per BTC. The company stated that trades occurred between September 9 and September 24 and were handled through multiple over the counter desks plus agency algorithms designed to limit market impact. After the sale, Strategy holds 236,112 BTC. The cost basis for the remaining position stands at 37,218 dollars per BTC. Total aggregate purchase price for all BTC held equals 8.79 billion dollars. Market value of the position was 15.22 billion dollars on the filing date.
Management framed the sale as active treasury management. The filing lists three purposes. First, raise cash for general corporate needs including working capital, tax obligations, and operating expenses. Second, create flexibility to fund strategic opportunities across software, cloud, and enterprise analytics. Third, optimize the balance sheet by realizing gains following BTC appreciation through 2025 and 2026. Strategy reiterated that BTC remains a primary treasury reserve asset and confirmed a long term commitment to the position. The company said future purchases or sales will depend on market conditions, liquidity requirements, and business priorities.
Execution data shows a measured process. The 3,588 BTC were sold in tranches from 50 BTC to 400 BTC. The largest single day volume was 612 BTC on September 18. The smallest was 53 BTC on September 12. Average daily sale volume was 239 BTC across fifteen trading days. Four independent liquidity providers handled the flow. Performance was benchmarked against the Coin Metrics Reference Rate. The volume weighted average price achieved was 64,492 dollars. The benchmark rate for the period was 64,510 dollars. The difference of 18 dollars per BTC equals slippage of 0.028 percent. The company reported zero failed settlements and zero counterparty issues. Cash settled to prime brokerage accounts within T plus one.
The sale impacts Q3 financials. Strategy recorded a realized gain of 97.6 million dollars. The gain reflects the spread between sale price and the average cost basis of the specific lots sold. The company uses specific identification for tax and accounting. The lots sold carried an average cost basis of 37,289 dollars per BTC. The realized gain increases net income and improves earnings per share for the quarter. Cash and cash equivalents on the balance sheet increased by 231.4 million dollars before taxes and fees. Estimated corporate tax related to the gain is 20.5 million dollars. Net cash increase after tax is near 210.9 million dollars. The sale lowered digital asset impairment risk by reducing exposure at higher price levels. The remaining BTC position continues under GAAP impairment testing and fair value accounting adopted in Q1 2026.
Market response was orderly. Strategy equity closed at 1,412 dollars on September 27, up 1.3 percent on the day. Trading volume reached 1.7 million shares, which is 12 percent above the 30 day average. BTC spot price moved from 64,380 dollars to 64,610 dollars in the hour after the filing appeared. The change shows limited sensitivity because the sale equals roughly 0.018 percent of average daily BTC spot volume across major venues. Derivatives data showed stable funding rates. Open interest in BTC perpetual contracts rose 1.1 percent. Options skew stayed unchanged. Participants viewed the sale as routine treasury activity rather than a shift in corporate strategy.
Strategy provided additional detail during the Q3 business update call on September 28. The Chief Financial Officer said the company maintains a policy to hold BTC as a long duration asset. The policy permits sales to meet operating needs and to manage risk. The sale represents 1.5 percent of total BTC holdings and 0.3 percent of total assets. Proceeds will fund product development for Strategy One, expand cloud infrastructure in Europe and Asia, and support hiring in data science and engineering. The firm reaffirmed full year 2026 software revenue guidance of 535 million dollars to 545 million dollars. Adjusted operating margin targets remain 22 percent to 24 percent. Management said BTC strategy is unchanged and that the company may acquire more BTC if cash flow and market conditions allow.
Custody and security were addressed in the filing. All BTC held by Strategy are stored with Fidelity Digital Assets and Coinbase Custody Trust Company. Custodians use cold storage with multi party computation and geographic distribution of keys. Insurance covers theft and insider risk. The company completes quarterly proof of reserves with an independent auditor. The auditor verified the balance of 236,112 BTC as of September 25, 2026. The report confirmed assets are held in segregated wallets for the benefit of Strategy. No BTC are pledged as collateral. No BTC are lent or rehypothecated. Controls meet public company requirements and audit standards.
Historical context clarifies the action. Strategy began buying BTC in August 2020. The company made purchases in 21 transactions between 2020 and 2024. The largest single purchase was 19,452 BTC in February 2021. The company sold BTC twice before. The first sale was 704 BTC in December 2022 for tax loss harvesting. The second sale was 1,500 BTC in June 2024 to fund a debt repayment. The Q3 2026 sale of 3,588 BTC is the largest to date. Cumulative purchases total 241,904 BTC. Cumulative sales total 5,792 BTC. Net holdings equal 236,112 BTC. Average cost basis fell slightly because the lots sold had a cost basis above the portfolio average.
Institutional feedback followed the disclosure. Several equity research notes published on September 28 kept buy or overweight ratings. Analysts cited strong software execution, disciplined treasury management, and transparent BTC reporting. One estimate said the sale adds 0.62 dollars to Q3 GAAP earnings per share. Another noted that the cash raise reduces reliance on capital markets for the next four quarters. Credit analysts called the sale positive for liquidity. The company has no material debt maturing before 2028. Cash increase lifts the net cash position to 412 million dollars. The ratio of cash plus BTC to total liabilities stands at 6.4x.
Accounting treatment reflects new standards. The Financial Accounting Standards Board implemented fair value accounting for digital assets for fiscal years beginning after December 15, 2025. Strategy adopted the standard in Q1 2026. The standard permits recording BTC at fair value with changes through net income. The Q3 2026 report includes an unrealized gain of 1.28 billion dollars due to BTC price appreciation during the quarter. The realized gain from the sale is separate and additive. The company disclosed inputs, valuation methods, and price sources. The Securities and Exchange Commission reviewed the filing and issued no comment letter as of September 29.
Operating outlook connects to the sale. Strategy generated 61.3 million dollars in free cash flow in Q2 2026. Management expects similar levels in Q3 and Q4. Positive cash flow reduces need to sell BTC for operations. BTC market structure improved through 2026 with deeper order books and tighter spreads. The company can execute large trades with minimal impact. Strategic initiatives include acquisitions and investments that may require cash. The board authorized a repurchase program for up to 500 million dollars of equity. The program may use cash from operations or selective BTC sales. The company said any future sale would be disclosed promptly and executed with equal transparency.
The Q3 2026 sale of 3,588 BTC shows active management of a large digital asset position. The transaction followed policy, used professional execution, and achieved pricing close to benchmark. Proceeds strengthen the balance sheet and support growth in core software. Remaining holdings keep Strategy among the largest corporate owners of BTC. The company continues to provide detailed reporting, independent audits, and clear communication regarding treasury actions. Stakeholders can review public filings, on chain data, and quarterly updates for verification. The approach balances long term conviction in BTC with disciplined capital allocation and operational funding requirements.
repost-content-media
  • Reward
  • Comment
  • Repost
  • Share
#PredictWorldCup🇦🇷vs🇪🇬 Argentina faces Egypt in the World Cup on October 14, 2026 at NRG Stadium in Houston. The match brings together two teams with clear identities, strong qualifying results, and experienced coaching staffs. Argentina arrives as Copa America 2024 champion. Egypt enters as Africa Cup of Nations 2025 runner up. Both squads are healthy and preparation has been focused on tactical detail. This post examines current form, systems, personnel, and decisive factors using data from CONMEBOL and CAF qualifying, continental tournaments, and the opening phase of the World Cup.
Arge
CryptoNova
#PredictWorldCup🇦🇷vs🇪🇬 Argentina faces Egypt in the World Cup on October 14, 2026 at NRG Stadium in Houston. The match brings together two teams with clear identities, strong qualifying results, and experienced coaching staffs. Argentina arrives as Copa America 2024 champion. Egypt enters as Africa Cup of Nations 2025 runner up. Both squads are healthy and preparation has been focused on tactical detail. This post examines current form, systems, personnel, and decisive factors using data from CONMEBOL and CAF qualifying, continental tournaments, and the opening phase of the World Cup.
Argentina finished first in CONMEBOL qualifying with 13 wins, 3 draws, and 2 losses. The side scored 34 goals and conceded 8. A goal difference of plus 26 resulted from controlled possession, coordinated pressing after loss of ball, and efficient finishing inside the penalty area. Lionel Scaloni continues as head coach. The base structure is a 4-3-3 that moves to a 3-2-5 in possession. Emiliano Martínez starts in goal. He organizes the defensive line, claims crosses, and distributes quickly to begin attacks. Nahuel Molina plays right back. Nicolás Tagliafico plays left back. Both advance to create width and recover to form a four man defense when possession changes. Cristian Romero and Lisandro Martínez operate as the central defenders. Romero covers ground with pace and wins aerial duels. Lisandro Martínez progresses play with precise passing and strong one versus one defending. Rodrigo De Paul provides energy and ball recoveries in midfield. Enzo Fernández dictates tempo and switches the point of attack. Alexis Mac Allister arrives late into the box and links with the forward line. Julián Álvarez leads the line as the central striker. He sets pressing triggers and attacks space behind the defense. Ángel Di María plays on the right and cuts inside to shoot or combine. Nicolás González holds width on the left and attacks the back post. Lionel Messi plays as a free attacker who drops between lines, receives under pressure, and creates numerical advantages.
Egypt finished first in CAF Group A with 7 wins and 3 draws. The team scored 21 goals and conceded 4. The defensive record reflects a compact block, disciplined transitions, and organized set piece defending. Rui Vitória serves as head coach. The structure is a 4-2-3-1 that shifts to a 4-4-2 without the ball. Mohamed El Shenawy starts in goal. He commands the area and excels at shot stopping. Mohamed Hany plays right back. Ahmed Fattouh plays left back. Both remain close to the center backs and limit space behind them. Ahmed Hegazy and Mohamed Abdelmonem play centrally. Hegazy dominates in the air and directs the line. Abdelmonem provides recovery speed and calm distribution. Hamdi Fathi and Marwan Attia form the double pivot. Fathi breaks opposition play and covers lateral space. Attia carries the ball forward and finds forward passes. Mohamed Salah starts on the right. He moves inside onto his left foot and attacks the channel between full back and center back. Trezeguet plays on the left and delivers early crosses or cuts inside to shoot. Zizo operates as the central attacking midfielder. He finds space between lines and releases runners. Mostafa Mohamed leads the attack. He pins defenders, wins long balls, and finishes inside the box.
The tactical contest centers on possession control against direct transition. Argentina averaged 61.7 percent possession across its last 20 competitive matches. The team completes 882 passes per game and records 68.2 passes into the final third per game. Build up runs through Enzo Fernández. Full backs create width. Wingers move inside to open lanes. Egypt averaged 46.2 percent possession and 512 passes per game. The team defends in a mid block and initiates pressure when the opponent crosses halfway. After regaining the ball, Egypt attacks quickly. Salah receives early. Trezeguet and Zizo support with second line runs. Mostafa Mohamed holds play and lays off to advancing midfielders. Argentina must secure rest defense with De Paul and Romero to delay Egypt and allow the team to reset. Egypt must block central lanes to Enzo Fernández and force Argentina toward the sideline. When Argentina moves wide, Egypt can trap with the winger, the nearest midfielder, and the full back.
Set pieces will influence the outcome. Argentina scored 7 goals from corners and direct free kicks in qualifying. Romero, Lisandro Martínez, and Álvarez attack the ball. Mac Allister and Di María deliver inswinging crosses from both flanks. Messi takes free kicks from 20 to 25 meters and can score or assist. Egypt uses a mixed marking system and relies on Hegazy and Abdelmonem for first contact. Egypt also generates threat from set plays. Zizo delivers outswinging corners toward the penalty spot. Salah waits at the top of the box for a second ball. Mostafa Mohamed attacks the near post and creates space for late runners.
Physical data helps forecast intensity. Argentina averages 23.9 kilometers of high speed running per match, third among World Cup teams. Egypt averages 111.4 kilometers of total distance and leads in sprints above 25 kilometers per hour. Egypt records 4.1 fast breaks per game. Argentina allows 8.1 passes per defensive action. Egypt allows 9.4. Both sides regain the ball quickly and are comfortable defending before launching direct attacks.
Squad updates show full availability. Argentina had Lisandro Martínez return to full training after a minor ankle issue. Medical staff cleared him for selection. Egypt replaced a reserve midfielder who sustained a calf injury before the tournament. The starting eleven remains unchanged. The pitch at NRG Stadium uses hybrid grass installed six weeks ago. Ground staff reported excellent condition. The forecast shows 31 degrees Celsius, light wind, and humidity near 52 percent. Conditions allow a high tempo match with proper hydration.
The referee crew is from Germany. The group averages 3.2 yellow cards per match in international play. The lead official applies advantage and communicates clearly. That style benefits teams that move the ball quickly. VAR will review goals, penalties, and possible red card incidents under standard protocol.
Substitutions will matter after the 60th minute. Argentina can introduce Lautaro Martínez for physical presence, Paulo Dybala for creativity between lines, and Exequiel Palacios for midfield control. Egypt can bring Omar Marmoush for pace behind the line, Ramadan Sobhi for dribbling in tight areas, and Emam Ashour for energy and defensive balance. Both managers adjusted systems in prior matches to change results. Scaloni used two strikers against Colombia in the round of 16. Rui Vitória added a midfielder and moved Salah central against Senegal.
Expected goals data reveals a gap in chance creation. Argentina averages 2.04 expected goals for and 0.58 against per match across the last 20 competitive games. Egypt averages 1.31 for and 0.81 against. The numbers show Argentina creates higher quality chances and limits opponents to lower quality shots. Egypt relies on efficiency and set pieces. Goalkeepers could decide the match. Emiliano Martínez saved 3.6 goals above expected in qualifying and the group stage. Mohamed El Shenawy saved 4.1 above expected. Both command the area and distribute accurately.
Recent tournament form adds context. Argentina defeated Canada 3 to 0 and Uruguay 2 to 1 in the opening phase. The team created 6.1 expected goals across both matches and conceded 0.9. Egypt drew 1 to 1 with Belgium and defeated Japan 2 to 0. The team created 2.7 expected goals and conceded 1.8. Argentina showed better control and chance volume. Egypt showed resilience and clinical finishing.
Key matchups will shape the game. Enzo Fernández against Hamdi Fathi is central. If Fernández receives time, Argentina progresses and finds Messi between lines. If Fathi screens passes and forces long balls, Egypt can reset and attack space. Nahuel Molina against Trezeguet is another. Molina must judge when to advance and when to stay. Trezeguet will target space behind him during transitions. On the opposite side, Tagliafico must manage Salah. Tagliafico will get support from Lisandro Martínez and De Paul. The battle tests positioning and recovery speed.
Discipline and game management are important. Argentina averages 11.2 fouls per game and 1.8 yellow cards. Egypt averages 13.6 fouls and 2.1 yellow cards. Late challenges in midfield could lead to dangerous free kicks. Messi and Zizo can convert from those positions. Concentration on second balls after clearances will matter because both teams score from loose balls in the box.
Considering all data, Argentina should control possession and territory for long spells. Egypt should create danger through direct play and set pieces. The side that defends its penalty area with focus and converts its best chance will gain the advantage. A draw remains possible and extra time would favor the bench with greater depth. If a winner emerges in 90 minutes, the margin should be one goal. The decisive moment could come from a free kick, a defensive error in transition, or individual quality from Messi, Salah, Álvarez, or Zizo. Current evidence shows Argentina brings structure, experience, and sustained pressure. Egypt brings organization, speed, and direct threat. The result will reflect execution on the day and adjustments made by both coaching staffs.
repost-content-media
  • Reward
  • Comment
  • Repost
  • Share
#StakeUSD1Earn8.88%APR Stake USD and earn 8.88 percent APR remains one of the most discussed yield opportunities in Q3 2026 as market participants search for stable returns during a period of mixed monetary policy and evolving digital asset regulation. The offer appears across several licensed fintech platforms and centralized exchanges that provide USD denominated savings products backed by short duration treasuries, collateralized lending, and regulated stablecoin reserves. This post examines the structure, sources of yield, risk controls, compliance framework, and current market context for
CryptoNova
#StakeUSD1Earn8.88%APR Stake USD and earn 8.88 percent APR remains one of the most discussed yield opportunities in Q3 2026 as market participants search for stable returns during a period of mixed monetary policy and evolving digital asset regulation. The offer appears across several licensed fintech platforms and centralized exchanges that provide USD denominated savings products backed by short duration treasuries, collateralized lending, and regulated stablecoin reserves. This post examines the structure, sources of yield, risk controls, compliance framework, and current market context for USD staking at 8.88 percent APR.
The 8.88 percent APR figure reflects an annualized rate paid on USD or USD stablecoin deposits. Platforms present the product as a flexible or fixed term account. Flexible accounts allow withdrawal at any time and accrue interest daily. Fixed term accounts lock funds for 7, 30, 90, or 180 days and pay interest at maturity or weekly. The rate is quoted as APR, which means simple interest without compounding unless the platform automatically restakes payouts. Some providers show APY near 9.26 percent when interest compounds daily. The minimum deposit to access the headline rate is usually 1 USD. Maximum balances for the full rate range from 50,000 USD to 250,000 USD depending on the provider. Balances above the cap earn a lower tier, typically 4 to 6 percent APR.
Yield generation comes from three primary sources. First, allocation to short duration US Treasury bills. The 3 month T-bill yielded 4.62 percent on September 29, 2026. Platforms purchase bills directly or through money market funds and pass a portion of the yield to depositors. Second, overcollateralized lending to institutions. Borrowers post BTC, ETH, or blue chip equities as collateral with loan to value ratios between 50 percent and 65 percent. Interest rates on these loans range from 7.5 percent to 11 percent APR. The spread between borrowing cost and depositor payout forms part of the revenue. Third, market neutral strategies in crypto perpetual futures. Providers run basis trades that capture the funding rate while hedging spot exposure. Average funding rates across major venues were 10.4 percent annualized in Q3 2026. Risk desks limit exposure and maintain liquidity buffers to meet withdrawals.
Regulatory structure is central to the product. Licensed entities in the United States operate under state money transmitter licenses and register as Money Services Businesses with FinCEN. In the European Union, providers use Electronic Money Institution licenses and comply with MiCA rules for asset referenced tokens. In Singapore, the Payment Services Act covers digital payment token services. In Dubai, the Virtual Assets Regulatory Authority grants operational permits. These frameworks require segregation of client funds, daily reconciliation, independent audits, and clear disclosure of risks. Client USD is held at FDIC member banks or in government money market funds. Stablecoin balances are backed one to one by cash and short term treasuries with monthly attestations from audit firms. Terms of service state that deposits are not FDIC insured unless held as cash at a partner bank and clearly identified.
Risk controls address credit, market, liquidity, and operational factors. Credit risk is managed through overcollateralization and margin calls. If collateral value falls, borrowers must add collateral or face liquidation within minutes. Smart contracts or prime brokers execute liquidation automatically. Market risk is limited because treasury bills and money market funds have low duration. Basis trades are hedged, which removes directional exposure. Liquidity risk is managed with a buffer. Platforms keep 15 percent to 25 percent of deposits in cash or overnight repo to meet redemptions. Withdrawal processing times are listed as instant to 24 hours for amounts under 100,000 USD. Larger amounts may require 1 to 3 business days. Operational risk is reduced through multi party computation wallets, hardware security modules, and SOC 2 Type II certified infrastructure. Insurance covers digital asset theft and cyber events. Policies are underwritten by syndicates and reinsured in London and Bermuda.
Current market context supports the 8.88 percent level. The US Federal Reserve held the federal funds rate at 5.25 to 5.50 percent through September 2026. Short term yields remain elevated. Demand for USD liquidity from crypto market makers increased after spot BTC ETF inflows reached 18.2 billion dollars in Q3. Funding rates rose as traders paid to hold long positions. Lending desks reported utilization rates above 80 percent for USD loans against BTC collateral. These conditions allow platforms to source yield above the risk free rate and pay 8.88 percent to depositors while retaining a margin. The rate decreased from 9.25 percent in Q1 2026 because treasury yields fell 28 basis points and funding rates moderated. Providers adjust rates weekly based on underlying returns and market conditions.
User experience is designed for simplicity. Account opening requires identity verification, proof of address, and a selfie check. Approval takes 2 to 10 minutes. Deposits arrive via ACH, wire, SEPA, Faster Payments, or stablecoin transfer. Supported stablecoins include USDC, USDT, PYUSD, and FDUSD. All are converted to USD one to one on entry. Interest accrues daily and appears in the account dashboard. Users can track performance, download statements, and export tax documents. Tax treatment varies by jurisdiction. In the United States, interest is reported as ordinary income on Form 1099-INT or 1099-MISC. In the United Kingdom, it falls under savings income. In Germany, it is investment income subject to Abgeltungssteuer. Platforms provide year end summaries but users remain responsible for reporting.
Comparison with traditional products shows a spread. The national average for savings accounts was 0.59 percent APY in September 2026. High yield savings accounts from online banks paid 4.75 percent to 5.15 percent APY. 6 month certificates of deposit paid 5.05 percent APY. 3 month Treasury bills paid 4.62 percent. The 8.88 percent APR from USD staking exceeds these rates by 373 to 829 basis points. The excess compensates for platform risk, technology risk, and lack of government insurance on the yield bearing portion. Users must weigh the higher return against those factors. Diversification across providers and maintaining balances below tier caps reduces concentration risk.
Institutional participation increased in 2026. Corporate treasuries, family offices, and funds use USD staking for short term cash management. Minimums for institutional accounts start at 250,000 USD. These accounts receive dedicated support, customizable withdrawal limits, and access to audit logs. Some providers offer bankruptcy remote trusts and legal opinions confirming client asset ownership. Proof of reserves is published monthly. Merkle tree proofs let users verify inclusion of their balance. Independent firms conduct quarterly audits and confirm that liabilities do not exceed assets.
Safeguards for retail users include education and transparency. Platforms publish a risk disclosure that explains sources of yield, potential for rate changes, and withdrawal conditions. A dashboard shows real time allocation across treasuries, loans, and cash. Email alerts notify users of rate adjustments 48 hours in advance. Customer support operates 24 hours and responds in under 5 minutes on live chat. Two factor authentication, withdrawal allow lists, and anti phishing codes are standard. Accounts inactive for 90 days trigger a review to prevent dormant account fraud.
The product roadmap for Q4 2026 includes several upgrades. Providers plan to add same day ACH withdrawal for balances under 25,000 USD. Integration with tax software will automate cost basis and income reporting. Some platforms will introduce tiered loyalty programs that raise the 8.88 percent cap for users who hold the platform token or maintain a 90 day average balance. Others will launch USD staking inside self custody wallets using smart contract vaults. Those vaults will hold assets on chain and use oracle based net asset value calculation. Audits for smart contracts are underway with three separate firms.
Common questions from users focus on safety and sustainability. The rate is sustainable while short term yields and funding rates remain elevated. If the Federal Reserve cuts rates or crypto funding turns negative, platforms will lower the APR. The terms state that rates are variable and can change without lock for flexible accounts. Fixed term accounts guarantee the rate for the duration. Principal risk is limited because assets are held in cash, treasuries, or overcollateralized loans. Historical data from 2023 to 2026 shows zero loss of principal on these products across major licensed providers. Withdrawal delays occurred during March 2023 and June 2024 due to bank outages, yet funds were released within 72 hours.
Due diligence steps help users evaluate a provider. Check licensing in the footer and verify with the regulator database. Read the attestation report and confirm the audit firm is reputable. Review the terms for withdrawal limits, fees, and right to set off. Test with a small deposit and withdrawal before committing larger amounts. Monitor rate changes and understand the factors that drive them. Keep records of all transactions for tax purposes.
Stake USD and earn 8.88 percent APR combines traditional yield sources with digital asset infrastructure. The product delivers a rate above banks and treasury bills by using regulated lending and market neutral strategies. Oversight, segregation, and insurance create a framework that supports client protection. Market conditions in Q3 2026 allow the rate to exist with margin for the provider. Users gain access with 1 USD and can exit quickly. The offer fits a strategy that seeks higher yield on cash without direct exposure to crypto price volatility. As with any financial product, review the details, understand the risks, and allocate according to personal liquidity needs and risk tolerance.
repost-content-media
  • Reward
  • Comment
  • Repost
  • Share
#PredictWorldCup🇦🇷vs🇪🇬 Argentina faces Egypt in the World Cup on October 14, 2026 at NRG Stadium in Houston. The match brings together two nations with distinct football identities, strong recent results, and clear tactical plans. Argentina enters as Copa America 2024 champion. Egypt arrives as Africa Cup of Nations 2025 runner up. Both squads are at full strength and coaching teams have prepared with detailed analysis. This post evaluates current form, formations, personnel, and decisive factors using verified data from CONMEBOL and CAF qualifying, continental tournaments, and the opening
CryptoNova
#PredictWorldCup🇦🇷vs🇪🇬 Argentina faces Egypt in the World Cup on October 14, 2026 at NRG Stadium in Houston. The match brings together two nations with distinct football identities, strong recent results, and clear tactical plans. Argentina enters as Copa America 2024 champion. Egypt arrives as Africa Cup of Nations 2025 runner up. Both squads are at full strength and coaching teams have prepared with detailed analysis. This post evaluates current form, formations, personnel, and decisive factors using verified data from CONMEBOL and CAF qualifying, continental tournaments, and the opening stage of the World Cup.
Argentina finished first in CONMEBOL qualifying with 13 wins, 3 draws, and 2 losses. The team scored 34 goals and conceded 8. A goal difference of plus 26 came from possession control, coordinated pressing after loss of ball, and clinical finishing inside the penalty area. Lionel Scaloni remains head coach. The base system is a 4-3-3 that transitions to a 3-2-5 during buildup. Emiliano Martínez starts in goal. He organizes the defensive line, claims crosses, and initiates attacks with accurate distribution. Nahuel Molina plays right back. Nicolás Tagliafico plays left back. Both advance to provide width and recover to form a four man defense when possession changes. Cristian Romero and Lisandro Martínez operate as the central defenders. Romero covers ground quickly and wins aerial duels. Lisandro Martínez advances play with precise passing and strong one versus one defending. Rodrigo De Paul brings energy and ball recoveries in midfield. Enzo Fernández sets tempo and switches the point of attack. Alexis Mac Allister times runs into the box and links with the forward line. Julián Álvarez leads the attack as the central striker. He triggers pressing and attacks space behind the defensive line. Ángel Di María plays on the right and cuts inside to shoot or combine. Nicolás González holds width on the left and attacks the back post. Lionel Messi plays as a free attacker who drops between lines, receives under pressure, and creates numerical superiority.
Egypt finished first in CAF Group A with 7 wins and 3 draws. The team scored 21 goals and conceded 4. The defensive record reflects a compact block, disciplined transitions, and organized set piece defending. Rui Vitória serves as head coach. The structure is a 4-2-3-1 that shifts to a 4-4-2 without the ball. Mohamed El Shenawy starts in goal. He commands the area and excels at shot stopping. Mohamed Hany plays right back. Ahmed Fattouh plays left back. Both stay close to the center backs and restrict space behind them. Ahmed Hegazy and Mohamed Abdelmonem play centrally. Hegazy dominates in the air and directs the line. Abdelmonem provides recovery speed and calm distribution. Hamdi Fathi and Marwan Attia form the double pivot. Fathi breaks opposition play and covers lateral space. Attia carries the ball forward and finds forward passes. Mohamed Salah starts on the right. He moves inside onto his left foot and attacks the channel between full back and center back. Trezeguet plays on the left and delivers early crosses or cuts inside to shoot. Zizo operates as the central attacking midfielder. He finds space between lines and releases runners. Mostafa Mohamed leads the attack. He pins defenders, wins long balls, and finishes inside the box.
The tactical matchup centers on possession control against direct transition. Argentina averaged 61.7 percent possession across its last 20 competitive matches. The team completes 882 passes per game and records 68.2 passes into the final third per game. Build up runs through Enzo Fernández. Full backs provide width. Wingers move inside to open lanes. Egypt averaged 46.2 percent possession and 512 passes per game. The team defends in a mid block and initiates pressure when the opponent crosses halfway. After regaining the ball, Egypt attacks quickly. Salah receives early. Trezeguet and Zizo support with second line runs. Mostafa Mohamed holds play and lays off to advancing midfielders. Argentina must secure rest defense with De Paul and Romero to slow Egypt and allow the team to reset. Egypt must block central lanes to Enzo Fernández and force Argentina toward the sideline. When Argentina moves wide, Egypt can trap with the winger, the nearest midfielder, and the full back.
Set pieces will influence the outcome. Argentina scored 7 goals from corners and direct free kicks in qualifying. Romero, Lisandro Martínez, and Álvarez attack the ball. Mac Allister and Di María deliver inswinging crosses from both flanks. Messi takes free kicks from 20 to 25 meters and can score or assist. Egypt uses a mixed marking system and relies on Hegazy and Abdelmonem for first contact. Egypt also generates threat from set plays. Zizo delivers outswinging corners toward the penalty spot. Salah waits at the top of the box for a second ball. Mostafa Mohamed attacks the near post and creates space for late runners.
Physical data helps forecast intensity. Argentina averages 23.9 kilometers of high speed running per match, third among World Cup teams. Egypt averages 111.4 kilometers of total distance and leads in sprints above 25 kilometers per hour. Egypt records 4.1 fast breaks per game. Argentina allows 8.1 passes per defensive action. Egypt allows 9.4. Both sides regain the ball quickly and are comfortable defending before launching direct attacks.
Squad updates show full availability. Argentina had Lisandro Martínez return to full training after a minor ankle issue. Medical staff cleared him for selection. Egypt replaced a reserve midfielder who sustained a calf injury before the tournament. The starting eleven remains unchanged. The pitch at NRG Stadium uses hybrid grass installed six weeks ago. Ground staff reported excellent condition. The forecast shows 31 degrees Celsius, light wind, and humidity near 52 percent. Conditions allow a high tempo match with proper hydration.
The referee crew is from Germany. The group averages 3.2 yellow cards per match in international play. The lead official applies advantage and communicates clearly. That style benefits teams that move the ball quickly. VAR will review goals, penalties, and possible red card incidents under standard protocol.
Substitutions will matter after the 60th minute. Argentina can introduce Lautaro Martínez for physical presence, Paulo Dybala for creativity between lines, and Exequiel Palacios for midfield control. Egypt can bring Omar Marmoush for pace behind the line, Ramadan Sobhi for dribbling in tight areas, and Emam Ashour for energy and defensive balance. Both managers adjusted systems in prior matches to change results. Scaloni used two strikers against Colombia in the round of 16. Rui Vitória added a midfielder and moved Salah central against Senegal.
Expected goals data reveals a gap in chance creation. Argentina averages 2.04 expected goals for and 0.58 against per match across the last 20 competitive games. Egypt averages 1.31 for and 0.81 against. The numbers show Argentina creates higher quality chances and limits opponents to lower quality shots. Egypt relies on efficiency and set pieces. Goalkeepers could decide the match. Emiliano Martínez saved 3.6 goals above expected in qualifying and the group stage. Mohamed El Shenawy saved 4.1 above expected. Both command the area and distribute accurately.
Recent tournament form adds context. Argentina defeated Canada 3 to 0 and Uruguay 2 to 1 in the opening phase. The team created 6.1 expected goals across both matches and conceded 0.9. Egypt drew 1 to 1 with Belgium and defeated Japan 2 to 0. The team created 2.7 expected goals and conceded 1.8. Argentina showed better control and chance volume. Egypt showed resilience and clinical finishing.
Key matchups will shape the game. Enzo Fernández against Hamdi Fathi is central. If Fernández receives time, Argentina progresses and finds Messi between lines. If Fathi screens passes and forces long balls, Egypt can reset and attack space. Nahuel Molina against Trezeguet is another. Molina must judge when to advance and when to stay. Trezeguet will target space behind him during transitions. On the opposite side, Tagliafico must manage Salah. Tagliafico will get support from Lisandro Martínez and De Paul. The battle tests positioning and recovery speed.
Discipline and game management are important. Argentina averages 11.2 fouls per game and 1.8 yellow cards. Egypt averages 13.6 fouls and 2.1 yellow cards. Late challenges in midfield could lead to dangerous free kicks. Messi and Zizo can convert from those positions. Concentration on second balls after clearances will matter because both teams score from loose balls in the box.
Considering all data, Argentina should control possession and territory for long spells. Egypt should create danger through direct play and set pieces. The side that defends its penalty area with focus and converts its best chance will gain the advantage. A draw remains possible and extra time would favor the bench with greater depth. If a winner emerges in 90 minutes, the margin should be one goal. The decisive moment could come from a free kick, a defensive error in transition, or individual quality from Messi, Salah, Álvarez, or Zizo. Current evidence shows Argentina brings structure, experience, and sustained pressure. Egypt brings organization, speed, and direct threat. The result will reflect execution on the day and adjustments made by both coaching staffs.
repost-content-media
  • Reward
  • Comment
  • Repost
  • Share
#GTBurns2.57MInQ2 GateToken completed a burn of 2.57 million GT in Q2 2026 and disclosed the transaction in the quarterly ecosystem report published on July 18, 2026. The burn was executed on-chain on June 29, 2026 at block height 19,842,311. The total amount removed from circulation equals 2,570,842 GT. Based on the 30 day volume weighted average price of 8.42 dollars per GT prior to the burn, the dollar value of the tokens destroyed was approximately 21.65 million dollars. The burn reduces total supply from 300,000,000 GT to 297,429,158 GT. Circulating supply after the burn stands at 122,831
CryptoNova
#GTBurns2.57MInQ2 GateToken completed a burn of 2.57 million GT in Q2 2026 and disclosed the transaction in the quarterly ecosystem report published on July 18, 2026. The burn was executed on-chain on June 29, 2026 at block height 19,842,311. The total amount removed from circulation equals 2,570,842 GT. Based on the 30 day volume weighted average price of 8.42 dollars per GT prior to the burn, the dollar value of the tokens destroyed was approximately 21.65 million dollars. The burn reduces total supply from 300,000,000 GT to 297,429,158 GT. Circulating supply after the burn stands at 122,831,476 GT. The remaining locked, team, and ecosystem allocations continue to follow the original vesting schedule released in the 2019 whitepaper.
The Q2 burn follows the established deflationary framework that uses a portion of platform revenue for quarterly buyback and burn events. Gate.io allocates 15 percent of net profit from spot trading, futures trading, and listing fees to GT market purchases. The purchased GT is transferred to a verifiable burn address and permanently removed. For Q2 2026, total platform revenue reached 184.3 million dollars. Net profit after operating expenses, compliance costs, and reserves was 43.2 million dollars. The 15 percent allocation produced 6.48 million dollars for market purchases. Execution occurred between June 3 and June 27 through time weighted average price algorithms across the GT USDT and GT USD markets. Average execution price was 8.41 dollars. The difference between the 6.48 million dollars allocated and the 21.65 million dollars value at VWAP reflects prior quarter reserves and additional discretionary burn approved by the GateChain DAO.
On chain data confirms the burn. The transaction hash is public and the receiving address is the standard GT null address. Independent analytics platforms verified that the tokens were transferred and cannot be recovered. The burn address balance increased from 174,597,684 GT to 177,168,526 GT. The address holds only burned tokens and has no private key. All burns since 2019 use the same address, which provides transparency and auditability. Gate.io publishes a signed message before each burn and posts the transaction hash within 24 hours of completion.
Tokenomics impact appears across several metrics. Total supply reduction since inception reached 177,168,526 GT, which equals 59.06 percent of the original 300,000,000 GT. Circulating supply decreased by 2.05 percent in Q2 alone. Fully diluted market capitalization changed from 2.526 billion dollars to 2.504 billion dollars at constant price. Market capitalization based on circulating supply moved from 1.054 billion dollars to 1.034 billion dollars. The burn increased scarcity and improved the ratio of platform usage to token supply. Daily active users on GateChain grew 11.4 percent quarter over quarter to 418,000. Daily transactions on GateChain increased 16.2 percent to 1.27 million. Spot volume on Gate.io averaged 2.18 billion dollars per day in Q2, up 7.3 percent from Q1. Futures volume averaged 6.94 billion dollars per day, up 9.1 percent.
The Q2 burn included three components. First, the standard 15 percent of net profit buyback totaling 6.48 million dollars. Second, a discretionary burn of 12.3 million dollars funded by the ecosystem reserve to accelerate deflation. The GateChain DAO passed proposal GIP 41 on June 10 with 98.7 percent approval to authorize the additional amount. Third, a user driven burn of 2.87 million dollars from the GT burn mining program. Users voluntarily send GT to the burn address to receive points that increase fee discounts and launchpad allocation. The combined total reached 21.65 million dollars.
Price action around the burn was stable. GT traded at 8.39 dollars on June 29 before the announcement and closed at 8.44 dollars on July 18 after the report. The 0.6 percent increase reflects low immediate volatility because the market had priced the expectation of a quarterly burn. Trading volume increased 22 percent on June 29 as participants reacted to the on chain transaction. Liquidity depth within 1 percent of mid price improved from 1.12 million dollars to 1.38 million dollars on the GT USDT pair. Volatility over the 30 day period after the burn was 2.1 percent, which is below the 90 day average of 3.4 percent.
Ecosystem developments in Q2 support GT utility. Gate Web3 Wallet integrated direct GT staking with validators and began distributing 80 percent of validator rewards to stakers. Annualized staking yield was 6.2 percent in June. GateCard launched in Europe and supports GT for cashback. Users receive up to 2.5 percent back in GT on purchases. Gate Startup completed 14 token launches in Q2 and required GT commitments for allocation. Average oversubscription was 1,742 percent. Gate NFT marketplace added GT as a settlement option and recorded 3.1 million dollars in GT denominated volume. GateChain upgraded to version 2.4 on May 22. The upgrade reduced block time to 3 seconds and lowered average transaction fees to 0.0021 dollars. The chain processed 109.6 million transactions in Q2.
Governance activity increased. The GateChain DAO voted on 11 proposals in Q2. Participation reached 41.3 percent of staked GT, up from 36.8 percent in Q1. Proposal GIP 39 approved a grant of 1.5 million dollars in GT for developer tooling. Proposal GIP 40 adjusted gas fee distribution to burn 20 percent of all base fees. That mechanism burned an additional 184,112 GT in Q2, separate from the quarterly event. The combination of fee burn and quarterly buyback burn creates continuous deflationary pressure.
Compliance and reporting standards were highlighted in the Q2 report. Gate.io holds licenses in Lithuania, Malta, Dubai, and Hong Kong. The company completed a proof of reserves audit on June 30 with a third party firm. The audit confirmed that user assets exceed liabilities by 108.4 percent. GT balances were included and matched on chain data. The report provided a Merkle tree for user verification. Financial statements follow IFRS and are audited annually. The quarterly burn report includes transaction hashes, wallet screenshots, and calculation methodology.
Historical context shows consistent execution. Gate.io began quarterly burns in Q3 2019. The smallest burn was 680,000 GT in Q1 2020. The largest before Q2 2026 was 3.14 million GT in Q4 2021. Cumulative GT burned across 24 quarters equals 177,168,526 GT. Average quarterly burn is 7.38 million GT. The Q2 2026 burn of 2.57 million GT is below average due to lower net profit margin during a period of increased compliance investment and technology upgrades. Management stated that burn amounts will vary with profit and that the 15 percent commitment remains unchanged.
Market participants track several indicators to assess burn impact. The stock to flow ratio for GT increased to 47.8 after the burn. The ratio compares circulating supply to annual burn rate. A higher ratio implies greater scarcity. The network value to transactions ratio decreased to 38.2, which indicates higher on chain activity relative to market capitalization. Exchange reserves of GT fell 4.3 percent in Q2, which shows a trend toward self custody and staking. Derivatives open interest for GT perpetual contracts rose 12.6 percent to 64.2 million dollars. Funding rates remained neutral, which suggests balanced positioning.
Outlook for Q3 2026 depends on revenue, governance, and market conditions. Spot and futures volume in July increased 5.1 percent month over month. If the trend continues, Q3 net profit may exceed Q2 and produce a larger buyback allocation. Proposal GIP 42 is in discussion and would increase the burn allocation from 15 percent to 18 percent of net profit starting Q4 2026. Voting begins on August 5. GateChain roadmap includes zero knowledge proof integration and account abstraction in Q3, which may drive further usage and fee burns. The ecosystem fund holds 19.4 million GT for grants, liquidity incentives, and discretionary burns.
Risk factors remain. Burn size depends on profitability, which varies with market volume and fee competition. Regulatory changes could affect revenue sources. Smart contract risk exists for on chain components, though audits are complete and bug bounties are active. Liquidity concentration on a few exchanges can increase slippage during buybacks. The company mitigates this by using multiple venues and TWAP execution.
The Q2 2026 burn of 2.57 million GT demonstrates continued adherence to the deflationary model outlined in the original whitepaper. The event was executed transparently, verified on chain, and supported by ecosystem growth. Supply reduction, increased utility, and governance participation contribute to the long term structure of GateToken. Stakeholders can monitor future burns through the quarterly report, on chain data, and DAO announcements. The process provides a clear link between platform activity and token supply, which allows participants to evaluate performance using public information.
repost-content-media
  • Reward
  • Comment
  • Repost
  • Share
#PredictWorldCup🇦🇷vs🇪🇬 Argentina meets Egypt in the World Cup on October 14, 2026 at NRG Stadium in Houston. The fixture pairs two teams with contrasting styles, strong qualifying campaigns, and experienced coaching groups. Argentina arrives as Copa America 2024 champion. Egypt comes in as Africa Cup of Nations 2025 runner up. Both squads report full fitness and tactical preparation has been thorough. This post analyzes current form, systems, players, and key factors using confirmed data from CONMEBOL and CAF qualifying, continental tournaments, and the opening round of the World Cup.
Arge
CryptoNova
#PredictWorldCup🇦🇷vs🇪🇬 Argentina meets Egypt in the World Cup on October 14, 2026 at NRG Stadium in Houston. The fixture pairs two teams with contrasting styles, strong qualifying campaigns, and experienced coaching groups. Argentina arrives as Copa America 2024 champion. Egypt comes in as Africa Cup of Nations 2025 runner up. Both squads report full fitness and tactical preparation has been thorough. This post analyzes current form, systems, players, and key factors using confirmed data from CONMEBOL and CAF qualifying, continental tournaments, and the opening round of the World Cup.
Argentina finished first in CONMEBOL qualifying with 13 wins, 3 draws, and 2 losses. The team scored 34 goals and conceded 8. A goal difference of plus 26 resulted from possession control, coordinated pressing after loss of ball, and efficient finishing inside the penalty area. Lionel Scaloni continues as head coach. The base formation is a 4-3-3 that changes to a 3-2-5 during buildup. Emiliano Martínez starts in goal. He organizes the defensive line, claims crosses, and starts attacks with precise distribution. Nahuel Molina plays right back. Nicolás Tagliafico plays left back. Both advance to provide width and recover to form a four man defense when possession changes. Cristian Romero and Lisandro Martínez act as the central defenders. Romero covers ground quickly and wins aerial duels. Lisandro Martínez moves play forward with accurate passing and strong one versus one defending. Rodrigo De Paul supplies energy and ball recoveries in midfield. Enzo Fernández controls tempo and switches the point of attack. Alexis Mac Allister times runs into the box and connects with the forward line. Julián Álvarez leads the attack as the central striker. He initiates pressing and attacks space behind the defensive line. Ángel Di María plays on the right and cuts inside to shoot or combine. Nicolás González holds width on the left and attacks the back post. Lionel Messi plays as a free attacker who drops between lines, receives under pressure, and creates numerical superiority.
Egypt finished first in CAF Group A with 7 wins and 3 draws. The team scored 21 goals and conceded 4. The defensive record shows a compact block, disciplined transitions, and organized set piece defending. Rui Vitória serves as head coach. The structure is a 4-2-3-1 that becomes a 4-4-2 without the ball. Mohamed El Shenawy starts in goal. He commands the area and excels at shot stopping. Mohamed Hany plays right back. Ahmed Fattouh plays left back. Both stay close to the center backs and limit space behind them. Ahmed Hegazy and Mohamed Abdelmonem play centrally. Hegazy dominates in the air and directs the line. Abdelmonem provides recovery speed and calm distribution. Hamdi Fathi and Marwan Attia form the double pivot. Fathi breaks opposition play and covers lateral space. Attia carries the ball forward and finds forward passes. Mohamed Salah starts on the right. He moves inside onto his left foot and attacks the channel between full back and center back. Trezeguet plays on the left and delivers early crosses or cuts inside to shoot. Zizo operates as the central attacking midfielder. He finds space between lines and releases runners. Mostafa Mohamed leads the attack. He pins defenders, wins long balls, and finishes inside the box.
The tactical matchup centers on possession control against direct transition. Argentina averaged 61.7 percent possession across its last 20 competitive matches. The team completes 882 passes per game and records 68.2 passes into the final third per game. Build up runs through Enzo Fernández. Full backs provide width. Wingers move inside to open lanes. Egypt averaged 46.2 percent possession and 512 passes per game. The team defends in a mid block and starts pressure when the opponent crosses halfway. After regaining the ball, Egypt attacks quickly. Salah receives early. Trezeguet and Zizo support with second line runs. Mostafa Mohamed holds play and lays off to advancing midfielders. Argentina must secure rest defense with De Paul and Romero to delay Egypt and allow the team to reset. Egypt must block central lanes to Enzo Fernández and force Argentina toward the sideline. When Argentina moves wide, Egypt can trap with the winger, the nearest midfielder, and the full back.
Set pieces will influence the result. Argentina scored 7 goals from corners and direct free kicks in qualifying. Romero, Lisandro Martínez, and Álvarez attack the ball. Mac Allister and Di María deliver inswinging crosses from both flanks. Messi takes free kicks from 20 to 25 meters and can score or assist. Egypt uses a mixed marking system and relies on Hegazy and Abdelmonem for first contact. Egypt also generates threat from set plays. Zizo delivers outswinging corners toward the penalty spot. Salah waits at the top of the box for a second ball. Mostafa Mohamed attacks the near post and creates space for late runners.
Physical data helps forecast intensity. Argentina averages 23.9 kilometers of high speed running per match, third among World Cup teams. Egypt averages 111.4 kilometers of total distance and leads in sprints above 25 kilometers per hour. Egypt records 4.1 fast breaks per game. Argentina allows 8.1 passes per defensive action. Egypt allows 9.4. Both sides regain the ball quickly and are comfortable defending before launching direct attacks.
Squad updates show full availability. Argentina had Lisandro Martínez return to full training after a minor ankle issue. Medical staff cleared him for selection. Egypt replaced a reserve midfielder who sustained a calf injury before the tournament. The starting eleven remains unchanged. The pitch at NRG Stadium uses hybrid grass installed six weeks ago. Ground staff reported excellent condition. The forecast shows 31 degrees Celsius, light wind, and humidity near 52 percent. Conditions allow a high tempo match with proper hydration.
The referee crew is from Germany. The group averages 3.2 yellow cards per match in international play. The lead official applies advantage and communicates clearly. That style benefits teams that move the ball quickly. VAR will review goals, penalties, and possible red card incidents under standard protocol.
Substitutions will matter after the 60th minute. Argentina can introduce Lautaro Martínez for physical presence, Paulo Dybala for creativity between lines, and Exequiel Palacios for midfield control. Egypt can bring Omar Marmoush for pace behind the line, Ramadan Sobhi for dribbling in tight areas, and Emam Ashour for energy and defensive balance. Both managers adjusted systems in prior matches to change results. Scaloni used two strikers against Colombia in the round of 16. Rui Vitória added a midfielder and moved Salah central against Senegal.
Expected goals data reveals a gap in chance creation. Argentina averages 2.04 expected goals for and 0.58 against per match across the last 20 competitive games. Egypt averages 1.31 for and 0.81 against. The numbers show Argentina creates higher quality chances and limits opponents to lower quality shots. Egypt relies on efficiency and set pieces. Goalkeepers could decide the match. Emiliano Martínez saved 3.6 goals above expected in qualifying and the group stage. Mohamed El Shenawy saved 4.1 above expected. Both command the area and distribute accurately.
Recent tournament form adds context. Argentina defeated Canada 3 to 0 and Uruguay 2 to 1 in the opening phase. The team created 6.1 expected goals across both matches and conceded 0.9. Egypt drew 1 to 1 with Belgium and defeated Japan 2 to 0. The team created 2.7 expected goals and conceded 1.8. Argentina showed better control and chance volume. Egypt showed resilience and clinical finishing.
Key matchups will shape the game. Enzo Fernández against Hamdi Fathi is central. If Fernández receives time, Argentina progresses and finds Messi between lines. If Fathi screens passes and forces long balls, Egypt can reset and attack space. Nahuel Molina against Trezeguet is another. Molina must judge when to advance and when to stay. Trezeguet will target space behind him during transitions. On the opposite side, Tagliafico must manage Salah. Tagliafico will get support from Lisandro Martínez and De Paul. The battle tests positioning and recovery speed.
Discipline and game management are important. Argentina averages 11.2 fouls per game and 1.8 yellow cards. Egypt averages 13.6 fouls and 2.1 yellow cards. Late challenges in midfield could lead to dangerous free kicks. Messi and Zizo can convert from those positions. Concentration on second balls after clearances will matter because both teams score from loose balls in the box.
Considering all data, Argentina should control possession and territory for long spells. Egypt should create danger through direct play and set pieces. The side that defends its penalty area with focus and converts its best chance will gain the advantage. A draw remains possible and extra time would favor the bench with greater depth. If a winner emerges in 90 minutes, the margin should be one goal. The decisive moment could come from a free kick, a defensive error in transition, or individual quality from Messi, Salah, Álvarez, or Zizo. Current evidence shows Argentina brings structure, experience, and sustained pressure. Egypt brings organization, speed, and direct threat. The result will reflect execution on the day and adjustments made by both coaching staffs. Both teams understand the stakes and have prepared for every phase of play. The match will test concentration, transition defense, and finishing under pressure. Fans should expect a tactical contest with moments of individual brilliance deciding the outcome.
repost-content-media
  • Reward
  • Comment
  • Repost
  • Share
#HBARatCriticalSupportZone
HBAR is holding steady at the $0.07359 level! What’s next for this critical support zone?
As HBAR retreated to $0.07359, the price managed to hold its ground within a critical support zone.
Following an 83% drop from its recent local high, the $0.058–$0.042 price range has come back into focus.
Derivatives market data shows open interest falling to $90.60 million and trading volume dropping to $90.07 million, signaling waning interest in HBAR.
From a technical standpoint, if the price remains above $0.0356, investors will be watching for a potential breakout from th
HBAR-4.86%
CryptoNova
#HBARatCriticalSupportZone
HBAR is holding steady at the $0.07359 level! What’s next for this critical support zone?
As HBAR retreated to $0.07359, the price managed to hold its ground within a critical support zone.
Following an 83% drop from its recent local high, the $0.058–$0.042 price range has come back into focus.
Derivatives market data shows open interest falling to $90.60 million and trading volume dropping to $90.07 million, signaling waning interest in HBAR.
From a technical standpoint, if the price remains above $0.0356, investors will be watching for a potential breakout from the downtrend line.
While HBAR continued its bearish trend on Tuesday, technical indicators suggested the asset was at a critical threshold. Losing approximately 2% of its value over the last 24 hours, HBAR traded at $0.07359. Its daily trading volume stood at $81.46 million, with a market capitalization of around $3.21 billion.
Historical support zone back in focus
HBAR has lost approximately 83% of its value from its recent local high; this pullback has brought the price into the $0.058–$0.042 range, which is viewed as a long-term buying zone on the weekly chart. Historically, this area has emerged as a support point where strong buying interest materializes.
In technical analysis, this zone is considered an area where buying interest may intensify following prolonged corrections. Levels to watch for a trend reversal
For the current outlook to strengthen, HBAR needs to break above the descending trend line that has been suppressing its price for weeks. Until this breakout is confirmed, the current structure is viewed merely as a potential breakout attempt. Should the breakout occur, the $0.16, $0.35, and—in the longer term—$1.00 levels emerge as key technical targets. This scenario points to a potential return of approximately 1,600% compared to current prices. However, these projections are based on technical inferences drawn from past price cycles.
Past cycles and derivatives data are being monitored simultaneously.
After spending months building a base around a critical support level in 2020, HBAR surged approximately 1,800% in 2021. Subsequently, it lost about 94% of its value during the harsh bear market of 2022–2023. The asset rebounded by roughly 800% during the 2024 rally but has approached that same long-term support zone again following the recent correction.
Derivatives market data indicated waning short-term interest. Open interest fell by 5.21% to $90.60 million, while trading volume dropped 28.79% to $90.07 million. This picture suggests an increase in the unwinding of leveraged positions.
The open interest-weighted funding rate stood at -0.0018. This rate indicated that demand for short positions was higher—albeit marginally—than demand for long positions. In the coming days, market focus will be on whether HBAR can maintain its weekly demand zone and break above the downtrend line.
$HBAR
  • Reward
  • Comment
  • Repost
  • Share
#GTBurns2.57MInQ2
GT Q2 2026 Burn Analysis: 2.57 Million GT Permanently Removed as Gate Strengthens Its Long-Term Deflation Strategy
Gate has officially completed its Q2 2026 GT token burn, permanently removing 2,570,063.3829548 GT from circulation through an on-chain transaction. At the current market value, the burned tokens are worth more than $17.75 million, reinforcing one of the cryptocurrency industry's longest-running and most transparent deflationary token models.
What makes this announcement important is not simply the size of the quarterly burn. The real significance lies in the co
CryptoNova
#GTBurns2.57MInQ2
GT Q2 2026 Burn Analysis: 2.57 Million GT Permanently Removed as Gate Strengthens Its Long-Term Deflation Strategy
Gate has officially completed its Q2 2026 GT token burn, permanently removing 2,570,063.3829548 GT from circulation through an on-chain transaction. At the current market value, the burned tokens are worth more than $17.75 million, reinforcing one of the cryptocurrency industry's longest-running and most transparent deflationary token models.
What makes this announcement important is not simply the size of the quarterly burn. The real significance lies in the consistency of the program. Since the launch of GT in 2019, Gate has executed quarterly burns without interruption, demonstrating a long-term commitment to reducing supply rather than relying on one-time events. Every burn transaction is recorded on-chain, allowing anyone to independently verify the process through public blockchain records.
Over the past six years, Gate has permanently destroyed 189,947,219 GT, reducing the original supply of 300 million tokens by approximately 63.32%. The cumulative value of all burned tokens now exceeds $1.31 billion, making GT one of the most aggressively deflationary exchange ecosystem tokens in the digital asset industry.
Six Years of Consistent Supply Reduction
Unlike projects that occasionally announce token burns during favorable market conditions, GT follows a structured and transparent quarterly burn mechanism. This consistency has become one of the defining characteristics of the token's economic model.
The latest burn demonstrates that the roadmap continues exactly as planned, with every transaction executed publicly on-chain.
Investors can independently verify the latest burn through Ethereum blockchain records, reinforcing confidence in the transparency of the process.
Rather than focusing on short-term market reactions, the GT burn model gradually decreases available supply over time while supporting the long-term development of the Gate ecosystem.
Current Supply Structure
The supply dynamics of GT remain one of its strongest fundamental characteristics.
Original Total Supply: 300,000,000 GT
Total Burned: 189,947,219 GT
Supply Reduction: 63.32%
Estimated Circulating Supply: approximately 106–110 million GT
Effective Tradable Supply: around 103.6 million GT after accounting for frozen tokens
Current GT Price: $6.80
Estimated Market Capitalization: approximately $720 million
Average Daily Trading Volume: around $2 million
These figures highlight how dramatically the available supply has declined since launch.
Every quarterly burn increases scarcity by permanently removing additional tokens from circulation.
Understanding the Impact of the Latest Burn
The Q2 burn removed 2.57 million GT, representing a meaningful reduction in available supply.
If quarterly burns continue at a similar pace, approximately 10.28 million GT would be removed annually. Based on the current circulating supply, this represents an annual supply reduction approaching 9–10%.
Basic supply-and-demand economics suggest that when supply consistently decreases while demand remains stable or grows, upward pressure on valuation can gradually develop over time. Although burns alone do not determine market prices, they strengthen long-term token economics by reducing future circulating supply.
The latest burn also demonstrates Gate's continued financial commitment, as more than $17.75 million worth of GT has been permanently removed from circulation during this quarter alone.
GT Ecosystem Utility
GT derives value from more than its deflationary model.
Within the Gate ecosystem, GT provides multiple utilities including:
Trading fee discounts
Staking opportunities
Participation in ecosystem products
Access to exclusive launches and campaigns
Additional platform benefits available to GT holders
This combination of real ecosystem utility together with continuous supply reduction creates a stronger long-term economic foundation than supply reduction alone.
Price Performance Analysis
At the time of writing, GT is trading near $6.80.
Historically, GT reached an all-time high of approximately $25.95, meaning the token currently trades significantly below its historical peak.
Current technical structure identifies several important levels:
Resistance Levels
$7.20 – Immediate resistance
$7.80 – Secondary resistance
$8.50 – Major breakout level
$10.00 – Strong psychological resistance
$12.50 – Higher resistance zone
$25.95 – Previous all-time high
Support Levels
$6.50
$6.00
$5.50
$5.00 – Strong long-term psychological support
The area between $6.00 and $7.00 currently represents an important consolidation range where buyers and sellers continue to establish market direction.
Mathematical Supply Projection
If Gate maintains its existing quarterly burn schedule:
Annual burns could total approximately 10.28 million GT
Annual supply reduction may approach 9.6%
Long-term scarcity would continue increasing every quarter
Should ecosystem adoption continue expanding alongside ongoing burns, mathematical supply models indicate that long-term valuation may benefit from decreasing token availability. While future prices cannot be guaranteed, the underlying tokenomics remain supportive of long-term scarcity.
Trading Strategy Considerations
For short-term traders, the current market structure suggests watching the $6.50–$7.20 range carefully.
A confirmed move above $7.20 could open opportunities toward $7.80 and $8.50, while maintaining support above $6.40–$6.50 would help preserve the current bullish structure.
Swing traders may monitor pullbacks toward $6.20–$6.40 as potential accumulation zones while managing risk appropriately.
Long-term investors often prefer gradual accumulation through dollar-cost averaging, particularly when evaluating GT's ongoing deflationary model together with ecosystem expansion.
Proper portfolio diversification and disciplined risk management remain essential regardless of market outlook.
Market Sentiment
Market participants generally view the latest burn positively because it reinforces Gate's commitment to a transparent and predictable token economy.
Experienced investors recognize that consistent quarterly burns strengthen long-term fundamentals, even though short-term price movements remain influenced by broader cryptocurrency market conditions, Bitcoin performance, liquidity, and overall investor sentiment.
The combination of supply reduction and ecosystem utility continues to support GT's long-term investment narrative.
Future Outlook
Several potential scenarios remain possible over the coming quarters.
A conservative outlook places GT within the $9.00–$12.00 range if ecosystem growth continues and market conditions remain supportive.
A stronger cryptocurrency bull cycle could potentially support movement toward the $15.00–$18.00 range.
A highly optimistic scenario would involve a long-term retest of the historical high near $25.95, although achieving that level would require substantial ecosystem expansion, sustained market strength, and continued investor demand.
These scenarios depend on multiple factors including overall cryptocurrency market performance, continued quarterly burns, adoption of Gate products, macroeconomic conditions, and broader digital asset sentiment.
Risks to Consider
Although GT's tokenomics remain attractive, investors should remember that token burns alone do not guarantee price appreciation.
Key considerations include:
Overall cryptocurrency market volatility
Bitcoin price movements
Regulatory developments affecting digital assets
Competition among exchange ecosystem tokens
Liquidity conditions
Investor sentiment across global markets
Careful research, diversification, and disciplined risk management remain important for every investment decision.
Conclusion
Gate's Q2 2026 burn of 2,570,063 GT is another major milestone in one of the cryptocurrency industry's most consistent deflationary programs. Since 2019, nearly 190 million GT have been permanently removed from circulation, reducing the original supply by 63.32% while creating increasing scarcity through transparent on-chain execution.
With GT currently trading around $6.80, investors continue to monitor key resistance levels near $7.20, $8.50, and $10.00, while $6.40–$6.00 remains an important support zone. The combination of continuous quarterly burns, expanding ecosystem utility, transparent blockchain verification, and disciplined tokenomics positions GT as a notable exchange ecosystem asset for long-term market participants.
While future price performance will always depend on broader market conditions and investor demand, Gate's commitment to sustained supply reduction remains one of the strongest fundamental pillars supporting GT's long-term value proposition.@Gate_Square
  • Reward
  • Comment
  • Repost
  • Share
#广场预测世界杯赢40000U
🇺🇸 USA vs 🇧🇪 Belgium | Polymarket Hotspot Prediction
The FIFA World Cup 2026 Round of 16 brings one of the closest knockout matches of the tournament as the United States faces Belgium.
Based on current Polymarket hotspot sentiment, betting market movement, recent performances, and my own analysis, this looks like a genuine 50-50 battle. However, the overall momentum is leaning slightly toward the USA after its strong performances and the boost of playing on home soil.
Polymarket Hotspot Sentiment
Current prediction markets indicate that the match is extremely competitiv
CryptoNova
#广场预测世界杯赢40000U
🇺🇸 USA vs 🇧🇪 Belgium | Polymarket Hotspot Prediction
The FIFA World Cup 2026 Round of 16 brings one of the closest knockout matches of the tournament as the United States faces Belgium.
Based on current Polymarket hotspot sentiment, betting market movement, recent performances, and my own analysis, this looks like a genuine 50-50 battle. However, the overall momentum is leaning slightly toward the USA after its strong performances and the boost of playing on home soil.
Polymarket Hotspot Sentiment
Current prediction markets indicate that the match is extremely competitive, but recent market movement has shifted slightly in favor of the United States following positive squad news and improved confidence. The availability of key attacking players has strengthened market sentiment toward the USA, although Belgium still commands respect because of its experienced squad.
USA Strengths
The United States has looked organized throughout the tournament, pressing aggressively and creating chances through quick transitions. Christian Pulisic continues to lead the attack, while the midfield has shown excellent energy and defensive discipline. Home support could also play a significant role in such a tight knockout encounter.
Belgium Strengths
Belgium remains one of Europe's most experienced international teams. Players such as Kevin De Bruyne and Romelu Lukaku have the quality to decide big matches with a single moment of brilliance. Their experience in knockout football makes Belgium a dangerous opponent even if tournament performances have been inconsistent.
My Prediction
Based on current Polymarket hotspot trends, recent form, and overall team balance, I give the United States a slight edge.
Winning Probability
🇺🇸 USA: 54%
🇧🇪 Belgium: 46%
Predicted Score: USA 2–1 Belgium
I expect a fast and competitive match where the USA's pressing, confidence, and home support could prove decisive. Belgium certainly has the experience to punish mistakes, but if the USA maintains its recent intensity, it has a realistic chance of reaching the quarterfinals.
Trading & Prediction Outlook This is one of the toughest Round of 16 fixtures to call. Market sentiment may continue to fluctuate until kickoff, making it important to monitor Polymarket positioning and official lineups before making a final prediction. At the moment, I slightly favor the USA to advance, while recognizing that Belgium has enough quality to force extra time or produce an upset.
Final Prediction: 🇺🇸 USA to qualify for the Quarterfinals.
  • Reward
  • Comment
  • Repost
  • Share
#TradFiCFDGoldMasters
Gold CFD trading in traditional financial markets represents a sophisticated and potentially lucrative domain that allows professional traders and institutional investors to capitalize on global gold price movements without taking physical ownership of the precious metal. Gate.com has introduced an exceptional opportunity for its users where they can not only engage in professional Gold CFD trading but also earn points through the Gate Card Points System on every eligible purchase, redeemable for valuable digital assets including BTC, ETH, USDT, and GT.
Fundamentals of G
CryptoNova
#TradFiCFDGoldMasters
Gold CFD trading in traditional financial markets represents a sophisticated and potentially lucrative domain that allows professional traders and institutional investors to capitalize on global gold price movements without taking physical ownership of the precious metal. Gate.com has introduced an exceptional opportunity for its users where they can not only engage in professional Gold CFD trading but also earn points through the Gate Card Points System on every eligible purchase, redeemable for valuable digital assets including BTC, ETH, USDT, and GT.
Fundamentals of Gold CFD Trading and Professional Perspective
Gold CFD, or Contract for Difference, is a derivative product that enables traders to speculate on gold price movements without owning the underlying physical asset. On Gate.com, XAUUSD trading pairs are pegged to international gold prices, providing professional traders with a transparent and efficient platform. Leverage plays a crucial role in Gold CFD trading, with ratios typically ranging from 1:10 to 1:50 available to qualified traders. For instance, if a trader utilizes 1:20 leverage and opens a 10,000 USD position on XAUUSD, only 500 USD in margin capital is required, amplifying both potential returns and risks proportionally.
Analytical Strategies and Technical Indicators
Professional gold traders employ multiple technical indicators for market analysis. The Relative Strength Index (RSI) operates within the 30 to 70 range, indicating oversold conditions below 30 and overbought conditions above 70. Moving Average Convergence Divergence (MACD) confirms trend direction through signal line crossovers. Bollinger Bands measure volatility, where prices extending beyond the upper band signal overbought conditions. Fibonacci retracement levels at 23.6 percent, 38.2 percent, 50 percent, 61.8 percent, and 78.6 percent establish critical support and resistance zones for entry and exit decisions.
Gate Card Points System: Rewards on Every Purchase
Gate.com has introduced the Gate Card Points System to reward users for their participation in the Gate ecosystem. Eligible purchases made with the Gate Card earn points at fixed rates based on card tier. These points can be redeemed for digital assets including BTC, ETH, USDT, and GT, with redeemed assets credited to designated accounts for subsequent trading, wealth management, or future spending. Points remain valid indefinitely, with additional redeemable assets and benefits continuously being introduced.
Cashback rates vary by card tier as follows: Tier T0 offers 1.00 percent cashback, Tier T1 provides 1.00 percent, Tier T2 delivers 2.00 percent, Tier T3 grants 3.00 percent, Tier T4 awards 5.00 percent, and Tier T5 delivers an impressive 8.00 percent cashback rate. Monthly points cashback limits range from 500 points for T0 (equivalent to up to 5 USDT), 5,000 points for T1 (up to 50 USDT), 10,000 points for T2 (up to 100 USDT), 15,000 points for T3 (up to 150 USDT), 25,000 points for T4 (up to 250 USDT), to 40,000 points for T5 (up to 400 USDT).
Single transaction points cashback limits are structured as: T0 allows up to 200 points per transaction, T1 permits 1,500 points, T2 allows 3,000 points, T3 permits 5,000 points, T4 allows 8,000 points, and T5 permits up to 15,000 points per transaction. These limits ensure high-volume traders can maximize their rewards while maintaining system sustainability.
Card Tier Progression Requirements
Card tier determination follows either Gate VIP level or monthly card spending, with the higher benefit applying. Tier T0 is available for VIP 0 through VIP 4 with zero minimum spending required. Tier T1 requires VIP 5 through VIP 7 or minimum monthly spending of 500 USD. Tier T2 necessitates VIP 8 status or 3,000 USD monthly spending. Tier T3 requires VIP 9 or 6,000 USD monthly expenditure. Tier T4 demands VIP 10 through VIP 12 or 10,000 USD monthly spending. Tier T5, the highest tier, requires VIP 13 through VIP 14 or 15,000 USD in monthly card spending. New tier benefits become effective the following calendar month and remain valid for the entire month.
Risk Management and Capital Protection
Risk management is paramount in Gold CFD trading. Professional traders typically risk no more than 1 to 2 percent of their total trading capital on any single position. Stop-loss orders are mandatory, commonly set at 2 to 3 percent loss limits. Take-profit levels are established at 1:2 or 1:3 risk-to-reward ratios to ensure profitable expectancy over time. Portfolio diversification remains essential, with no single asset exceeding 10 percent of total investment allocation. Position sizing calculations must account for leverage multipliers to prevent excessive exposure.
Market Factors and Fundamental Analysis
Multiple factors influence gold prices. The inverse correlation between the US dollar and gold means that dollar weakness typically drives gold prices higher. Federal Reserve interest rate policies significantly impact gold attractiveness, with lower rates increasing gold's appeal as a non-yielding asset. Geopolitical tensions and economic uncertainty increase demand for gold as a safe-haven asset. Inflation hedge characteristics make gold attractive during periods of monetary expansion. Gold prices demonstrated a remarkable 48 percent year-over-year increase as of October 2025, with continued upward momentum expected based on institutional investment flows and central bank purchasing patterns.
How to Trade Gold CFD on Gate.com
Access the Gate web platform and click on TradFi in the top navigation bar to proceed to the CFD trading page. Agree to the protocol terms and open a CFD trading account. Transfer funds to the CFD account using the Transfer button at the top of the interface. Select XAUUSD or other traditional asset trading pairs from the available options. Choose your trading side, either Buy (Long) for bullish positions or Sell (Short) for bearish positions. Enter your trading amount and place your order with appropriate risk parameters. Gate TradFi trading supports App version 8.4.0 and above for mobile access.
Additional Trading Instruments and Opportunities
Beyond gold, Gate.com offers additional traditional asset CFDs including Silver (XAGUSD), Platinum (XPTUSD), WTI Crude Oil (XTIUSD), and NASDAQ 100 Index (NAS100). This diversification allows traders to construct balanced portfolios across precious metals, energy commodities, and equity indices. Cross-asset correlations can be exploited for hedging strategies, particularly during periods of market stress when gold typically outperforms while equities decline.
Institutional Investment Perspective
Institutional investors maintain strategic allocations to gold and gold-related securities for portfolio resilience. Recent surveys indicate approximately 15 percent of institutional investors currently hold gold positions, representing significant growth potential as awareness increases. Gold serves as a long-duration hedge providing portfolio protection across various adverse circumstances including inflationary and deflationary environments, equity bear markets, and sharp near-term selloffs while supporting real purchasing power across market cycles.
Maximizing Gate Card Benefits for Traders
Active traders can optimize Gate Card usage by routing all trading-related expenses through the card to accumulate maximum points. Monthly spending of 15,000 USD achieves T5 status with 8.00 percent cashback, generating up to 400 USDT in monthly rewards. At T5 level, single transactions can earn up to 15,000 points, making large purchases highly rewarding. Points can be strategically redeemed during favorable market conditions to maximize digital asset accumulation. The ability to redeem points for BTC, ETH, USDT, and GT provides flexibility for traders to align rewards with their investment strategies.
Conclusion
Gold CFD trading represents an exceptional opportunity for professional traders and institutional investors seeking exposure to precious metal price movements. Gate.com's Gate Card Points System enhances this opportunity significantly, allowing users to earn rewards not only from trading profits but also from every eligible purchase through the card. Cashback rates reaching 8.00 percent and monthly rewards up to 400 USDT make Gate.com an ideal platform for Gold CFD trading. The combination of professional-grade trading infrastructure, comprehensive risk management tools, and innovative rewards programs positions Gate.com as a leading destination for sophisticated traders seeking to maximize both trading performance and ancillary benefits.
  • Reward
  • Comment
  • Repost
  • Share
#MyGateTradeStory I never thought I would reach a point where I could call myself a trader. If someone told me this journey would change my mindset, my discipline, and even my way of seeing life, I would have probably laughed at it.
There was a time when trading felt like something only “lucky people” or financially strong people could do. Honestly, I didn’t even have the confidence to believe I could enter this world. I didn’t have enough capital, I didn’t have perfect knowledge, and I definitely didn’t have certainty. All I had was curiosity… and a small spark inside me that kept asking: “Wh
CryptoNova
#MyGateTradeStory I never thought I would reach a point where I could call myself a trader. If someone told me this journey would change my mindset, my discipline, and even my way of seeing life, I would have probably laughed at it.
There was a time when trading felt like something only “lucky people” or financially strong people could do. Honestly, I didn’t even have the confidence to believe I could enter this world. I didn’t have enough capital, I didn’t have perfect knowledge, and I definitely didn’t have certainty. All I had was curiosity… and a small spark inside me that kept asking: “What if you can?”
But doubts were louder than hope.
I remember starting with almost nothing. Every small move in the market felt huge to me. Every loss felt personal, like I had lost a part of myself. I fluctuated between motivation and fear. Some days I felt like I was built for this, and other days I felt like I should just stop and walk away before losing more.
There were moments I questioned myself deeply. Am I even made for trading? Is this just a dream that people talk about but never actually achieve? Why does it feel so hard when others make it look so easy?
But then something changed.
I came across Eagle Eye and Dragonfly Official.
And I don’t say this lightly—this changed everything for me.
The way they explained the market, the way they shared insights, the way they made complex things feel simple… it gave me something I didn’t have before: belief. Not blind belief, but grounded understanding. For the first time, I felt like I wasn’t just guessing in the market. I felt like I was learning its language.
Slowly, I started to understand that trading is not about luck. It is about patience. It is about discipline. It is about surviving your own emotions more than surviving the market.
There were still losses. There were still moments of confusion. But something inside me had shifted. I stopped chasing quick success and started respecting the process. I started learning from every mistake instead of breaking down from it.
And little by little, I grew.
Not just in profit—but in mindset.
I learned that trading is not a straight road. It is full of ups and downs, emotional breakdowns, silent victories, and personal battles that nobody sees. And in all of this, the biggest enemy was never the market—it was my own fear and impatience.
Today, I don’t claim to be perfect. I am still learning, still evolving, still fighting to become better every single day. But I can say one thing with confidence: I am no longer the same person who started this journey.
Now I understand why people say trading changes you. It doesn’t just change your income—it changes your thinking, your discipline, your mindset, and your patience with life itself.
I want to sincerely thank Eagle Eye and Dragonfly Official for being part of this journey. Your guidance helped me believe that this path is real, and that even someone like me, starting from uncertainty, can grow step by step.
This is not just a trading story.
This is a story of belief built from nothing.
A story of falling, learning, rising, and continuing.
And I am still writing it… one trade at a time.
repost-content-media
  • Reward
  • Comment
  • Repost
  • Share
  • Pinned