TheCryptoStrategist

vip
Age 0.1 Year
Peak Tier 5
No content yet
Pin
#我的Gate交易时刻
The One GT Trade That Completely Changed My Investment Mindset
A Trade That Became a Turning Point in My Journey
Every investor has a moment that changes the way they see the market forever.
For me, that moment came through a single GT trade.
It was not the largest position I had ever taken, nor was it the fastest profit I had ever seen. Yet it became the most important trade of my entire investment journey because it taught me lessons that no chart, indicator, or market commentary could ever teach.
Before that trade, I was focused primarily on short-term price movements. Like man
GT-0.88%
post-image
post-image
  • Reward
  • 12
  • 5
  • Share
BullishBella:
To The Moon 🌕
View More
#AnthropicTapsSamsungForAIchips
The artificial intelligence landscape is witnessing a significant transformation as Anthropic, the company behind the Claude family of AI models, enters into preliminary discussions with Samsung Electronics to develop custom AI accelerator chips. This strategic partnership represents one of the most consequential developments in the AI semiconductor industry, valued at approximately $965 billion, and signals a broader industry shift toward reducing dependence on Nvidia's dominant GPU architecture.
The Genesis of the Partnership
The discussions between Anthropic
MuhammadAhmad
#AnthropicTapsSamsungForAIchips
The artificial intelligence landscape is witnessing a significant transformation as Anthropic, the company behind the Claude family of AI models, enters into preliminary discussions with Samsung Electronics to develop custom AI accelerator chips. This strategic partnership represents one of the most consequential developments in the AI semiconductor industry, valued at approximately $965 billion, and signals a broader industry shift toward reducing dependence on Nvidia's dominant GPU architecture.
The Genesis of the Partnership
The discussions between Anthropic and Samsung center on leveraging Samsung's cutting-edge 2-nanometer manufacturing process and advanced packaging technologies. This process node represents the pinnacle of semiconductor fabrication technology, offering approximately 45% higher chip density and 25% improved power efficiency compared to previous generations. Samsung previously utilized this same 2nm process to manufacture Tesla's AI chips, demonstrating the technology's capability to handle demanding AI workloads at scale.
The partnership's foundation was established during Anthropic's Series H funding round in May 2025, when Samsung Electronics, SK Hynix, and Micron were designated as strategic infrastructure partners. Anthropic explicitly acknowledged that these companies' technologies play critical roles in supplying memory, storage devices, and logic chips globally. Samsung's unique position as the only memory manufacturer among the three with an active foundry business positioned it as the logical choice for chip fabrication.
Strategic Rationale and Industry Context
The motivation behind Anthropic's custom chip initiative aligns with a broader industry trend among leading AI laboratories. OpenAI, Anthropic's primary competitor, unveiled its Broadcom-designed inference accelerator codenamed Jalapeño on June 24, 2026, demonstrating the industry's collective movement toward hardware independence. This trend reflects growing concerns about supply chain vulnerabilities, escalating compute costs, and the strategic necessity of controlling core infrastructure.
Nvidia currently commands approximately 80% of the AI accelerator market, creating a single-point-of-failure risk for AI companies dependent on its GPUs. The cost implications are substantial: training large language models can require expenditures exceeding $100 million per training run, with inference costs scaling proportionally with user adoption. Custom silicon offers the potential to reduce these costs by 30% to 50% while simultaneously improving performance through architecture optimization.
Technical Specifications and Development Status
The discussions remain in early stages, with no finalized design specifications, target workloads, or performance benchmarks established. Anthropic has recruited Jonathan Chan, who spent two and a half years at OpenAI building the Jalapeño inference accelerator, to lead the hardware engineering efforts. Chan's expertise in designing AI accelerators from the software layer upward provides Anthropic with institutional knowledge critical for successful chip development.
The proposed chip architecture focuses specifically on inference workloads optimized for the Claude model family. Unlike general-purpose GPUs, custom accelerators can implement specialized tensor operations, memory hierarchies, and data movement patterns tailored to transformer-based language models. This specialization can yield performance improvements of 2x to 5x compared to commodity hardware for specific workloads.
Samsung's Strategic Position
For Samsung Electronics, securing Anthropic as a foundry client represents a potential inflection point for its semiconductor business. Samsung's foundry division has historically struggled to compete with Taiwan Semiconductor Manufacturing Company's market leadership, capturing approximately 15% of the global foundry market compared to TSMC's 60% share. A partnership with Anthropic would validate Samsung's 2nm process technology and potentially attract additional AI chip customers.
Samsung has committed substantial resources to AI semiconductor development, including a reported $646 billion investment over ten years focused on chips and AI data centers. The company's existing relationships with Nvidia as a manufacturing partner for AI training chips provide valuable experience in high-volume AI chip production. Additionally, Samsung's integrated memory and logic capabilities enable advanced packaging solutions combining high-bandwidth memory with AI accelerators, a configuration increasingly favored for large language model inference.
Market Implications and Competitive Dynamics
The announcement has already influenced Korean equity markets, with Samsung Electronics and SK Hynix shares experiencing upward movement following the reports. Market analysts estimate that custom AI silicon could represent a $50 billion addressable market by 2030, with AI companies increasingly prioritizing hardware diversification.
The competitive implications extend beyond cost reduction. Custom chips enable AI laboratories to differentiate their offerings through unique hardware-software optimizations, potentially creating sustainable competitive advantages. Companies controlling their silicon roadmap can implement architectural innovations months or years before they become available in commodity hardware, accelerating model development cycles.
Anthropic's Multi-Vendor Strategy
Despite the Samsung discussions, Anthropic maintains that its computing strategy will continue incorporating hardware from Google, Amazon, and Nvidia. This diversified approach mitigates supply chain risks while preserving flexibility to deploy workloads across different hardware platforms based on cost-performance optimization. The company has emphasized that custom silicon development complements rather than replaces existing vendor relationships.
The strategic partnership with Samsung reflects Anthropic's $18 billion valuation and its position as the world's most valuable privately held AI startup. With backing from Amazon, which has invested approximately $4 billion in the company, Anthropic possesses the financial resources necessary for the multi-year, multi-billion-dollar investment required for custom chip development.
Future Outlook and Challenges
Several challenges remain before Anthropic's custom silicon becomes production-ready. Semiconductor design cycles typically span 18 to 36 months from initial specification to volume manufacturing. The company must finalize architectural decisions, complete tape-out, validate designs through simulation and prototyping, and establish manufacturing capacity commitments with Samsung.
Additionally, the AI chip market faces intensifying competition from established players and new entrants. Google's TPU, Amazon's Trainium and Inferentia, and Microsoft's Maia chips demonstrate that vertical integration is becoming standard practice among hyperscalers. Anthropic's partnership with Samsung positions it to compete effectively in this evolving landscape.
The collaboration between Anthropic and Samsung represents more than a simple manufacturing agreement; it embodies the strategic realignment occurring throughout the AI industry. As model capabilities advance and computational requirements grow exponentially, control over silicon has emerged as a critical determinant of competitive positioning. This partnership signals Anthropic's commitment to building the infrastructure necessary for sustained leadership in artificial intelligence development.@Gate_Square

repost-content-media
  • Reward
  • Comment
  • Repost
  • Share
#OUSDStablecoinLaunch
The cryptocurrency landscape has witnessed a monumental development with the official launch of Open USD (OUSD), a groundbreaking stablecoin initiative backed by over 140 of the world's most influential financial institutions, technology giants, and blockchain innovators. This comprehensive analysis explores every aspect of OUSD, from its institutional backing and unique revenue-sharing model to the diverse opportunities it presents for investors, traders, and everyday users seeking to participate in the future of digital finance exclusively through Gate.com.
Understandi
MuhammadAhmad
#OUSDStablecoinLaunch
The cryptocurrency landscape has witnessed a monumental development with the official launch of Open USD (OUSD), a groundbreaking stablecoin initiative backed by over 140 of the world's most influential financial institutions, technology giants, and blockchain innovators. This comprehensive analysis explores every aspect of OUSD, from its institutional backing and unique revenue-sharing model to the diverse opportunities it presents for investors, traders, and everyday users seeking to participate in the future of digital finance exclusively through Gate.com.
Understanding the Open Standard Consortium and Its Vision
Open USD represents far more than a typical stablecoin launch; it embodies a paradigm shift in how digital currencies are structured, governed, and distributed. The Open Standard consortium brings together an unprecedented coalition of industry leaders including Visa, Mastercard, American Express, BlackRock, Stripe, Coinbase, Google, Shopify, IBM, BNY Mellon, Standard Chartered, U.S. Bank, BBVA, MetaMask, Ripple, and Galaxy Digital. This diverse assembly of payment networks, institutional asset managers, technology firms, and cryptocurrency exchanges signals a fundamental transformation in the stablecoin ecosystem.
The consortium's founding CEO, Zach Abrams, who previously led product development at Coinbase, articulates the vision clearly: Open USD is built specifically for the internet economy and designed by the businesses that are actively growing it. Unlike traditional stablecoins where a single issuer maintains centralized control, OUSD operates under a shared governance model where participating companies collectively manage the stablecoin's development, integration, and distribution.
The Revolutionary Revenue-Sharing Mechanism
Perhaps the most distinctive feature of Open USD is its innovative approach to reserve revenue distribution. Traditional stablecoin issuers typically retain 100% of the interest generated from underlying reserves, which consist primarily of short-term U.S. Treasuries and cash equivalents yielding approximately 4.5% to 5.5% annually. OUSD fundamentally disrupts this model by distributing the majority of reserve earnings back to the businesses that mint, hold, and route the token.
Under the OUSD framework, companies joining Open Standard can mint and redeem Open USD without incurring fees or facing volume limitations. After deducting a modest management fee estimated between 0.15% and 0.25%, the substantial income generated from OUSD's reserves is shared among participating businesses based on their adoption and usage metrics. This creates a powerful incentive structure where ecosystem participants are financially rewarded for driving OUSD adoption rather than merely serving as passive infrastructure providers.
Will Gaybrick, President of Technology and Business at Stripe, has explicitly stated that Open USD will become the default stablecoin for businesses operating on the Stripe platform. This commitment from one of the world's largest payment processors demonstrates the practical integration potential that OUSD offers to merchants and service providers globally.
Technical Architecture and Blockchain Integration
Open USD has been designed with multi-chain compatibility from its inception. Solana serves as the first blockchain where OUSD trades natively, with Tempo confirming that OUSD will be natively issued on the Tempo network from day one. This native issuance approach ensures deep liquidity, efficient settlement, and seamless integration with decentralized finance protocols, payment systems, and exchange infrastructure.
The technical design prioritizes interoperability, enabling OUSD to function across multiple blockchain networks while maintaining consistent value pegging to the U.S. dollar. Users can expect support for payments, liquidity provision, trading on exchanges, and various DeFi applications. The consortium has committed to providing comprehensive technical and integration support to all participating businesses, reducing the friction typically associated with stablecoin adoption.
Market Position and Competitive Landscape
Open USD enters a stablecoin market dominated by two major incumbents: Tether's USDT, which maintains a market capitalization exceeding $140 billion, and Circle's USDC, with approximately $73.4 billion in circulation. Together, these two stablecoins account for over 85% of stablecoin trading volume and liquidity across global cryptocurrency markets.
The OUSD launch has already generated significant market reaction, with Circle's stock experiencing a 5% decline following the announcement of the Open Standard consortium. This market response reflects investor recognition that OUSD's revenue-sharing model and institutional backing pose a credible challenge to the established stablecoin duopoly. By aligning the financial interests of stablecoin users with those of the infrastructure providers, OUSD creates a more sustainable and equitable ecosystem that could attract substantial market share from competitors.
Investment and Trading Opportunities on Gate.com
For investors, traders, and cryptocurrency enthusiasts, the OUSD launch opens numerous avenues for participation and profit. Gate.com, as a leading global cryptocurrency exchange, provides comprehensive infrastructure for users to engage with OUSD through multiple strategies.
Spot trading represents the most straightforward entry point, allowing users to buy and sell OUSD against major cryptocurrencies like Bitcoin and Ethereum or against other stablecoins. The deep liquidity provided by the Open Standard consortium ensures tight spreads and efficient price discovery, making OUSD suitable for both retail traders and institutional participants.
Staking opportunities present another compelling avenue for OUSD holders. While specific staking parameters and annual percentage yields will be established based on market conditions and protocol governance, users can anticipate competitive returns reflecting the underlying yield generated by OUSD's reserve assets. The revenue-sharing mechanism that benefits Open Standard partners ultimately derives from the same reserve yields that can be distributed to individual stakers, creating alignment between institutional and retail participants.
Strategic Advantages for Different User Categories
Retail investors benefit from OUSD's stability, liquidity, and potential yield generation without the complexity of managing underlying DeFi protocols. The institutional backing provides confidence in the stablecoin's solvency and regulatory compliance, addressing common concerns about smaller or less transparent stablecoin projects.
Active traders can utilize OUSD as a stable store of value during market volatility, quickly rotating between risk assets and stable holdings without needing to exit to fiat currencies. The zero-fee minting and redemption structure for Open Standard participants suggests that trading costs may be highly competitive compared to traditional stablecoin pairs.
Merchants and businesses gain access to a payment infrastructure that integrates seamlessly with existing financial systems while offering the speed, efficiency, and borderless nature of blockchain-based transactions. The revenue-sharing component provides an additional income stream based on transaction volume and adoption.
Risk Considerations and Market Dynamics
While OUSD presents substantial opportunities, prudent investors should consider several risk factors. As a newly launched stablecoin, OUSD will need to demonstrate sustained peg stability during periods of market stress. The multi-party governance structure, while promoting decentralization, may introduce coordination challenges that could affect decision-making speed.
Regulatory developments remain a consideration for all stablecoins, though the involvement of major regulated financial institutions suggests that OUSD is being designed with compliance frameworks in mind. The consortium's approach to reserve management, transparency, and auditing will be critical factors in establishing long-term trust and adoption.
The Broader Implications for Digital Finance
The OUSD launch represents a significant milestone in the maturation of cryptocurrency markets. By bringing together traditional finance giants like BlackRock and Visa with crypto-native companies like Coinbase and MetaMask, Open Standard bridges the gap between conventional financial infrastructure and blockchain-based innovation.
This convergence suggests a future where stablecoins serve as the primary interface between traditional and digital economies, with OUSD potentially establishing the template for how major financial instruments are issued, governed, and distributed in the blockchain era. The revenue-sharing model could become a standard feature of future stablecoin designs, fundamentally reshaping the economics of digital currency issuance.
**Conclusion: Participating in the OUSD Ecosystem on Gate.com**
Open USD stands as one of the most significant stablecoin launches in cryptocurrency history, backed by unprecedented institutional support and introducing innovative economic mechanisms that benefit all participants. For users on Gate.com, the availability of OUSD trading, staking, and investment products provides immediate access to this next-generation financial instrument.
Whether you are a long-term investor seeking stable yield, an active trader requiring efficient stablecoin liquidity, or a business exploring blockchain-based payment solutions, OUSD offers compelling advantages over existing alternatives. The combination of zero-fee minting, revenue sharing, multi-chain compatibility, and world-class institutional backing positions Open USD as a transformative force in the evolving landscape of digital finance.
As the Open Standard ecosystem expands and matures, early participants stand to benefit from both the immediate utility of a superior stablecoin and the long-term growth of a financial infrastructure designed specifically for the internet economy. The future of money is being built today, and Open USD represents a foundational element of that future, now available for trading, staking, and investment exclusively on Gate.com.@Gate_Square
repost-content-media
  • Reward
  • Comment
  • Repost
  • Share
#TradFiCFDGoldMasters
Gate.com has launched an exceptional trading event that brings together the world of traditional finance and digital asset rewards. The TradFi CFD Gold Masters tournament is designed for traders, investors, and all users who want to maximize their earning potential through strategic trading across multiple asset classes. This comprehensive guide will walk you through every aspect of this remarkable opportunity.
Understanding the Event Structure and Prize Pool
The TradFi CFD Gold Masters event features a tiered prize pool system that can reach up to 500,000 USDT based on
MuhammadAhmad
#TradFiCFDGoldMasters
Gate.com has launched an exceptional trading event that brings together the world of traditional finance and digital asset rewards. The TradFi CFD Gold Masters tournament is designed for traders, investors, and all users who want to maximize their earning potential through strategic trading across multiple asset classes. This comprehensive guide will walk you through every aspect of this remarkable opportunity.
Understanding the Event Structure and Prize Pool
The TradFi CFD Gold Masters event features a tiered prize pool system that can reach up to 500,000 USDT based on collective trading volume. The prize pool unlocks progressively as the community achieves specific trading milestones. At the 0 USDx baseline, the prize pool starts at 5,000 USDT. When total trading volume reaches 10 billion USDx, the pool increases to 10,000 USDT. At 20 billion USDx, participants unlock 18,000 USDT. The 100 billion USDx milestone unlocks 30,000 USDT, while 500 billion USDx unlocks 120,000 USDT. The maximum prize pool of 500,000 USDT is achieved when total trading volume reaches 1 trillion USDx.
Currently, the event has achieved 61% progress with over 121 billion USDx in total trading volume, unlocking 30,000 USDT in the prize pool. More than 50,408 participants have joined this competition, creating an active and competitive trading environment.
The Five Major Asset Classes Available for Trading
The event covers five comprehensive asset categories, giving participants diverse trading opportunities. The Metals Section includes XAUUSD (Gold), XAGUSD (Silver), and XAUEUR, allowing traders to capitalize on precious metal price movements. The Commodities Section features XTIUSD (Oil), XBRUSD (Brent Oil), and NG (Natural Gas), providing exposure to energy markets. The Forex Section includes major currency pairs such as EURUSD, USDCNH, and GBPUSD, enabling traders to profit from currency fluctuations. The Stocks Section covers major equities like TSLAX (Tesla), NVDAX (NVIDIA), and AAPLX (Apple), offering access to leading technology and growth companies. The Indices Section includes NAS100 (NASDAQ), GER40 (German DAX), and HK50 (Hang Seng), allowing traders to speculate on broader market movements.
Leaderboard Rewards Distribution
Seventy percent of the total prize pool is allocated to the leaderboard rewards, which means up to 350,000 USDT can be distributed among top performers. The current unlocked leaderboard pool stands at 21,000 USDT. The top three traders on the leaderboard demonstrate exceptional trading volume, with the first-place trader achieving over 3.6 billion USDx in CFD trading volume, earning an estimated reward of 3,780 USDT. The second-place trader has generated over 2.2 billion USDx in volume with an estimated reward of 2,520 USDT. The third-place trader has accumulated over 2.1 billion USDx in volume, earning approximately 2,100 USDT.
Traders ranked from fourth to tenth position each earn 600 USDT in estimated rewards, demonstrating that substantial prizes are available beyond just the top three positions. The leaderboard updates every 15 minutes, ensuring real-time competition visibility.
Gold Lucky Bag Draws: Hourly Opportunities to Win Physical Gold
One of the most exciting features of this event is the Gold Lucky Bag system, which distributes a total of 1,020 grams of gold throughout the event period. This gold allocation is separate from the tiered USDT prize pool and provides additional winning opportunities. The Standard Session offers 720 grams of gold through hourly draws, with one winner selected each hour from all eligible participants. Each standard draw awards 1 gram of gold to the lucky winner.
For VIP 5 and above members, an exclusive VIP 5 Plus Session provides an additional 300 grams of gold. Each VIP exclusive draw awards 5 grams of gold per winner. Draws are held every hour throughout the event, with 720 total draws per month in the standard session.
How to Earn Draw Entries
Participants can earn entries into the Gold Lucky Bag draws by completing specific trading tasks. For the Standard Draw, traders earn one entry for every 1,000 USDx in single-hour TradFi CFD volume, with up to 24 entries available daily. Additionally, traders receive one entry for every 50,000 USDx in daily TradFi CFD volume, with up to 5 entries available per day.
VIP 5 Plus members enjoy exclusive draw tasks with enhanced rewards. After upgrading to VIP 5 Plus status (experience cards excluded), the exclusive tasks take effect the next day at 00:00 UTC, and entries are claimed automatically.
XAUT Rewards: Digital Gold Backed by Physical Assets
Rewards from the Gold Lucky Bag are distributed in XAUT (Tether Gold), a digital asset pegged 1:1 to physical gold. XAUT represents ownership of real gold stored in secure vaults, combining the stability of precious metals with the flexibility of digital assets. Winners must manually claim their rewards by clicking the Claim Now button within 24 hours of winning. Rewards are distributed within 14 business days after the event concludes.
Registration and Participation Requirements
To participate in the TradFi CFD Gold Masters event, users must register by clicking the Register Now button on the event page. After registration, participants can trade any CFD asset from the available categories including metals, forex, commodities, stocks, or indices. All trading volume contributes to both the collective prize pool unlocking and individual leaderboard rankings.
It is important to note that certain account types are not eligible for this event. API users, VIP 14 Plus members, market makers, corporate accounts, institutional accounts, and sub-accounts cannot participate. Additionally, Gate CFD services may be restricted or unavailable in certain regions, and users in the United Kingdom and other restricted regions may not access all or part of these services.
Understanding CFD Trading on Gate
Contract for Difference (CFD) trading allows participants to speculate on price movements without owning the underlying asset. When trading XAUUSD (Gold), for example, traders can profit from both rising and falling prices by taking long (buy) or short (sell) positions. Gate TradFi offers leverage options that amplify trading power, though traders should exercise caution and implement proper risk management strategies.
The platform provides transparent cost structures including trading commissions, overnight financing fees, and spreads. Stop-loss and take-profit mechanisms are available to help traders manage risk and protect their positions from adverse market movements.
Gate Card Points System Integration
The Gate ecosystem rewards users beyond trading competitions through the Gate Card Points System. Eligible purchases made with the Gate Card earn points that can be redeemed for various digital assets including BTC, ETH, USDT, and GT. Points can also unlock additional benefits such as fee discounts, exclusive rewards, and privileges within the Gate ecosystem.
The Gate Card Exclusive Rewards promotion offers additional incentives including DragonPass Airport Lounge Access passes valid across more than 1,700 airport lounges globally, and TradingView Essential Membership providing advanced charting tools, technical indicators, smart price alerts, and ad-free market analysis across cryptocurrencies, US equities, forex, and more.
Strategic Considerations for Maximizing Rewards
To maximize potential rewards in the TradFi CFD Gold Masters event, participants should consider several strategic approaches. Consistent trading activity throughout the event period increases chances of earning draw entries and accumulating volume for leaderboard rankings. Diversifying across multiple asset classes can help manage risk while maintaining active trading volume. Monitoring the leaderboard updates every 15 minutes allows traders to gauge their competitive position and adjust strategies accordingly.
For those aiming for VIP 5 Plus exclusive draws, upgrading membership status can significantly increase gold winning potential with 5 gram prizes compared to 1 gram in standard draws. Setting appropriate stop-loss and take-profit levels helps protect capital while pursuing volume targets.
Event Integrity and Fair Play
Gate maintains strict policies to ensure fair competition. The platform reserves the right to disqualify any user found cheating, including wash trading, matched orders, self-dealing, market manipulation, or bulk account registration. Sub-accounts, master accounts, and multiple accounts under the same identity are treated as one participant. Sub-account volume does not count toward the main account, and sub-accounts are not eligible to participate independently.
Conclusion
The Gate TradFi CFD Gold Masters event represents a significant opportunity for traders to engage with traditional financial markets while earning substantial digital asset rewards. With a maximum prize pool of 500,000 USDT, 1,020 grams of gold distributed through hourly draws, and competitive leaderboard rewards, this event offers multiple pathways to profitability.
Whether you are an experienced CFD trader or new to traditional finance markets, the event provides accessible entry points through diverse asset classes and clear participation rules. By combining strategic trading with consistent activity, participants can maximize their chances of winning both USDT prizes and physical gold-backed XAUT tokens.
Register now at Gate.com to join over 50,000 participants in this exciting trading competition. Trade CFDs across metals, forex, commodities, stocks, and indices to unlock your share of the 500,000 USDT prize pool and enter hourly draws for 1,020 grams of gold rewards.@Gate_Square
repost-content-media
  • Reward
  • Comment
  • Repost
  • Share
#TradFiCFDGoldMasters
Gate.com has launched an exceptional trading event that brings together the world of traditional finance and digital asset rewards. The TradFi CFD Gold Masters tournament is designed for traders, investors, and all users who want to maximize their earning potential through strategic trading across multiple asset classes. This comprehensive guide will walk you through every aspect of this remarkable opportunity.
Understanding the Event Structure and Prize Pool
The TradFi CFD Gold Masters event features a tiered prize pool system that can reach up to 500,000 USDT based on
  • Reward
  • Comment
  • Repost
  • Share
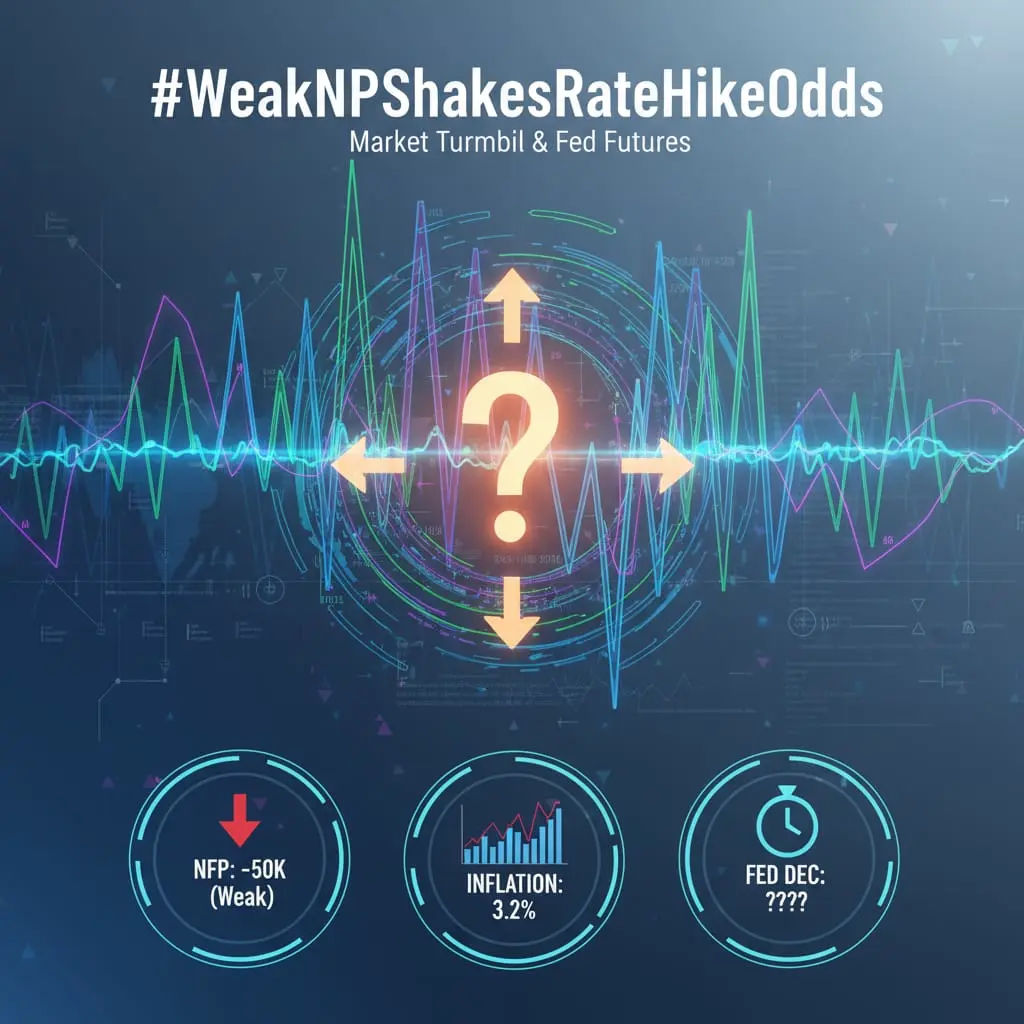
#WeakNFPShakesRateHikeOdds
Weak NFP Report Shakes Rate Hike Odds, Crypto Markets Respond Positively
The latest Non-Farm Payrolls (NFP) report from the United States has come in weaker than expected, significantly shaking the odds of a Federal Reserve rate hike and triggering a positive response across cryptocurrency markets. The NFP report, which tracks monthly employment data excluding the agricultural sector, serves as one of the most critical indicators of American economic health. When this report underperforms relative to market expectations, it weakens the probability of the central ban
MuhammadAhmad
#WeakNFPShakesRateHikeOdds
Weak NFP Report Shakes Rate Hike Odds, Crypto Markets Respond Positively
The latest Non-Farm Payrolls (NFP) report from the United States has come in weaker than expected, significantly shaking the odds of a Federal Reserve rate hike and triggering a positive response across cryptocurrency markets. The NFP report, which tracks monthly employment data excluding the agricultural sector, serves as one of the most critical indicators of American economic health. When this report underperforms relative to market expectations, it weakens the probability of the central bank raising interest rates, creating a more favorable environment for risk assets including Bitcoin and other cryptocurrencies.
According to recent market data, Bitcoin is currently trading at approximately 62,650 dollars, marking a substantial recovery with gains of 1.4 percent over the past twenty-four hours and 3.6 percent over the week. Bitcoin has successfully breached the 63,000 dollar level, reaching its highest price point in over two weeks and completely reversing the losses that closed out June. This represents a significant technical breakthrough for the leading cryptocurrency, with the price action indicating renewed buying interest from both retail and institutional participants.
Ethereum has demonstrated even stronger momentum, currently trading at 1,760 dollars with an impressive weekly gain of 12.6 percent. The second-largest cryptocurrency by market capitalization has printed a daily TBT Bullish Divergence and closed inside the daily TBO Cloud for the first time since falling below it on May 15, confirming a bullish OBV cross above its moving average line. These technical indicators suggest that Ethereum may be establishing a more sustainable upward trend after weeks of consolidation and downward pressure.
Solana maintains stability around the 80 dollar level, while XRP has emerged as one of the strongest performers among major cryptocurrencies, currently trading at 1.15 dollars with a 5.3 percent daily increase and nearly 10 percent weekly gains. This price appreciation has elevated XRP's market capitalization to approximately 73 billion dollars, allowing it to surpass the USDC stablecoin and reclaim the fifth position by market value. HYPE is trading at 68 dollars, and Dogecoin holds steady at 0.0078 dollars.
Gold prices stand at 4,160 dollars per ounce, reflecting the broader macroeconomic uncertainty and safe-haven demand that often accompanies weak employment data. The relationship between gold and cryptocurrency markets has become increasingly correlated as both asset classes respond to Federal Reserve policy expectations and dollar strength dynamics.
The weak American employment figures have substantially reduced expectations for Federal Reserve rate hikes, with the CME FedWatch Tool indicating that the probability of a rate cut in September 2026 has increased to 65 percent, up from 45 percent before the NFP report release. December 2026 shows an 80 percent probability of additional rate cuts. This shift in monetary policy expectations has weakened the US dollar while providing tailwinds for cryptocurrency valuations.
Institutional flows have responded positively to the changing macroeconomic landscape. United States spot Bitcoin ETFs recorded inflows of 222 million dollars on Thursday, breaking a painful ten-day outflow streak that had seen approximately 2.4 billion dollars in redemptions during June. This return of institutional capital represents an early signal that dip buyers are stepping back into the market, potentially marking the beginning of a more sustained recovery phase.
Market structure data reveals important insights about current trading conditions. The top ten spot centralized exchanges recorded 2.7 trillion dollars in trading volume during the first quarter of 2026, down from 4.5 trillion dollars in the fourth quarter of 2025. However, derivatives volume reached 85.3 trillion dollars traded on perpetual centralized exchanges in 2025, demonstrating that derivatives continue to dominate overall cryptocurrency trading activity. This concentration in derivatives suggests that sophisticated traders remain active despite spot market volume contraction.
USDT maintains its dominance in the stablecoin market with a 59.2 percent market share and accounts for 73.6 percent of centralized exchange trading volume. This concentration of liquidity in a single stablecoin highlights the importance of Tether in maintaining market stability and facilitating price discovery across cryptocurrency markets.
Bitcoin's market capitalization stands at 1.261 trillion dollars, representing 56.5 percent of the total cryptocurrency market capitalization. Ethereum follows with 213 billion dollars, accounting for 9.57 percent of the total market. The overall cryptocurrency market capitalization currently sits at 2.234 trillion dollars, having increased by 0.1 percent over the past twenty-four hours. Bitcoin's twenty-four-hour trading volume reaches 18.8 billion dollars, while Ethereum processes 7.7 billion dollars in daily volume.
Technical analysis suggests improving market conditions across major cryptocurrencies. Bitcoin has printed a daily TBT Bullish Divergence and tagged the daily TBO Fast line near 62,000 dollars, representing meaningful improvement after weeks of pressure. The On-Balance Volume indicator is approaching a bullish cross above its moving average line, which could develop this week if buyers continue following through on current momentum.
Stablecoin dominance is weakening, which typically proves bullish for Bitcoin and alternative cryptocurrencies as capital rotates out of safety and back into risk assets. The total cryptocurrency market breadth is improving, with RSI putting in higher lows while OBV pushes above its moving average line for the first time since May 25. These technical developments suggest that the market may be transitioning from a bearish to a more constructive phase.
The macroeconomic implications of weak NFP data extend beyond immediate price movements. Lower employment growth signals potential economic slowdown, which typically forces central banks to maintain accommodative monetary policy for longer periods. Extended periods of low interest rates reduce the opportunity cost of holding non-yielding assets like Bitcoin and gold, while simultaneously increasing the money supply through quantitative easing measures that historically correlate with cryptocurrency price appreciation.
Market participants should monitor several key factors in the coming weeks. The Federal Reserve's next policy statement will provide crucial guidance about the central bank's reaction function to weakening employment data. Continued ETF inflows would confirm institutional confidence in the recovery narrative. Technical resistance levels for Bitcoin include the 65,000 dollar zone, while Ethereum faces resistance near 1,850 dollars. Support levels for Bitcoin remain intact at 60,000 dollars, with Ethereum finding buyers around 1,650 dollars.
The correlation between cryptocurrency markets and traditional risk assets has remained elevated, meaning that broader equity market movements will likely influence digital asset prices. However, the unique supply dynamics of Bitcoin, including the recent halving event that reduced block rewards to 3.125 BTC, provide fundamental support independent of macroeconomic factors.
Trading volumes across major exchanges suggest that liquidity conditions have improved modestly, though spot volumes remain below the elevated levels seen during the first quarter of 2026. Market depth indicators show adequate support for current price levels, with order book analysis revealing strong buying interest between 60,000 and 62,000 dollars for Bitcoin.
The broader altcoin market has participated in the recovery, with the total altcoin market capitalization excluding Bitcoin and Ethereum showing gains of approximately 3.2 percent over the week. This broadening of the rally suggests improving risk appetite among cryptocurrency investors, who often rotate from large-cap assets into smaller tokens during bullish phases.
Regulatory developments continue to influence market sentiment, with recent clarity around exchange operations and custody solutions providing additional confidence for institutional participants. The European Union's Markets in Crypto-Assets framework and similar regulatory developments in Asia-Pacific regions are creating more standardized operating environments for cryptocurrency businesses.
In conclusion, the weak NFP report has fundamentally altered market expectations for Federal Reserve policy, reducing rate hike odds and creating a more favorable environment for cryptocurrency investments. Bitcoin's recovery above 63,000 dollars, Ethereum's 12.6 percent weekly gain, and XRP's 10 percent appreciation demonstrate broad-based market strength. Institutional flows returning through ETF channels, combined with improving technical indicators and weakening stablecoin dominance, suggest that the cryptocurrency market may be entering a more constructive phase. However, traders should remain vigilant regarding macroeconomic developments, Federal Reserve communications, and technical resistance levels that could determine whether this recovery extends into a more sustained bull market phase or encounters renewed selling pressure near previous highs.@Gate_Square
repost-content-media
  • Reward
  • Comment
  • Repost
  • Share
#PredictWorldCup🇧🇷vs🇳🇴
PredictWorldCup Brazil vs Norway
Brazil will win this Round of 16 match against Norway at the 2026 World Cup, but expect a competitive game with goals at both ends. My prediction is Brazil to win 2-1.
Brazil enters this knockout stage as clear favorites with a well-balanced squad and world-class attacking talent. Their forward line features Vinicius Junior, Neymar, and Endrick, players who can trouble any defense in the world. Vinicius Junior has already scored 4 goals in this tournament with an xG of 2.58, demonstrating his clinical finishing. Brazil has scored in
MuhammadAhmad
#PredictWorldCup🇧🇷vs🇳🇴
PredictWorldCup Brazil vs Norway
Brazil will win this Round of 16 match against Norway at the 2026 World Cup, but expect a competitive game with goals at both ends. My prediction is Brazil to win 2-1.
Brazil enters this knockout stage as clear favorites with a well-balanced squad and world-class attacking talent. Their forward line features Vinicius Junior, Neymar, and Endrick, players who can trouble any defense in the world. Vinicius Junior has already scored 4 goals in this tournament with an xG of 2.58, demonstrating his clinical finishing. Brazil has scored in every match so far and holds a goal differential of plus 7, showcasing their offensive strength. However, Brazil faces some injury concerns. Lucas Paqueta is ruled out, Raphinha has a thigh injury, and Casemiro remains doubtful. These absences could create some weakness in Brazil's midfield and attack.
Norway, making their return to the World Cup after a long absence, should not be underestimated. Erling Haaland has been sensational, scoring 5 goals in just 3 matches and establishing himself as one of the tournament's top scorers. Haaland's presence will put significant pressure on Brazil's defense. Norway defeated Iraq 4-1 and Senegal 3-2, proving their attacking capabilities. Despite a 4-1 loss to France, they bounced back with a 2-1 victory in the Round of 32, showing their fighting spirit.
Norway's coach Stale Solbakken has developed a dangerous counter-attacking style centered around Haaland and Martin Odegaard. Odegaard's creative passing combined with Haaland's lethal finishing creates a deadly combination. Norway's matches have been high-scoring, with 10 total goals across their three group games.
According to prediction markets, Brazil holds a 52 to 55 percent chance of winning. On Polymarket, Brazil's win probability stands at 54 percent, with a draw at 27 percent and Norway at 21 percent. These numbers confirm Brazil as favorites while acknowledging Norway as a dangerous underdog. Bet365 lists Brazil at minus 112 odds, Norway at plus 320, and the draw at plus 240. Both Teams To Score probability ranges between 45 to 59 percent, as both teams possess strong attacks and somewhat vulnerable defenses. Over 2.5 goals probability sits at approximately 42 percent, indicating expectations for an entertaining match.
The most likely scorelines are 2-1 Brazil or 1-0 Brazil. Models project Brazil's expected goals at 1.50 and Norway's at 0.87, suggesting Brazil will create more chances while Norway remains dangerous with their opportunities.
Social media discussions on X show Brazil supporters feeling confident, though Norway fans remain hopeful. Some experts suggest that while Brazil will likely win, value plays exist in Norway plus 1.5 handicap or Both Teams To Score combined with Brazil win. Brazil's key player absences and Norway's Haaland factor support this analysis.
My final prediction is Brazil winning 2-1. Vinicius Junior scoring seems likely, and Haaland could also find the net for Norway. Brazil's squad depth and experience give them the edge, but Norway will put up a tough fight. This match should be goal-filled and entertaining. If Norway scores early, the match could become even more interesting as Brazil would need to open up, playing into Norway's dangerous counter-attacking strengths.
Based on current market probabilities, Brazil has a 54 percent chance to win, 27 percent for a draw, and 19 percent for Norway. These numbers support my prediction that Brazil will advance, though it will be a competitive match where both teams score.@Gate_Square
repost-content-media
  • Reward
  • Comment
  • Repost
  • Share
#ETHBreaks1700
Ethereum's decisive breakthrough above the $1,700 resistance level marks a pivotal moment in the cryptocurrency market, signaling a fundamental shift in market structure and investor sentiment. This technical milestone represents far more than a simple price point crossed; it embodies the transition from a bearish consolidation phase to a potential bullish momentum phase that could define the trajectory for the remainder of 2026.
The significance of the $1,700 level cannot be overstated from a technical analysis perspective. For months, this price point served as an impenetrabl
MuhammadAhmad
#ETHBreaks1700
Ethereum's decisive breakthrough above the $1,700 resistance level marks a pivotal moment in the cryptocurrency market, signaling a fundamental shift in market structure and investor sentiment. This technical milestone represents far more than a simple price point crossed; it embodies the transition from a bearish consolidation phase to a potential bullish momentum phase that could define the trajectory for the remainder of 2026.
The significance of the $1,700 level cannot be overstated from a technical analysis perspective. For months, this price point served as an impenetrable ceiling that repeatedly rejected Ethereum's upward advances, creating a psychological barrier that dampened investor confidence and reinforced bearish narratives. Each failed attempt to breach this level resulted in cascading sell-offs, pushing ETH into lower trading ranges and testing the resolve of long-term holders. However, the recent successful breakout has fundamentally altered this dynamic, transforming what was once formidable resistance into a robust support foundation.
Current market positioning at approximately $1,745 demonstrates that Ethereum is not merely testing the $1,700 level but has established genuine conviction above it. This price action suggests that institutional and whale accumulation has reached a critical mass where buying pressure now consistently overwhelms selling pressure at these levels. The transformation of $1,700 from resistance to support creates a new technical floor that provides traders with increased confidence for establishing long positions.
From a technical indicator standpoint, multiple convergence signals support the bullish thesis. The Relative Strength Index has climbed from oversold territory below 30 to approximately 45-50, indicating renewed buying momentum without yet reaching overbought conditions that would suggest imminent correction. This positioning leaves substantial room for further upside before technical exhaustion becomes a concern. The Moving Average Convergence Divergence indicator is approaching a bullish crossover, with the MACD line threatening to cross above the signal line, a development that historically precedes sustained upward price movements.
Bollinger Bands analysis reveals decreasing volatility compression, suggesting that a significant price expansion may be imminent. When volatility has been suppressed for extended periods, as witnessed in recent months, the subsequent breakout tends to be particularly powerful as pent-up market energy releases. Ethereum's current positioning above the middle Bollinger Band while the bands themselves begin to expand supports the interpretation that a new trending phase is initiating.
On-chain metrics provide compelling evidence of underlying strength that supports the technical breakout narrative. Whale wallets holding in excess of 10,000 ETH have demonstrated unprecedented accumulation behavior, with recent data indicating purchases exceeding 140,000 ETH within compressed timeframes. Perhaps most notably, a single entity recently acquired 50,537 ETH valued at approximately $162 million within a 24-hour period, representing one of the largest single-day purchases in recent market history. This institutional-scale accumulation signals sophisticated market participants' conviction regarding Ethereum's undervaluation at current levels.
Exchange reserve data reinforces this bullish interpretation, with Ethereum balances on centralized exchanges declining to historic lows. This trend indicates that holders are increasingly choosing self-custody or decentralized finance protocols over exchange storage, effectively removing liquid supply from immediate market circulation. When combined with whale accumulation, this supply squeeze dynamic creates favorable conditions for price appreciation as demand meets constrained available supply.
The broader cryptocurrency ecosystem stands to benefit from Ethereum's breakout performance. As the dominant smart contract platform hosting approximately $250-300 billion in total value locked across decentralized finance protocols, Ethereum's strength typically catalyzes sector-wide optimism. Layer 2 scaling solutions built atop Ethereum's infrastructure, including Arbitrum, Optimism, and Base, historically demonstrate correlated performance with ETH price action. Similarly, major DeFi tokens such as Uniswap, Aave, and Compound typically experience renewed buying interest when Ethereum establishes bullish momentum.
Network fundamentals complement the positive price action narrative. Ethereum's transition to proof-of-stake consensus has successfully established deflationary tokenomics, with network activity periodically resulting in net ETH destruction through the burn mechanism. Layer 2 adoption continues accelerating, with these scaling solutions now processing transaction volumes that rival or exceed many independent Layer 1 competitors while inheriting Ethereum's security guarantees. The upcoming Hegotá hard fork and associated EIP-8182 proposal for standardized shielded pools represent continued protocol development that enhances Ethereum's utility and competitive positioning.
Trading strategy formulation must account for both opportunity and risk management considerations. For traders establishing new positions, the $1,720-$1,740 zone presents attractive accumulation opportunities on any minor pullbacks, with the transformed $1,700 support level providing a logical stop-loss reference point. Initial profit targets should be staged at $1,800, where partial position reduction allows for risk management while maintaining upside exposure. Secondary targets at $1,865 and $1,900 represent the next significant resistance zones where additional profit-taking may be appropriate.
Swing traders should monitor volume confirmation closely, as sustainable breakouts require participation that validates price movements. Declining volume on advances would suggest weak conviction and increased vulnerability to reversal. The $1,750-$1,800 range will likely serve as a consolidation zone where Ethereum establishes a foundation for the next leg higher, providing multiple entry opportunities for patient participants.
Macro considerations remain relevant despite improving technical conditions. Federal Reserve monetary policy decisions continue influencing risk asset valuations, with interest rate trajectories affecting the opportunity cost of cryptocurrency investments. Institutional adoption trends, including corporate treasury allocations and retirement account integrations, represent structural demand sources that may accelerate as regulatory clarity improves. Geopolitical developments and traditional market correlations warrant monitoring, as cryptocurrency markets do not operate in complete isolation from broader financial conditions.
Risk management discipline remains paramount even within favorable technical setups. Position sizing should reflect individual risk tolerance and portfolio context, with prudent traders avoiding excessive leverage that could force liquidation during normal volatility. The cryptocurrency market operates continuously without traditional market hours, necessitating alert systems and contingency planning for unexpected developments.
For traders seeking professional execution environments, Gate provides comprehensive infrastructure supporting sophisticated cryptocurrency trading strategies. The platform offers advanced charting capabilities with integrated technical indicators including RSI, MACD, Bollinger Bands, and customizable moving averages. Real-time price alert systems enable proactive position management, while deep liquidity across spot and derivatives markets ensures efficient order execution. Security protocols incorporating cold storage, multi-signature authorization, and insurance funds protect user assets against operational risks.
The confluence of technical breakout confirmation, on-chain accumulation evidence, network fundamental development, and improving macro sentiment suggests Ethereum has established a foundation for sustained appreciation. While short-term volatility remains inherent to cryptocurrency markets, the structural shift represented by the $1,700 breakout provides a framework for strategic positioning that balances opportunity capture with prudent risk management.@Gate_Square
repost-content-media
  • Reward
  • Comment
  • Repost
  • Share
#MetaSellsComputeTriggersChipSlump
The global artificial intelligence chip market experienced a significant seismic shift on July 1, 2026, when Meta Platforms announced its plans to build a cloud infrastructure business that would sell excess AI computing capacity to external customers. This strategic pivot by one of the world's largest technology companies sent shockwaves through the entire semiconductor ecosystem, triggering substantial selling pressure across chip stocks and raising fundamental questions about the future demand trajectory for AI accelerators. The market reaction was immed
MuhammadAhmad
#MetaSellsComputeTriggersChipSlump
The global artificial intelligence chip market experienced a significant seismic shift on July 1, 2026, when Meta Platforms announced its plans to build a cloud infrastructure business that would sell excess AI computing capacity to external customers. This strategic pivot by one of the world's largest technology companies sent shockwaves through the entire semiconductor ecosystem, triggering substantial selling pressure across chip stocks and raising fundamental questions about the future demand trajectory for AI accelerators. The market reaction was immediate and severe, with Meta's own stock surging approximately 8 to 10 percent while competitors in the AI infrastructure space faced devastating declines. Nebius plummeted nearly 12 percent, CoreWeave dropped approximately 10 percent, Super Micro Computer declined roughly 4 percent, Nvidia fell around 2 percent, AMD dropped nearly 3 percent, while Intel, Arm Holdings, Taiwan Semiconductor Manufacturing Company, and GlobalFoundries each lost approximately 4 percent of their market value.
The underlying mathematics of this market disruption reveals the precarious nature of current AI infrastructure investments. Meta has invested tens of billions of dollars into building massive data centers and acquiring cutting-edge AI chips, primarily from Nvidia, to support its artificial intelligence ambitions. By creating a cloud business to monetize excess computing capacity, Meta is essentially acknowledging that it has built more infrastructure than it currently needs for internal purposes. This excess capacity represents a double-edged sword for the semiconductor industry. On one hand, it demonstrates the continued willingness of major technology companies to invest heavily in AI infrastructure. On the other hand, it signals that the demand assumptions underlying these massive capital expenditures may have been overly optimistic.
The global AI chip market, which was valued at approximately 52.92 billion dollars in 2024 according to industry analysts, is projected to reach 295.56 billion dollars by 2030, representing a compound annual growth rate of 33.2 percent. However, this growth trajectory is now facing significant headwinds. Nvidia, which controls an estimated 81 percent of the AI data center chip market, saw its dominance challenged not by technological competition but by demand-side concerns. The company's data center revenue, which constitutes approximately 90 percent of its total revenue, reached 44.1 billion dollars in the first quarter of fiscal year 2026, marking a 69 percent year-over-year increase. Yet this impressive growth rate may face deceleration as major customers like Meta begin to resell their excess capacity rather than purchasing additional chips.
The competitive dynamics of the AI chip market are undergoing a fundamental transformation. AMD, which holds approximately 10 percent of the AI accelerator market, has been positioning its MI300X accelerator as a viable alternative to Nvidia's offerings. This market share represents a significant increase from approximately 5 percent in 2024, indicating that AMD has been successfully capturing market share from Nvidia. However, the Meta cloud announcement threatens to disrupt this competitive landscape by introducing a new supply source that could reduce overall demand for new chip purchases. The total AI chip market revenue, which reached 514.5 billion dollars in 2026 representing a 19 percent increase from 390.9 billion dollars in 2025, now faces potential downward revision as demand signals weaken.
The broader implications for the semiconductor industry extend far beyond individual stock price movements. The chip market is heavily exposed to AI chips for data centers, with up to approximately 50 percent of industry revenues expected to come from that market segment in 2026 according to Deloitte's industry outlook. This concentration risk means that any slowdown in AI chip demand will have disproportionate effects on the entire semiconductor ecosystem. Industry analysts who previously projected growth rates of 22 percent for 2025 are now revising their forecasts downward to approximately 12 percent for 2026, with some estimates suggesting growth could reach 18 percent under optimistic scenarios but acknowledging that this represents a significant deceleration from previous expectations.
The demand destruction scenario that Meta's cloud business represents cannot be understated. When a company of Meta's scale begins selling excess AI computing capacity, it effectively adds new supply to the market without requiring additional chip purchases. This supply injection competes directly with cloud providers like Amazon Web Services, Microsoft Azure, and Google Cloud, as well as specialized AI infrastructure companies like CoreWeave and Nebius. The competitive pressure extends to chip manufacturers because reduced demand from cloud providers translates directly into reduced orders for new AI accelerators. The mathematics are stark: if Meta can satisfy even 10 to 15 percent of external AI computing demand through its excess capacity, this could represent billions of dollars in lost revenue for traditional cloud providers and, by extension, reduced chip orders for Nvidia, AMD, and Intel.
The market structure of the AI chip industry amplifies these concerns. Nvidia's B200 chip, which represents the current state-of-the-art in AI acceleration, has seen its computing power pricing decline according to prediction market data from Kalshi. This price compression indicates that the supply of AI computing capacity is growing faster than demand, a trend that Meta's cloud entry will only accelerate. The price decline for computing power directly impacts the return on investment calculations for data center operators, potentially leading to reduced capital expenditure plans and further pressure on chip demand.
The geographic dimensions of this market shift add additional complexity to the demand outlook. Nvidia's AI chip sales in China have stalled as local competitors like Huawei gain market share. Huawei has made significant inroads in the Chinese market, rolling out some of the world's most powerful AI computing clusters despite facing U.S. export controls that limit access to advanced manufacturing technologies. This development means that the world's second-largest economy is increasingly self-sufficient in AI chips, reducing the addressable market for American semiconductor companies. The combination of reduced Chinese demand and excess capacity from major American technology companies creates a demand squeeze that could persist for multiple quarters.
The financial mathematics of the AI infrastructure build-out reveal the scale of the potential demand adjustment. Major technology companies have collectively committed over 2.7 trillion dollars to AI infrastructure investments. This massive capital expenditure was predicated on the assumption that AI computing demand would grow exponentially for the foreseeable future. However, the emergence of excess capacity at major customers suggests that supply may have outpaced demand growth. When supply exceeds demand in a capital-intensive industry like semiconductor manufacturing, the adjustment process typically involves extended periods of reduced capital expenditure, inventory destocking, and price competition.
The competitive response from established cloud providers will likely intensify the pressure on chip demand. Amazon Web Services, Microsoft Azure, and Google Cloud have all made massive investments in AI infrastructure and will not cede market share to Meta without aggressive competition. This competitive dynamic typically manifests in price reductions for AI computing services, which squeezes margins for cloud providers and reduces their willingness to pay premium prices for the latest AI chips. The price elasticity of demand for AI computing services means that lower prices will stimulate some additional demand, but the magnitude of this demand response may be insufficient to offset the supply injection from Meta's excess capacity.
The memory chip segment of the AI infrastructure market is also experiencing significant volatility. Micron Technology, which had seen its stock surge on blockbuster third-quarter earnings, fell more than 5 percent following the Meta cloud announcement. Memory chips, particularly high-bandwidth memory used in AI accelerators, have been a key beneficiary of the AI infrastructure build-out. However, the demand for memory is directly tied to the demand for AI accelerators, and any slowdown in accelerator purchases will translate into reduced memory demand. The high-bandwidth memory market, which was growing at a compound annual growth rate of 34 percent, could see this growth rate decelerate as data center operators adjust their capacity expansion plans.
The market sentiment shift triggered by Meta's announcement reflects a broader reassessment of AI infrastructure valuations. Investors who had bid up AI chip stocks to historically high valuations based on aggressive growth assumptions are now recalibrating their expectations. The price-to-earnings ratios of major AI chip companies, which had reached elevated levels, are now facing compression as growth expectations moderate. This valuation adjustment process can be extended and painful, as investors gradually adjust to a new reality of slower growth and increased competition.
The strategic implications for semiconductor companies are profound. Nvidia, which has enjoyed near-monopoly status in the AI accelerator market, must now contend with the reality that its largest customers may become competitors. AMD's challenge is different but equally significant: the company must convince data center operators to purchase its accelerators rather than utilizing excess capacity from existing installations. Intel, which has been struggling to regain competitiveness in the AI accelerator market, faces the prospect of reduced overall market growth just as it is attempting to stage a comeback.
The long-term outlook for AI chip demand remains positive, but the path forward is likely to be more volatile than previously assumed. The global AI chip market is still projected to grow from approximately 52.92 billion dollars in 2024 to 295.56 billion dollars by 2030, representing a compound annual growth rate of 33.2 percent. However, the timing and trajectory of this growth are now subject to greater uncertainty. The market may experience periods of oversupply and price weakness as the industry adjusts to new demand realities, followed by periods of supply tightness as growth resumes.
In conclusion, Meta's entry into the cloud computing business represents a watershed moment for the AI chip industry. The announcement has exposed underlying concerns about excess capacity and demand sustainability that were previously masked by the euphoria surrounding AI development. The immediate market reaction, which saw billions of dollars in market value evaporate from semiconductor stocks, reflects a fundamental reassessment of growth prospects. While the long-term demand for AI computing power is likely to continue growing, the near-term outlook has become considerably more uncertain. Investors and industry participants must now navigate a more complex environment characterized by increased competition, price pressure, and demand volatility.@Gate_Square
repost-content-media
  • Reward
  • Comment
  • Repost
  • Share
#StakeUSD1Earn8.26%APR
Unlock Passive Income with Gate.com: Stake USD1 and Earn 8.26 Percent APR While Maximizing Rewards Through the Gate Card Points System
Gate.com has introduced an exceptional opportunity for investors, traders, and everyday users to generate passive income through USD1 staking, offering an impressive 8.26 percent annual percentage rate. This innovative program allows participants to earn real yield on their stablecoin holdings while maintaining complete flexibility over their assets. The USD1 staking mechanism operates through a simple deposit and delegation process wher
GT-0.88%
MuhammadAhmad
#StakeUSD1Earn8.26%APR
Unlock Passive Income with Gate.com: Stake USD1 and Earn 8.26 Percent APR While Maximizing Rewards Through the Gate Card Points System
Gate.com has introduced an exceptional opportunity for investors, traders, and everyday users to generate passive income through USD1 staking, offering an impressive 8.26 percent annual percentage rate. This innovative program allows participants to earn real yield on their stablecoin holdings while maintaining complete flexibility over their assets. The USD1 staking mechanism operates through a simple deposit and delegation process where users can lock their USD1 tokens into Gate staking protocol and begin earning rewards immediately. What makes this offering particularly attractive is that the rewards accrue from actual protocol revenue and underlying yield sources rather than merely through new token issuance, ensuring sustainable returns for participants.
The mathematics behind this opportunity demonstrates significant earning potential. If an investor stakes 1,000 USD1 and the APR remains constant at 8.26 percent throughout the year, they would generate approximately 82.60 USD1 in annual earnings. Breaking this down further, this translates to an average daily earning of approximately 0.23 USD1, which accumulates automatically without requiring any manual intervention. The rewards begin accruing just one day after initiating the staking process, and distributions occur automatically on a daily basis, ensuring consistent passive income streams. Perhaps most importantly, there is no fixed lock-up period, meaning participants can withdraw their assets whenever they wish, providing unparalleled liquidity and flexibility that traditional banking products cannot match.
When comparing this 8.26 percent yield to conventional banking savings rates, the difference becomes strikingly apparent. Most traditional banks offer savings account interest rates ranging from 0.01 percent to 2.00 percent annually, making Gate USD1 staking approximately four to eight times more lucrative than standard banking alternatives. For conservative investors seeking stable returns without exposure to volatile cryptocurrency price fluctuations, this represents an ideal entry point into digital asset earning opportunities.
Complementing the USD1 staking program, Gate has revolutionized the payment experience through its Gate Card Points System, creating a comprehensive ecosystem where users can earn rewards on both their investments and everyday spending. The Gate Card Points System is built around three fundamental pillars: cashback on spending, points redemption, and tier-based growth. This sophisticated rewards structure enables users to seamlessly switch between Simple Earn, Gate Pay, or their Spot balance as funding sources for Gate Card payments while continuously accumulating points through every transaction.
The tier-based cashback structure operates across six levels from T0 to T5, with each tier offering progressively higher cashback percentages, maximum cashback per transaction, and monthly cashback caps. At the highest tier, eligible users can earn up to 8 percent cashback on purchases, with a maximum of 150 USDT per transaction and up to 400 USDT in monthly cashback rewards. This creates a powerful incentive mechanism where increased spending directly correlates with enhanced rewards, establishing a virtuous cycle of spending, tier progression, and increased benefits.
Points accumulation occurs at fixed rates for eligible purchases, and these points can be redeemed for digital assets such as USDT and GT. The redeemed assets are credited directly to the user's designated account, making them immediately available for subsequent trading, wealth management activities, or future spending. A particularly advantageous feature is that points remain valid indefinitely, eliminating any pressure to redeem within specific timeframes and allowing users to accumulate substantial rewards over extended periods.
The Gate Card itself represents a breakthrough in cryptocurrency payment solutions, available in over 200 countries and regions and accepted at approximately 150 million Visa merchants worldwide. This global acceptance enables users to spend their digital assets directly without manual conversion, supporting online payments, in-store purchases, and ATM withdrawals. The card integrates seamlessly with Apple Pay and Google Pay, providing convenient mobile payment options. Industry-leading spending limits further enhance the utility, with up to 500,000 USD permitted per transaction and per day, and monthly limits reaching 1,500,000 USD. Top-tier users qualify for unlimited annual limits, accommodating high-frequency consumption, cross-border payments, and large-scale fund utilization.
For traders and active investors, the combination of USD1 staking and Gate Card usage creates multiple revenue streams. While staked USD1 generates passive income at 8.26 percent APR, everyday spending through the Gate Card simultaneously accumulates points that convert to additional digital assets. This dual-earning mechanism maximizes the utility of every dollar held within the Gate ecosystem, transforming idle assets into productive capital.
The practical application of these programs demonstrates their value across various user profiles. Conservative investors can stake USD1 to earn stable, predictable returns significantly exceeding traditional banking products. Active traders can maintain liquidity in USD1 while earning passive income between trading opportunities. Frequent travelers and international spenders benefit from the global acceptance and competitive exchange rates offered by the Gate Card. Even casual users benefit from the points accumulation on everyday purchases, gradually building digital asset portfolios through routine spending.
Gate continues to strengthen its payment ecosystem by deepening the integration between payments and its broader digital asset platform. The company is actively expanding real-world use cases for digital assets and accelerating mainstream Web3 payment adoption through comprehensive product suites and enhanced service capabilities. Future developments promise additional redeemable assets and benefits, ensuring that early adopters of the Gate Card Points System will enjoy increasingly valuable rewards as the ecosystem evolves.
For those considering participation, the process is straightforward. Users can deposit USD1 into the Gate staking protocol with no minimum requirements, begin earning immediately, and withdraw at any time. Simultaneously, applying for a Gate Card opens access to the points system, with automatic tier upgrades occurring as spending thresholds are met. The combination of these programs positions Gate.com as a leading platform for users seeking to maximize the earning potential of their digital assets while maintaining the flexibility to spend and manage their funds according to their individual needs.
In conclusion, Gate.com offers a compelling value proposition for investors, traders, and everyday users through its USD1 staking program and Gate Card Points System. The 8.26 percent APR on USD1 staking provides substantial passive income potential, while the up to 8 percent cashback through the Gate Card Points System rewards everyday spending with valuable digital assets. Together, these programs create a comprehensive financial ecosystem where users can earn, spend, and grow their wealth within a single integrated platform.@Gate_Square
repost-content-media
  • Reward
  • Comment
  • Repost
  • Share
#gStocksTokenizedStocksLive
gStocks Tokenized Securities on Gate The Future of Global Investing Through Blockchain
The financial industry continues to evolve as blockchain technology creates new opportunities for investors around the world. Gate has introduced gStocks Tokenized Securities to connect traditional stock markets with the digital asset ecosystem. This innovation allows users to access selected global companies through blockchain based tokenized securities without leaving the Gate platform. It creates a modern investment experience where cryptocurrencies and tokenized stocks can be
AMD7.08%
MU-6.57%
SNDKG-10.36%
SPCX-0.44%
MuhammadAhmad
#gStocksTokenizedStocksLive
gStocks Tokenized Securities on Gate The Future of Global Investing Through Blockchain
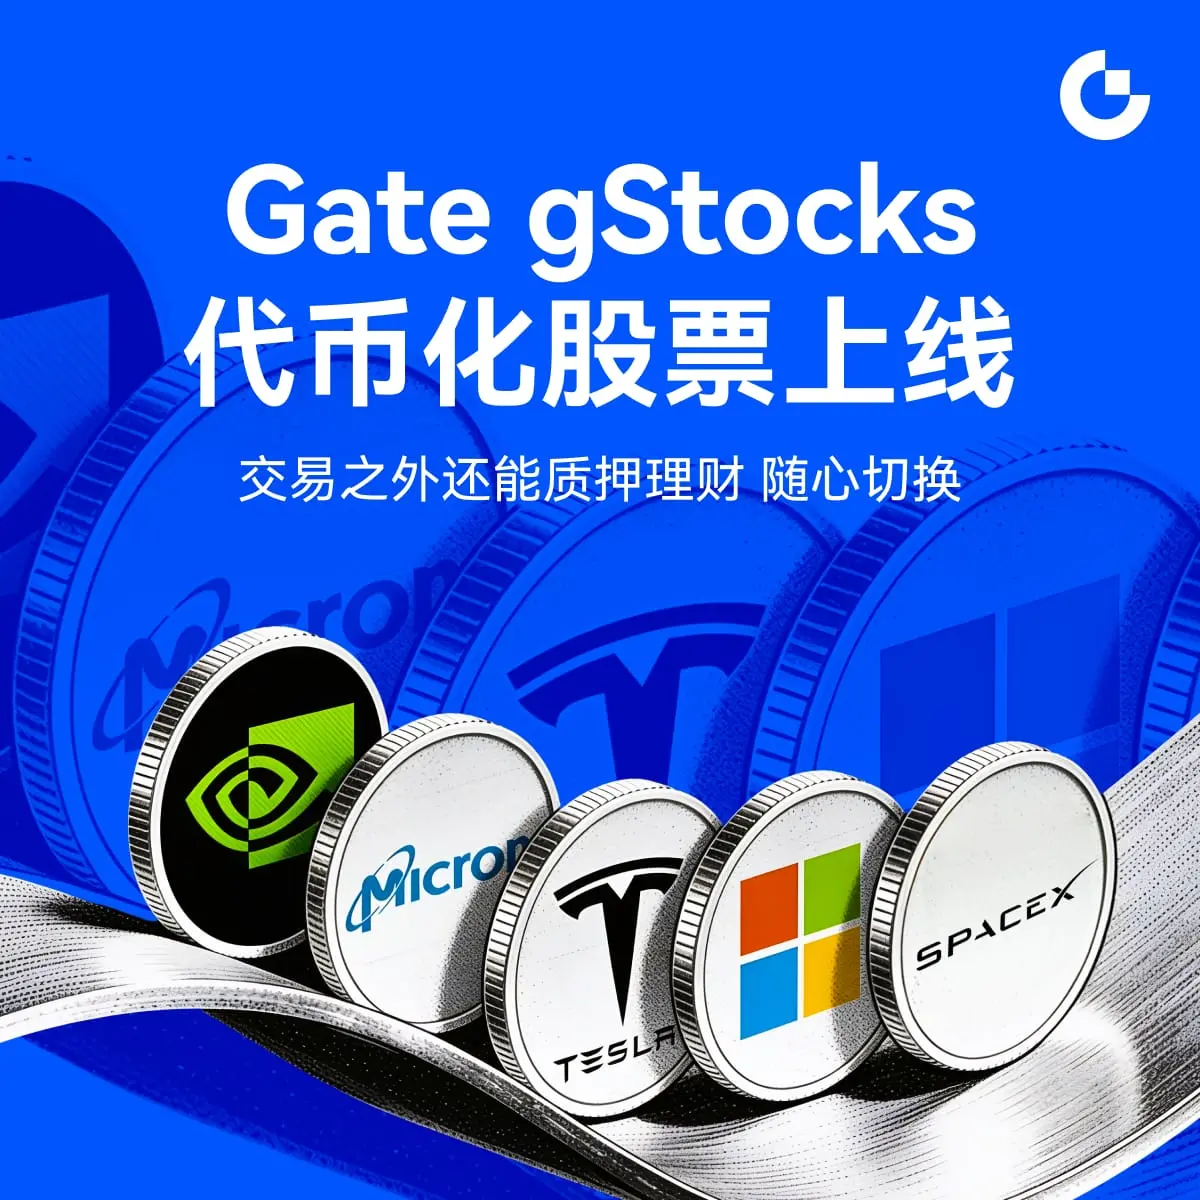
The financial industry continues to evolve as blockchain technology creates new opportunities for investors around the world. Gate has introduced gStocks Tokenized Securities to connect traditional stock markets with the digital asset ecosystem. This innovation allows users to access selected global companies through blockchain based tokenized securities without leaving the Gate platform. It creates a modern investment experience where cryptocurrencies and tokenized stocks can be managed together in one account.
One of the strongest features of gStocks is its 1:1 reserve backing. Every tokenized security is backed by an equivalent amount of the underlying stock. This model is designed to closely reflect the value of the original asset while providing transparency and confidence for users. Instead of trading synthetic products users gain exposure to securities that are supported through a structured reserve model.
The first launch includes several well known companies including AMD Micron SanDisk and SpaceX with additional stocks and ETFs expected in the future. This means users can gradually build diversified portfolios through companies representing different industries and growth sectors.
Traditional stock exchanges only operate during limited business hours but gStocks changes that experience by offering 24 hours trading seven days a week. Investors no longer need to wait for market opening hours before managing their positions. This flexibility gives global users the opportunity to react to important market developments whenever trading is available on the platform.
Another important advantage is fractional investing. Expensive shares often prevent small investors from entering global markets. With gStocks investments start from only 1 USDT allowing users to gain exposure with very small amounts of capital. Instead of waiting until enough money is available to purchase a full share investors can begin building positions gradually over time.
Gate has also integrated gStocks into its broader digital asset ecosystem. Users can manage cryptocurrencies tokenized securities and supported financial products inside one account. This unified approach simplifies portfolio management because investors do not need to move funds between multiple exchanges or traditional brokerage platforms.
The trading experience is familiar for cryptocurrency users because gStocks uses a professional order book with efficient price discovery and competitive liquidity. Users can place market orders limit orders and other supported order types depending on their trading strategy. Advanced traders can also benefit from API connectivity automated trading solutions and trading bots for more sophisticated execution.
Dividend support provides another attractive feature. Whenever eligible companies distribute dividends the corresponding payments are automatically processed according to platform rules. This enables investors to participate in company performance while enjoying the convenience of blockchain based asset management.
Security remains one of the highest priorities. Gate applies advanced security practices together with transparent asset management to create a reliable environment for investors. Every supported tokenized security follows a structured reserve model while the platform continues strengthening its infrastructure to protect user assets.
Portfolio diversification becomes much easier through gStocks. Instead of concentrating investments in only cryptocurrencies users can spread capital across multiple asset classes.
Technology healthcare finance industrial companies and future ETF offerings provide opportunities to reduce overall portfolio concentration while increasing exposure to different sectors of the global economy.
Long term investors may focus on established companies with consistent business performance while active traders can monitor price movements and market momentum for shorter term opportunities. Technical analysis tools such as moving averages RSI MACD trend analysis support and resistance levels can help traders identify possible entry and exit zones although no indicator guarantees future performance.
Global economic events continue to influence stock prices. Company earnings reports interest rate decisions inflation data product launches and major business announcements can all create market volatility. Understanding these factors allows investors to make better informed decisions instead of relying only on short term market emotions.
Risk management remains one of the most important principles for every investor. Successful investing is not only about finding profitable opportunities but also about protecting capital during uncertain market conditions. Diversification disciplined position sizing realistic expectations and consistent research often produce better long term results than excessive leverage or emotional trading decisions.
One of the biggest advantages of blockchain based investing is accessibility. Investors from many regions can gain exposure to internationally recognized companies through a digital platform without navigating the complexity often associated with traditional cross border investing. This opens new opportunities for users seeking participation in the growth of global businesses.
As blockchain technology continues to mature tokenized securities are becoming an important bridge between traditional finance and digital assets. Institutions exchanges and financial technology companies are increasingly exploring tokenization because it can improve accessibility operational efficiency and market participation.
Gate continues expanding its financial ecosystem by introducing products that combine innovation with practical investing tools. The addition of gStocks demonstrates the platform's commitment to providing users with broader market access while maintaining an integrated digital asset experience.
For investors seeking diversification flexibility and convenient access to global companies gStocks offers a modern solution that combines blockchain technology with traditional financial markets. With fractional investing 24 hour trading unified portfolio management competitive fees advanced trading tools and future expansion plans gStocks has the potential to become an important part of the next generation of digital investing. As adoption grows tokenized securities may play an increasingly significant role in shaping the future of global financial markets while giving investors more choices than ever before.
repost-content-media
  • Reward
  • Comment
  • Repost
  • Share
#GTBurns2.57MInQ2
The cryptocurrency industry continues to evolve through innovation, transparency, and sustainable tokenomics that strengthen blockchain ecosystems over time. One of the most effective strategies adopted by leading digital asset projects is the implementation of regular token burns, which permanently reduce circulating supply while reinforcing long-term ecosystem value. The latest milestone, GT Burns 2.57M in Q2, highlights Gate's continued commitment to responsible token management and its vision of building a stronger, more sustainable digital economy. By permanently removi
GT-0.88%
MuhammadAhmad
#GTBurns2.57MInQ2
The cryptocurrency industry continues to evolve through innovation, transparency, and sustainable tokenomics that strengthen blockchain ecosystems over time. One of the most effective strategies adopted by leading digital asset projects is the implementation of regular token burns, which permanently reduce circulating supply while reinforcing long-term ecosystem value. The latest milestone, GT Burns 2.57M in Q2, highlights Gate's continued commitment to responsible token management and its vision of building a stronger, more sustainable digital economy. By permanently removing 2.57 million GT tokens during the second quarter, Gate demonstrates its dedication to maintaining a healthy balance between token supply, ecosystem growth, and community value.
Token burning is a blockchain-based process where cryptocurrency tokens are permanently removed from circulation by transferring them to an unrecoverable wallet address known as a burn address. Since these tokens can never be accessed or spent again, the total supply decreases permanently. This deflationary mechanism has become an important component of modern blockchain economics because it supports long-term scarcity while improving the overall structure of a token's economy.
The Q2 burn of 2.57 million GT represents much more than a routine quarterly event. It reflects Gate's disciplined approach toward managing its native ecosystem token with transparency and consistency. While token burns alone do not determine market prices, they signal a project's long-term commitment to sustainable growth, responsible governance, and creating lasting value for users and investors.
Scarcity has always been one of the strongest economic principles influencing asset valuation. When demand remains steady or increases while supply gradually declines, market fundamentals often become more favorable over the long term. This concept is evident across numerous successful blockchain projects that implement periodic token burns as part of carefully designed tokenomics strategies. By reducing available supply over time, projects seek to strengthen the long-term utility and sustainability of their native digital assets.
The GT Token serves as the foundation of the Gate ecosystem and provides multiple real-world utilities. Holders can benefit from trading fee discounts, participation in exclusive Launchpad projects, staking opportunities, ecosystem rewards, VIP membership benefits, governance participation, and access to various blockchain-based financial products. As the Gate ecosystem continues expanding across Web3 services, decentralized finance (DeFi), and digital asset innovation, the utility of GT continues to grow alongside platform adoption.
Transparent tokenomics have become increasingly important for cryptocurrency investors. Beyond market performance, experienced participants evaluate supply mechanisms, issuance schedules, governance models, ecosystem development, and long-term sustainability before making investment decisions. Regular token burns supported by publicly verifiable blockchain transactions strengthen investor confidence while demonstrating accountability and responsible project management.
Blockchain technology itself provides complete transparency throughout the token burn process. Every burn transaction is permanently recorded on the blockchain, allowing anyone to independently verify the exact number of tokens removed from circulation. This level of openness distinguishes blockchain ecosystems from many traditional financial systems by enabling users to confirm important events directly through publicly accessible blockchain records.
Institutional interest in digital assets continues expanding as blockchain technology matures. Investment funds, fintech companies, venture capital firms, and financial institutions increasingly recognize the importance of projects that combine technological innovation with disciplined ecosystem management. Transparent tokenomics, responsible governance, and sustainable growth strategies often become key factors influencing institutional confidence and long-term investment decisions.
Macroeconomic conditions also continue shaping cryptocurrency markets. Inflation expectations, central bank monetary policies, global liquidity, regulatory developments, and investor sentiment all influence digital asset performance. During periods of market uncertainty, blockchain ecosystems supported by strong fundamentals and transparent economic models often attract greater long-term attention from investors focused on sustainable value creation.
Innovation remains central to the continued evolution of the Gate ecosystem. Beyond token burns, ongoing developments in decentralized finance, artificial intelligence integration, blockchain interoperability, tokenized real-world assets, and Web3 infrastructure continue expanding the practical applications of digital assets. These innovations increase ecosystem utility while strengthening GT's position within the broader blockchain economy.
Responsible investing remains essential regardless of positive project developments. Token burns represent only one aspect of a comprehensive ecosystem strategy and should always be evaluated alongside technology, security, user adoption, leadership, regulatory compliance, and overall project fundamentals. Conducting independent research, maintaining diversified portfolios, and applying disciplined risk management remain the foundations of successful long-term investing.
Looking toward the future, regular quarterly token burns combined with continuous ecosystem expansion position GT for sustainable long-term development. As Gate continues introducing innovative financial products, expanding blockchain services, and increasing global adoption, responsible supply management will remain an important pillar supporting ecosystem stability and investor confidence.
Ultimately, GT Burns 2.57M in Q2 represents far more than the destruction of millions of tokens—it demonstrates Gate's ongoing commitment to transparent governance, sustainable tokenomics, and responsible blockchain innovation. Through disciplined supply reduction, expanding ecosystem utility, and continuous technological development, Gate continues strengthening the foundation of its digital economy while creating long-term value for its global community. As the cryptocurrency industry continues evolving, strategic initiatives like quarterly token burns reinforce the importance of transparency, sustainability, and innovation in building the next generation of blockchain ecosystems.
#GTBurns2.57MInQ2 #GTToken #GateChain
repost-content-media
  • Reward
  • Comment
  • Repost
  • Share
#SKHynixListsOnNasdaq
SK Hynix is currently trading at approximately 1,530 USDT based on current exchange rates. The stock has experienced significant volatility recently, with a 52-week range spanning from 160 USDT to 1,954 USDT, representing an extraordinary 1,121% appreciation from its lows. The company commands a massive market capitalization of approximately 1.12 trillion USDT, positioning it as one of the most valuable semiconductor companies globally.
Company Excellence and Market Position
SK Hynix stands as the world's premier supplier of High Bandwidth Memory (HBM), the critical comp
MuhammadAhmad
#SKHynixListsOnNasdaq
SK Hynix is currently trading at approximately 1,530 USDT based on current exchange rates. The stock has experienced significant volatility recently, with a 52-week range spanning from 160 USDT to 1,954 USDT, representing an extraordinary 1,121% appreciation from its lows. The company commands a massive market capitalization of approximately 1.12 trillion USDT, positioning it as one of the most valuable semiconductor companies globally.
Company Excellence and Market Position
SK Hynix stands as the world's premier supplier of High Bandwidth Memory (HBM), the critical component powering artificial intelligence data centers worldwide. The company has established an unassailable competitive moat through its exclusive partnership with Nvidia, supplying the memory chips essential for AI training and inference operations. This strategic positioning has transformed SK Hynix from a traditional memory manufacturer into the backbone of the global AI infrastructure revolution.
The company's technological superiority is evident in its manufacturing yields, which consistently outperform competitors including Micron and Samsung Electronics. SK Hynix's early investment in HBM technology has created a multi-year lead that competitors struggle to close, with the company supplying approximately 60% of the HBM market and maintaining exclusive supply relationships with the world's leading AI chip manufacturers.
Financial Performance Analysis
SK Hynix has delivered unprecedented financial results that underscore its market dominance. Revenue for the trailing twelve months reached 86.3 billion USDT, representing an 85% year-over-year increase. Net income surged to 49.1 billion USDT, marking a staggering 189.3% growth, while earnings per share climbed to 69.1 USDT, up 185.7% from previous periods.
The first quarter of 2026 proved historic, with revenue tripling to 34.4 billion USDT (198% year-over-year growth) and operating profit exploding five-fold to 24.6 billion USDT, achieving an extraordinary 72% operating margin. This profitability surge stems from exceptional pricing power, with DRAM contract prices rising 83% quarter-over-quarter and NAND flash prices surging 160% in just three months.
Technical Analysis and Key Levels
From a technical perspective, SK Hynix presents a mixed but generally constructive outlook. The Relative Strength Index (RSI) currently reads 50, indicating neutral momentum. Moving averages reveal a complex picture, with short-term EMAs (10-day and 20-day) positioned at 1,626 USDT and 1,594 USDT respectively, both generating sell signals. However, longer-term moving averages including the 50-day EMA at 1,376 USDT and 200-day EMA at 811 USDT confirm strong buy signals, suggesting the primary uptrend remains intact.
Critical support levels are identified at 1,374 USDT (accumulated volume support), 1,350 USDT (Fibonacci S1), and 1,313 USDT (Classic S1). These levels represent potential entry points for long-term investors seeking exposure to the AI memory supercycle. Resistance levels are established at 1,916 USDT (Fibonacci R1), 2,052 USDT (Classic R1), and 2,089 USDT (Fibonacci R2), with a breakthrough above these levels potentially triggering accelerated upside momentum.
The pivot point stands at 1,632 USDT, with current price action trading below this level, suggesting short-term consolidation. The MACD indicator shows a sell signal at 73 USDT, while Bull Bear Power indicates buying pressure at negative 121 USDT, reflecting underlying accumulation despite recent weakness.
Analyst Consensus and Price Targets
The analyst community maintains overwhelming bullish sentiment on SK Hynix, with 37 analysts rating the stock as Strong Buy. The average 12-month price target stands at 2,072 USDT, representing 35.4% upside potential from current levels. Individual analyst targets range from conservative estimates of 449 USDT to aggressive projections of 3,638 USDT, with major investment banks including Goldman Sachs (2,289 USDT target), Nomura (2,616 USDT target), and JPMorgan (1,962 USDT target) all maintaining buy ratings.
The consensus implies a potential upside of 14.6% based on average analyst expectations, with the highest conviction targets suggesting returns exceeding 137% if the company continues executing on its HBM roadmap and capitalizing on AI infrastructure spending.
Nasdaq Listing and Global Expansion
SK Hynix has announced plans to raise up to 19.2 billion USDT through an American Depositary Receipt (ADR) listing on the Nasdaq Stock Exchange, potentially marking one of the largest international listings in history. This strategic move will enable American investors, traders, and institutions to directly participate in SK Hynix's growth story through dollar-denominated securities traded on the world's premier technology exchange.
The ADR listing represents a transformative development for global investors, eliminating currency conversion complexities and providing access to US trading hours and liquidity. Upon completion, SK Hynix shares will be accessible to the vast American retail and institutional investor base, potentially driving significant demand expansion and valuation multiple expansion as the company joins the ranks of global semiconductor leaders with dual listings.
The proceeds from this historic offering will fund aggressive capacity expansion, including new fabrication facilities in South Korea and advanced equipment acquisitions from suppliers like ASML. The company plans to invest 52.3 billion USDT to build new NAND memory chip production facilities by 2029, directly addressing supply constraints driven by the AI boom.
Trading Strategy and Investment Outlook
For traders and investors considering SK Hynix exposure, several strategic approaches present themselves. Long-term investors may accumulate positions on weakness toward the 1,374 USDT support zone, representing a 10.2% discount to current prices. This level has historically attracted institutional buying and aligns with key technical support confluence.
Swing traders might await a breakout above the 1,632 USDT pivot point, which could signal resumption of the primary uptrend with initial targets at 1,916 USDT (25.2% upside) and extended objectives at 2,052 USDT (34.1% upside). Risk management suggests stop-loss placement below 1,300 USDT to protect against deeper corrections.
The fundamental investment thesis remains exceptionally compelling. SK Hynix is positioned at the epicenter of the AI revolution, supplying essential components for data center expansion, autonomous vehicles, and edge computing applications. The company's HBM technology represents a structural growth driver with multi-year visibility, supported by long-term supply agreements with hyperscale customers including Microsoft, Google, Amazon, and Meta.
Market Sentiment and Future Catalysts
Institutional sentiment toward SK Hynix remains overwhelmingly positive, driven by the transition from AI model training to agentic AI deployment. This evolution expands memory requirements beyond HBM to include massive conventional DRAM and ultra-fast enterprise NAND for real-time processing applications. The shift effectively doubles addressable market opportunities while maintaining SK Hynix's competitive advantages.
Key catalysts for the remainder of 2026 include the Nasdaq ADR listing completion, Q3 earnings scheduled for October 29, 2025, and continued HBM4 development progress. The company's planned investment of 376.7 billion USDT alongside Samsung Electronics in South Korean AI chip production facilities underscores government and industry commitment to maintaining technological leadership.
Risk Considerations
While the investment case remains compelling, several risk factors warrant consideration. The semiconductor industry exhibits cyclical characteristics, and any slowdown in AI infrastructure spending could pressure pricing and margins. Geopolitical tensions involving China and Taiwan pose supply chain risks, though SK Hynix's diversified manufacturing footprint provides partial mitigation. Competition from Samsung and emerging Chinese memory manufacturers represents a longer-term challenge, though current technological gaps suggest sustained market share protection.
The stock's beta of 2.32 indicates elevated volatility relative to broader markets, requiring appropriate position sizing and risk tolerance assessment. Recent price action shows 11.93% intraday volatility, emphasizing the need for disciplined entry and exit strategies.
Conclusion
SK Hynix represents a generational investment opportunity at the intersection of artificial intelligence and semiconductor technology leadership. With current trading at 1,530 USDT, the stock offers exposure to the AI memory supercycle with analyst price targets suggesting 35.4% to 137.7% upside potential. The upcoming Nasdaq ADR listing will democratize access for American investors while providing additional liquidity and valuation support.
The combination of technological leadership, exclusive Nvidia partnership, pricing power, and massive capacity expansion investments positions SK Hynix for sustained outperformance. Long-term investors should consider accumulating positions near support levels, while traders may await technical confirmation above key resistance zones. The fundamental transformation from cyclical memory producer to AI infrastructure essential makes SK Hynix a core holding for technology-focused portfolios seeking exposure to the decade's defining investment theme.@Gate_Square
repost-content-media
  • Reward
  • Comment
  • Repost
  • Share
#TradFiCFDGoldMasters
Gold CFD trading in traditional financial markets represents a sophisticated and potentially lucrative domain that allows professional traders and institutional investors to capitalize on global gold price movements without taking physical ownership of the precious metal. Gate.com has introduced an exceptional opportunity for its users where they can not only engage in professional Gold CFD trading but also earn points through the Gate Card Points System on every eligible purchase, redeemable for valuable digital assets including BTC, ETH, USDT, and GT.
Fundamentals of G
MuhammadAhmad
#TradFiCFDGoldMasters
Gold CFD trading in traditional financial markets represents a sophisticated and potentially lucrative domain that allows professional traders and institutional investors to capitalize on global gold price movements without taking physical ownership of the precious metal. Gate.com has introduced an exceptional opportunity for its users where they can not only engage in professional Gold CFD trading but also earn points through the Gate Card Points System on every eligible purchase, redeemable for valuable digital assets including BTC, ETH, USDT, and GT.
Fundamentals of Gold CFD Trading and Professional Perspective
Gold CFD, or Contract for Difference, is a derivative product that enables traders to speculate on gold price movements without owning the underlying physical asset. On Gate.com, XAUUSD trading pairs are pegged to international gold prices, providing professional traders with a transparent and efficient platform. Leverage plays a crucial role in Gold CFD trading, with ratios typically ranging from 1:10 to 1:50 available to qualified traders. For instance, if a trader utilizes 1:20 leverage and opens a 10,000 USD position on XAUUSD, only 500 USD in margin capital is required, amplifying both potential returns and risks proportionally.
Analytical Strategies and Technical Indicators
Professional gold traders employ multiple technical indicators for market analysis. The Relative Strength Index (RSI) operates within the 30 to 70 range, indicating oversold conditions below 30 and overbought conditions above 70. Moving Average Convergence Divergence (MACD) confirms trend direction through signal line crossovers. Bollinger Bands measure volatility, where prices extending beyond the upper band signal overbought conditions. Fibonacci retracement levels at 23.6 percent, 38.2 percent, 50 percent, 61.8 percent, and 78.6 percent establish critical support and resistance zones for entry and exit decisions.
Gate Card Points System: Rewards on Every Purchase
Gate.com has introduced the Gate Card Points System to reward users for their participation in the Gate ecosystem. Eligible purchases made with the Gate Card earn points at fixed rates based on card tier. These points can be redeemed for digital assets including BTC, ETH, USDT, and GT, with redeemed assets credited to designated accounts for subsequent trading, wealth management, or future spending. Points remain valid indefinitely, with additional redeemable assets and benefits continuously being introduced.
Cashback rates vary by card tier as follows: Tier T0 offers 1.00 percent cashback, Tier T1 provides 1.00 percent, Tier T2 delivers 2.00 percent, Tier T3 grants 3.00 percent, Tier T4 awards 5.00 percent, and Tier T5 delivers an impressive 8.00 percent cashback rate. Monthly points cashback limits range from 500 points for T0 (equivalent to up to 5 USDT), 5,000 points for T1 (up to 50 USDT), 10,000 points for T2 (up to 100 USDT), 15,000 points for T3 (up to 150 USDT), 25,000 points for T4 (up to 250 USDT), to 40,000 points for T5 (up to 400 USDT).
Single transaction points cashback limits are structured as: T0 allows up to 200 points per transaction, T1 permits 1,500 points, T2 allows 3,000 points, T3 permits 5,000 points, T4 allows 8,000 points, and T5 permits up to 15,000 points per transaction. These limits ensure high-volume traders can maximize their rewards while maintaining system sustainability.
Card Tier Progression Requirements
Card tier determination follows either Gate VIP level or monthly card spending, with the higher benefit applying. Tier T0 is available for VIP 0 through VIP 4 with zero minimum spending required. Tier T1 requires VIP 5 through VIP 7 or minimum monthly spending of 500 USD. Tier T2 necessitates VIP 8 status or 3,000 USD monthly spending. Tier T3 requires VIP 9 or 6,000 USD monthly expenditure. Tier T4 demands VIP 10 through VIP 12 or 10,000 USD monthly spending. Tier T5, the highest tier, requires VIP 13 through VIP 14 or 15,000 USD in monthly card spending. New tier benefits become effective the following calendar month and remain valid for the entire month.
Risk Management and Capital Protection
Risk management is paramount in Gold CFD trading. Professional traders typically risk no more than 1 to 2 percent of their total trading capital on any single position. Stop-loss orders are mandatory, commonly set at 2 to 3 percent loss limits. Take-profit levels are established at 1:2 or 1:3 risk-to-reward ratios to ensure profitable expectancy over time. Portfolio diversification remains essential, with no single asset exceeding 10 percent of total investment allocation. Position sizing calculations must account for leverage multipliers to prevent excessive exposure.
Market Factors and Fundamental Analysis
Multiple factors influence gold prices. The inverse correlation between the US dollar and gold means that dollar weakness typically drives gold prices higher. Federal Reserve interest rate policies significantly impact gold attractiveness, with lower rates increasing gold's appeal as a non-yielding asset. Geopolitical tensions and economic uncertainty increase demand for gold as a safe-haven asset. Inflation hedge characteristics make gold attractive during periods of monetary expansion. Gold prices demonstrated a remarkable 48 percent year-over-year increase as of October 2025, with continued upward momentum expected based on institutional investment flows and central bank purchasing patterns.
How to Trade Gold CFD on Gate.com
Access the Gate web platform and click on TradFi in the top navigation bar to proceed to the CFD trading page. Agree to the protocol terms and open a CFD trading account. Transfer funds to the CFD account using the Transfer button at the top of the interface. Select XAUUSD or other traditional asset trading pairs from the available options. Choose your trading side, either Buy (Long) for bullish positions or Sell (Short) for bearish positions. Enter your trading amount and place your order with appropriate risk parameters. Gate TradFi trading supports App version 8.4.0 and above for mobile access.
Additional Trading Instruments and Opportunities
Beyond gold, Gate.com offers additional traditional asset CFDs including Silver (XAGUSD), Platinum (XPTUSD), WTI Crude Oil (XTIUSD), and NASDAQ 100 Index (NAS100). This diversification allows traders to construct balanced portfolios across precious metals, energy commodities, and equity indices. Cross-asset correlations can be exploited for hedging strategies, particularly during periods of market stress when gold typically outperforms while equities decline.
Institutional Investment Perspective
Institutional investors maintain strategic allocations to gold and gold-related securities for portfolio resilience. Recent surveys indicate approximately 15 percent of institutional investors currently hold gold positions, representing significant growth potential as awareness increases. Gold serves as a long-duration hedge providing portfolio protection across various adverse circumstances including inflationary and deflationary environments, equity bear markets, and sharp near-term selloffs while supporting real purchasing power across market cycles.
Maximizing Gate Card Benefits for Traders
Active traders can optimize Gate Card usage by routing all trading-related expenses through the card to accumulate maximum points. Monthly spending of 15,000 USD achieves T5 status with 8.00 percent cashback, generating up to 400 USDT in monthly rewards. At T5 level, single transactions can earn up to 15,000 points, making large purchases highly rewarding. Points can be strategically redeemed during favorable market conditions to maximize digital asset accumulation. The ability to redeem points for BTC, ETH, USDT, and GT provides flexibility for traders to align rewards with their investment strategies.
Conclusion
Gold CFD trading represents an exceptional opportunity for professional traders and institutional investors seeking exposure to precious metal price movements. Gate.com's Gate Card Points System enhances this opportunity significantly, allowing users to earn rewards not only from trading profits but also from every eligible purchase through the card. Cashback rates reaching 8.00 percent and monthly rewards up to 400 USDT make Gate.com an ideal platform for Gold CFD trading. The combination of professional-grade trading infrastructure, comprehensive risk management tools, and innovative rewards programs positions Gate.com as a leading destination for sophisticated traders seeking to maximize both trading performance and ancillary benefits.
repost-content-media
  • Reward
  • Comment
  • Repost
  • Share
#70%OffshoreRMBViaHK
Hong Kong: The World's Largest Offshore RMB Financial Hub
Hong Kong stands as the undisputed global leader in offshore Chinese Yuan (RMB) financial services, handling approximately 70% to 80% of all global offshore RMB payments, clearing, and settlement transactions. This comprehensive analysis examines the critical role Hong Kong plays in the internationalization of China's currency, supported by detailed market data, pricing metrics, volume statistics, and liquidity measurements.
Understanding the Chinese Yuan (RMB) - CNY vs CNH
The Chinese Yuan, officially known as Re
MuhammadAhmad
#70%OffshoreRMBViaHK
Hong Kong: The World's Largest Offshore RMB Financial Hub
Hong Kong stands as the undisputed global leader in offshore Chinese Yuan (RMB) financial services, handling approximately 70% to 80% of all global offshore RMB payments, clearing, and settlement transactions. This comprehensive analysis examines the critical role Hong Kong plays in the internationalization of China's currency, supported by detailed market data, pricing metrics, volume statistics, and liquidity measurements.
Understanding the Chinese Yuan (RMB) - CNY vs CNH
The Chinese Yuan, officially known as Renminbi (RMB), operates in two distinct markets. The Onshore Yuan (CNY) is China's domestic currency, controlled by the People's Bank of China (PBOC) and used exclusively within mainland China. The Offshore Yuan (CNH) represents RMB traded outside mainland China, primarily in Hong Kong, and is freely convertible in international markets. This dual-track system allows China to maintain capital controls domestically while promoting currency internationalization globally.
Hong Kong serves as the primary hub for CNH trading, offering the deepest offshore RMB liquidity pool worldwide. The distinction between CNY and CNH creates price differentials that fluctuate based on market conditions, with CNH typically trading at a slight premium or discount to CNY depending on capital flow expectations and offshore demand.
Hong Kong's Market Dominance - 70% to 80% Global Share
According to data from the Society for Worldwide Interbank Financial Telecommunication (SWIFT), Hong Kong processes approximately 75% of all RMB activity occurring outside mainland China. HSBC's Global Head of RMB Internationalization, Vina Cheung, reports that Hong Kong clears approximately 80% of global RMB payments, cementing its position as the world's largest offshore renminbi center.
This market share translates to staggering transaction volumes. In 2019 alone, RMB trade settlement handled by Hong Kong banks reached RMB 5.38 trillion, representing 89% of total global RMB cross-border trade settlement. The RMB Real Time Gross Settlement (RTGS) system in Hong Kong recorded an average daily turnover of RMB 1,100 billion in 2019, marking a 55% increase compared to 2014 levels.
RMB Deposits and Liquidity Pool - RMB 926.6 Billion
Hong Kong maintains the world's largest offshore RMB deposit pool. As of 2024, RMB deposits in Hong Kong reached RMB 926.6 billion according to the City of London RMB Business Annual Report. This figure represents a substantial capital base that supports global RMB trading activities. In 2019, Hong Kong's RMB capital pool, including customer deposits and certificates of deposit, stood at RMB 658 billion, accounting for nearly 50% of all offshore RMB deposits worldwide according to the People's Bank of China.
The depth of this liquidity pool enables Hong Kong to offer competitive pricing and efficient settlement for RMB transactions. The substantial deposit base attracts international banks, corporations, and investors seeking RMB exposure, creating a self-reinforcing cycle of liquidity concentration.
Foreign Exchange Trading Volume - USD 107.6 Billion Daily
Hong Kong dominates offshore RMB foreign exchange markets with extraordinary trading volumes. According to the Bank for International Settlements (BIS) Triennial Survey of Foreign Exchange and Derivatives Market Turnover conducted in April 2019, the average daily turnover of RMB foreign exchange transactions in Hong Kong reached USD 107.6 billion. This figure represents a monumental 39.6% increase compared to the previous 2016 survey.
The BIS data further reveals Hong Kong's commanding market share in offshore RMB FX trading. Approximately 41% of all offshore RMB foreign exchange transactions occur in Hong Kong, significantly exceeding London's 22% share and Singapore's 16% share. This concentration of trading activity generates substantial liquidity and price discovery efficiency for global RMB markets.
Interest Rate Derivatives Market - USD 12.7 Billion Daily
Beyond spot foreign exchange, Hong Kong leads in RMB-denominated derivatives trading. The BIS Triennial Survey reported that average daily turnover of RMB over-the-counter interest-rate derivatives in Hong Kong nearly doubled to USD 12.7 billion as of April 2019. This derivatives market provides essential risk management tools for institutions managing RMB interest rate exposure.
The availability of RMB futures, forwards, swaps, and options in Hong Kong enables sophisticated hedging strategies that support the currency's international adoption. Market participants can access RMB-denominated foreign exchange futures, gold futures, and commodity futures including aluminum, zinc, copper, nickel, tin, and lead contracts.
Cross-Border Trade Settlement - RMB 5.38 Trillion Annually
Hong Kong's role in facilitating China-global trade is quantified through massive settlement volumes. In 2019, RMB trade settlement handled by Hong Kong banks totaled RMB 5.38 trillion, accounting for 89% of global RMB cross-border trade settlement. This settlement infrastructure enables Chinese and international businesses to conduct trade in RMB rather than USD, reducing currency conversion costs and settlement risks.
The Stock Connect programs further amplify Hong Kong's role in cross-border investment flows. Since launching the Shanghai-Hong Kong Stock Connect in 2014 and Shenzhen-Hong Kong Stock Connect in 2016, northbound trading accumulated over RMB 21 trillion in transaction value by March 2020. These connectivity schemes channel international investment into Chinese equities while providing Chinese investors access to global markets.
Clearing Volume Statistics - RMB 1,100 Billion Daily Average
Hong Kong's RMB clearing infrastructure processes extraordinary transaction volumes. The RMB Real Time Gross Settlement system recorded average daily turnover of RMB 1,100 billion in 2019, representing a 55% increase from 2014 levels. This clearing capacity ensures efficient settlement for the vast majority of global RMB transactions.
The clearing statistics demonstrate Hong Kong's infrastructure superiority in handling RMB payments. Real-time settlement capabilities reduce counterparty risk and settlement delays that would otherwise impede RMB internationalization. The system's reliability and scale attract global banks to maintain RMB clearing operations in Hong Kong.
Comparative Market Analysis - Hong Kong vs Global Centers
Hong Kong's dominance becomes apparent when comparing global offshore RMB centers. London, the second-largest offshore RMB hub, recorded average daily CNH FX trading volume of GBP 172.7 billion (approximately USD 215 billion) in 2024, representing a 43.20% year-over-year increase. London's RMB deposits reached RMB 155.0 billion by December 2024, up 72.97% year-over-year, while outstanding RMB loans totaled RMB 118.6 billion, up 30.08% year-over-year.
Despite London's growth, Hong Kong maintains overwhelming market share in offshore RMB activities. The UK's total RMB clearing volume reached RMB 31 trillion in 2024 with average daily clearing of RMB 121.6 billion, up 45.15% year-over-year. However, these figures remain substantially smaller than Hong Kong's processing volumes.
RMB Internationalization Progress and Policy Support
China's central bank actively promotes RMB internationalization through policies supporting offshore markets. In 2026, the People's Bank of China announced measures to expand offshore RMB business in Shanghai, authorizing six banks to conduct offshore yuan transactions in the Shanghai free trade zone. Additionally, the PBOC created tools enabling overseas central banks, sovereign wealth funds, and international financial organizations to obtain RMB liquidity more easily.
Hong Kong benefits from these policies while maintaining its first-mover advantage. The city's established infrastructure, legal framework based on English common law, and proximity to mainland China create structural advantages that competing centers cannot easily replicate. The Greater Bay Area integration further strengthens Hong Kong's connectivity with Chinese markets.
Investment Products and Market Infrastructure
Hong Kong offers the most comprehensive range of offshore RMB investment products globally. Available instruments include RMB-denominated stocks, bonds, funds, insurance products, and derivative instruments. The Bond Connect program enables international investors to access China's interbank bond market through Hong Kong, with monthly trading volumes reaching RMB 893.1 billion and average daily turnover of RMB 47.0 billion.
From January to May 2026, Bond Connect trading volume totaled RMB 4.85 trillion with average daily turnover of RMB 48.99 billion. These figures demonstrate the scale of RMB-denominated investment flows channeled through Hong Kong.
Future Outlook and Growth Projections
Hong Kong's offshore RMB market continues expanding despite geopolitical challenges and economic uncertainties. The city's cross-border wealth management business reached USD 2.95 trillion in 2026, surpassing Switzerland as the world's top cross-border wealth hub according to Boston Consulting Group. This wealth concentration supports continued growth in RMB-denominated assets and transactions.
The integration of Hong Kong with China's digital yuan (e-CNY) initiatives presents additional growth opportunities. The PBOC's digital yuan operation center signed agreements with 26 financial institutions in Shanghai to promote cross-border digital currency adoption, with Hong Kong positioned to facilitate these flows.
Conclusion
Hong Kong's position as the world's largest offshore RMB financial center is quantified through overwhelming market share statistics: 70% to 80% of global offshore RMB payments, RMB 926.6 billion in deposits, USD 107.6 billion in daily FX trading volume, and RMB 5.38 trillion in annual trade settlement. These figures demonstrate Hong Kong's critical role in China's currency internationalization strategy.
The city's deep liquidity pools, comprehensive market infrastructure, and policy support from Chinese authorities ensure continued dominance in offshore RMB markets. For global businesses, investors, and financial institutions seeking RMB exposure, Hong Kong remains the primary gateway offering price efficiency, settlement reliability, and market depth unavailable elsewhere. As RMB internationalization progresses, Hong Kong's market share, while potentially facing competition from growing centers like London and Singapore, is structurally positioned to maintain leadership through its unique combination of Chinese market access and international financial standards.@Gate_Square
repost-content-media
  • Reward
  • Comment
  • Repost
  • Share
#StakeUSD1Earn8.26%APR
Maximize Your Passive Income with USD1 Staking on Gate.com: Earn 8.26% APR Through Strategic Stablecoin Investment
Gate.com has introduced an exceptional opportunity for traders, investors, and cryptocurrency enthusiasts to generate substantial passive income through the USD1 staking program, offering an impressive 8.26% Annual Percentage Rate. This innovative financial product represents a paradigm shift in how users can leverage their stablecoin holdings to create consistent returns without engaging in active trading. The USD1 staking mechanism operates on a straightf
MuhammadAhmad
#StakeUSD1Earn8.26%APR
Maximize Your Passive Income with USD1 Staking on Gate.com: Earn 8.26% APR Through Strategic Stablecoin Investment
Gate.com has introduced an exceptional opportunity for traders, investors, and cryptocurrency enthusiasts to generate substantial passive income through the USD1 staking program, offering an impressive 8.26% Annual Percentage Rate. This innovative financial product represents a paradigm shift in how users can leverage their stablecoin holdings to create consistent returns without engaging in active trading. The USD1 staking mechanism operates on a straightforward principle where participants deposit their USD1 tokens into the Gate staking protocol and receive daily distributions of rewards, creating a sustainable income stream that compounds over time.
The financial mechanics of USD1 staking demonstrate remarkable efficiency and accessibility. With a minimum entry threshold of merely 2 USD1 tokens, Gate.com has democratized access to high-yield investment opportunities. The daily payout structure provides immediate liquidity and psychological satisfaction, as participants witness their balances grow every 24 hours. This compounding frequency enhances the effective annual yield, as daily reinvestment of returns creates additional earning potential throughout the year.
Understanding the yield calculation methodology reveals the substantial wealth accumulation potential available through strategic USD1 staking. An initial investment of 1,000 USD1 at an 8.26% APR would generate approximately 82.60 USD1 in annual returns, translating to roughly 0.226 USD1 per day or 6.88 USD1 per month. When scaled to larger allocations, the mathematics become even more impressive. A 10,000 USD1 stake would yield approximately 826 USD1 annually, or 2.26 USD1 daily, while a substantial 100,000 USD1 position would generate 8,260 USD1 per year, equivalent to approximately 22.63 USD1 each day.
The risk-adjusted return profile of USD1 staking presents a compelling case for portfolio allocation. Traditional stablecoins like USDT and USDC on Gate.com offer staking yields ranging from 3.48% to 3.54% APR, making USD1's 8.26% rate represent a premium of approximately 133% to 137% above these alternatives. This yield differential of 4.72 to 4.78 percentage points creates significant value for capital allocators seeking to optimize their risk-adjusted returns. When compared to other staking opportunities on the platform, such as BTC at 2.67% APR, ETH at 4.09% APR, or GT at 0.86% APR, USD1 demonstrates superior income generation potential while maintaining the price stability characteristic of dollar-pegged assets.
The operational framework of USD1 staking on Gate.com incorporates several features that enhance user experience and capital efficiency. The flexible redemption mechanism allows participants to withdraw their staked USD1 at any time, with assets typically credited to accounts on the following day. This liquidity provision eliminates the lock-up period constraints that characterize many DeFi staking protocols. The absence of withdrawal penalties or early redemption fees further strengthens the value proposition, as users retain complete control over their capital without sacrificing yield potential for flexibility.
The security architecture underlying USD1 staking incorporates Gate.com's 100% Proof of Reserve system, ensuring that all staked assets are fully backed and protected. This transparency mechanism provides institutional-grade security assurance, with regular audits verifying the 1:1 backing of all deposited tokens. The integration with the Dolomite network for validator delegation adds an additional layer of decentralization and security to the staking infrastructure.
The economic rationale for USD1 staking extends beyond simple yield comparison to encompass broader portfolio management strategies. In an environment where inflation erodes purchasing power at rates between 3% to 6% annually in major economies, an 8.26% yield provides meaningful real return generation after accounting for purchasing power depreciation. This inflation-hedging characteristic makes USD1 staking particularly valuable for conservative investors seeking capital preservation with income generation, as well as aggressive traders looking to park profits in stable assets that continue generating returns during market consolidation periods.
The scalability of USD1 staking rewards creates compelling incentives for increased participation. Since yields are calculated based on the quantity of USD1 staked, investors who increase their allocations proportionally increase their absolute returns. A user staking 5,000 USD1 generates five times the daily income of someone staking 1,000 USD1, creating a linear relationship between capital commitment and reward generation. This scalability feature accommodates various investment strategies, from dollar-cost averaging approaches where users gradually increase stakes over time, to lump-sum deployments of accumulated capital seeking immediate yield optimization.
The comparative analysis of USD1 against alternative yield-generating assets on Gate.com reveals its competitive positioning. While ATOM offers 18.32% APR and NEO provides 16.05%, these higher yields come with the volatility risk inherent to non-stable assets. A 10% price decline in ATOM would eliminate the yield advantage entirely, whereas USD1 maintains its dollar peg, ensuring that the 8.26% return represents genuine wealth accumulation rather than nominal yield offset by capital depreciation. This risk-adjusted perspective positions USD1 staking as an optimal choice for the stable portion of any cryptocurrency portfolio.
The technical implementation of USD1 staking leverages smart contract automation to distribute rewards precisely and transparently. Daily calculations ensure that yield accrues continuously rather than in discrete intervals, eliminating timing arbitrage opportunities and ensuring fair treatment of all participants regardless of entry date. The automated distribution system removes administrative overhead and potential human error, while blockchain-based record-keeping provides immutable audit trails for all transactions and reward distributions.
For traders utilizing Gate.com's comprehensive ecosystem, USD1 staking integrates seamlessly with other platform features. Staked USD1 can serve as collateral for various trading activities, or users can maintain staking positions while utilizing other funds for active trading strategies. This capital efficiency allows sophisticated users to simultaneously generate passive income from stable holdings while pursuing alpha-generating opportunities in volatile markets. The unified account structure ensures that staking rewards compound automatically without requiring manual intervention or reinvestment transactions.
The market positioning of USD1 as a stablecoin issued by World Liberty Financial adds credibility and institutional backing to the asset. Unlike algorithmic stablecoins that rely on complex mechanisms to maintain pegs, USD1 operates with transparent reserve structures and regulatory compliance frameworks that reduce existential risk. This institutional pedigree enhances the attractiveness of USD1 staking for risk-conscious investors who prioritize capital safety alongside yield generation.
The temporal dynamics of the 8.26% APR present strategic timing considerations for potential participants. Yield rates in DeFi and CeFi environments fluctuate based on demand dynamics, protocol incentives, and market conditions. Current participants lock in the 8.26% rate, while future entrants may face different yield environments. This creates urgency for investors seeking to maximize their returns by entering during the current promotional period before potential rate adjustments occur.
The tax efficiency of USD1 staking rewards varies by jurisdiction but generally receives favorable treatment compared to trading profits in many regions. Since staking rewards represent income rather than capital gains, they may be subject to different tax rates, potentially allowing investors to retain a larger percentage of their returns after tax obligations. The income characterization of staking rewards often provides planning advantages over short-term trading profits.
The psychological benefits of USD1 staking extend beyond pure financial returns to encompass reduced portfolio stress and improved sleep quality. By generating predictable daily income from stable assets, investors reduce their dependence on volatile price appreciation for wealth building. This income stability allows for more rational decision-making in other investment areas, as the pressure to generate returns through high-risk speculation diminishes when a reliable 8.26% baseline is established through staking activities.
For institutional investors and treasury managers, USD1 staking offers a compliant and efficient method for deploying excess cash reserves. The 8.26% yield substantially exceeds money market fund returns, which typically range from 4.0% to 5.5% in current market conditions. A corporate treasury holding 500,000 USD1 would generate approximately 41,300 USD1 annually through staking, compared to roughly 22,500 USD1 to 27,500 USD1 from traditional money market instruments, representing an incremental gain of 13,800 USD1 to 18,800 USD1 annually.
The compounding mathematics of daily distributions create subtle but meaningful yield enhancement beyond the stated APR. When daily rewards are immediately restaked or reinvested, the effective annual yield exceeds the nominal 8.26% rate due to the compounding effect. A 100,000 USD1 stake compounded daily at 8.26% APR would generate approximately 8,604 USD1 after one year, compared to 8,260 USD1 under simple interest calculation, representing an additional 344 USD1 or 4.16% enhancement through compounding effects.
The accessibility features of USD1 staking on Gate.com ensure that technical complexity does not prevent participation. The one-click staking interface eliminates the need for users to interact directly with smart contracts or navigate complex DeFi interfaces. This user-friendly design opens high-yield opportunities to participants who may lack the technical expertise or time to engage with decentralized finance directly.
The competitive landscape of stablecoin yield generation positions Gate.com's USD1 offering favorably against alternatives. Centralized finance platforms typically offer 4% to 7% on stablecoins, while decentralized protocols may offer variable rates between 3% and 12% depending on token demand and incentive programs. The consistent 8.26% rate on Gate.com provides predictability that variable-rate platforms cannot match.
For retirement planning and long-term wealth accumulation, USD1 staking presents an innovative option for diversification. A 35-year-old investor who stakes 50,000 USD1 and maintains the position for 30 years, assuming the 8.26% rate remains constant and rewards are reinvested, would accumulate approximately 568,000 USD1 by retirement age. This projection illustrates the power of compound growth applied to stable assets.
The environmental considerations of USD1 staking compare favorably to proof-of-work mining or other energy-intensive yield generation methods. As a delegated proof-of-stake mechanism operating on efficient blockchain infrastructure, USD1 staking generates returns without significant energy consumption or environmental impact.. @Gate_Square
repost-content-media
  • Reward
  • Comment
  • Repost
  • Share
#GoldTops4200
Gold has successfully breached the psychological 4200 USD per ounce barrier, reaching a high of approximately 4196 USD with the current trading level around 4150 USD. This represents a significant recovery from the recent low of 3970 USD, marking a 4.53 percent gain from that trough. The precious metal continues to demonstrate remarkable strength driven by weakening United States dollar sentiment following disappointing Nonfarm Payrolls data and broader macroeconomic uncertainty.
Current Market Structure and Price Action
The immediate trading range shows gold consolidating betwe
MuhammadAhmad
#GoldTops4200
Gold has successfully breached the psychological 4200 USD per ounce barrier, reaching a high of approximately 4196 USD with the current trading level around 4150 USD. This represents a significant recovery from the recent low of 3970 USD, marking a 4.53 percent gain from that trough. The precious metal continues to demonstrate remarkable strength driven by weakening United States dollar sentiment following disappointing Nonfarm Payrolls data and broader macroeconomic uncertainty.
Current Market Structure and Price Action
The immediate trading range shows gold consolidating between 4120.50 USD and 4196.10 USD, with the 4200 USD level serving as critical psychological resistance. Technical analysts identify the next upside objective within the 4200.00 USD to 4350.00 USD resistance zone, with sustained momentum potentially targeting 4500.00 USD and subsequently 5000.00 USD. On the downside, bears require a decisive break below 4091.00 USD to establish bearish control, with deeper support targets at 4000.00 USD and 3950.00 USD.
The recovery from 3970 USD to current levels represents a 180 USD move, translating to approximately 4.53 percent appreciation. Volume analysis indicates strong institutional participation during this rally, with liquidity concentration evident around the 4150 USD pivot level. Market depth suggests substantial buying interest emerges between 4100 USD and 4120 USD, providing a defensive buffer for long positions.
Seven-Day Forecast and Key Levels
For the upcoming week commencing July 6, 2026, gold is expected to test the 4200 USD resistance with potential for extension toward 4250 USD to 4300 USD if momentum persists. Critical support levels to monitor include 4120 USD, 4091 USD, and 4050 USD. A daily close above 4200 USD would confirm bullish continuation with measured targets at 4300 USD representing 3.61 percent upside from current levels. Conversely, rejection at 4200 USD could trigger profit-taking toward 4100 USD support, representing 1.20 percent downside.
Institutional positioning data reveals hedge funds and commodity trading advisors maintaining net long positions, with JP Morgan forecasting third quarter 2026 average prices at 4300 USD per ounce and fourth quarter averages reaching 4500 USD per ounce. This implies 3.61 percent and 8.43 percent upside potential respectively from current trading levels.
Trading Strategy Recommendations
Conservative traders should consider establishing long positions on dips toward 4120 USD to 4130 USD with stop-loss protection below 4090 USD, targeting initial profits at 4200 USD and extended targets at 4250 USD. This strategy offers a risk-reward ratio of approximately 1 to 1.5 with defined downside exposure of 1.45 percent against potential upside of 2.41 percent to 4.10 percent.
Aggressive traders may initiate scaled long positions above 4200 USD on confirmed breakout with volume confirmation, utilizing 4180 USD as trailing support. Position sizing should account for maximum leverage of 20x available on Gate platform for gold CFD trading, though prudent risk management suggests utilizing 5x to 10x leverage to accommodate volatility.
For short-term scalping strategies, monitor the 4150 USD pivot for intraday directional bias. Prices holding above this level favor long positions targeting 4180 USD to 4200 USD, while sustained weakness below 4150 USD opens downside toward 4120 USD support.
Risk Management Considerations
The current macroeconomic calendar features significant event risk including Federal Reserve FOMC minutes release on July 8, 2026, and ISM Services PMI data on July 6, 2026. These events could trigger volatility expansion with spreads widening and slippage risk increasing. Traders should reduce position sizes ahead of high-impact releases and maintain adequate margin buffers above liquidation thresholds.
Gate platform offers TradFi CFD trading for XAUUSD with leverage up to 500x during promotional periods, though standard maximum leverage caps at 20x for gold during restriction periods. Margin requirements and liquidation thresholds adjust dynamically based on market conditions. Traders should activate their TradFi account and complete identity verification to access these instruments.
Market Sentiment and Institutional Flow
Geopolitical risk premiums continue supporting gold demand, with central bank accumulation providing structural underpinning. Physical demand from key Asian markets remains robust, though JP Morgan notes near-term demand softness may cap gains temporarily. The correlation between gold and real yields has reasserted, with declining Treasury yields supporting precious metals pricing.
The current market structure favors dip-buying strategies over aggressive shorting given the established uptrend from 3970 USD lows. Traders should await confirmation signals before committing significant capital, utilizing the 4200 USD level as the immediate decision point for directional bias over the coming seven trading sessions.@Gate_Square
repost-content-media
  • Reward
  • Comment
  • Repost
  • Share
#BitcoinWhalesAdd270KInTwoWeeks
Bitcoin whales, defined as large institutional investors and high-net-worth individuals holding substantial quantities of Bitcoin, have executed one of the most aggressive accumulation phases in recent market history by purchasing approximately 270,000 BTC within a mere two-week timeframe. This massive accumulation represents a dollar value ranging between $16.7 billion and $29.7 billion depending on the average purchase price, with calculations based on current market valuations hovering around $62,000 to $63,000 per Bitcoin. The sheer scale of this whale acti
BTC0.74%
MuhammadAhmad
#BitcoinWhalesAdd270KInTwoWeeks
Bitcoin whales, defined as large institutional investors and high-net-worth individuals holding substantial quantities of Bitcoin, have executed one of the most aggressive accumulation phases in recent market history by purchasing approximately 270,000 BTC within a mere two-week timeframe. This massive accumulation represents a dollar value ranging between $16.7 billion and $29.7 billion depending on the average purchase price, with calculations based on current market valuations hovering around $62,000 to $63,000 per Bitcoin. The sheer scale of this whale activity signals significant long-term confidence among sophisticated market participants who possess the capital and analytical capabilities to make informed decisions about Bitcoin's future trajectory.
The timing of this accumulation is particularly noteworthy because it occurred during a period when U.S. spot Bitcoin exchange-traded funds experienced their worst monthly performance since inception, bleeding approximately $4.06 billion in outflows during June 2026. This divergence between institutional ETF selling and direct whale accumulation suggests that large holders are bypassing traditional investment vehicles to acquire Bitcoin directly, potentially indicating superior conviction in the underlying asset rather than derivative products. Historical data demonstrates that whale accumulation during periods of retail fear and institutional outflows has preceded major price recoveries in previous market cycles, specifically during 2015, 2019, and 2020.
Exchange reserves have simultaneously declined to approximately 2.21 million BTC, representing a seven-year low and constituting merely 5.88% of the total circulating supply. This metric carries substantial significance because exchange reserves serve as a proxy for available sell-side liquidity. When exchange reserves decline while whale holdings increase, the market experiences a supply squeeze that can exert upward pressure on prices. The current exchange reserve level marks the lowest percentage of circulating supply held on exchanges since December 2017, indicating that less Bitcoin is available for immediate sale than at almost any point during the past decade.
From a supply-demand perspective, the 270,000 BTC accumulation represents approximately 1.37% of Bitcoin's total circulating supply of approximately 19.7 million coins. When combined with the exchange reserve decline, the effective liquid supply available for trading has diminished significantly. Bitcoin's fixed supply cap of 21 million coins means that any sustained accumulation by large holders permanently removes supply from circulation, creating structural scarcity that can amplify price movements during periods of renewed demand. The halving event that occurred in April 2024 reduced block rewards from 6.25 BTC to 3.125 BTC, further constraining new supply issuance to approximately 450 BTC daily or 164,250 BTC annually.
Current market price action shows Bitcoin recovering from a June low near $57,000 to approximately $63,000, representing a gain of approximately 10.53% from the recent bottom. This recovery aligns with historical seasonal patterns, as July has historically delivered average returns of 7.6% for Bitcoin according to CoinGlass data. Technical analysis indicates resistance levels between $64,000 and $68,000, with the critical $70,000 threshold representing the Short-Term Holder Realized Price and serving as a potential trend reversal confirmation point. Analyst projections suggest that a sustained breakout above $70,000 could propel Bitcoin toward $75,000 by late July, representing an additional 18.75% gain from current levels.
The whale accumulation carries multiple implications for different market participants. For long-term holders, this activity reinforces the thesis that Bitcoin remains undervalued at current prices, with sophisticated investors willing to deploy billions in capital despite short-term volatility. For active traders, the supply dynamics suggest that any resurgence in retail or institutional demand could trigger rapid price appreciation due to the reduced liquid supply available on exchanges. Risk management considerations remain essential, as macroeconomic factors including Federal Reserve policy decisions, inflation readings, and global economic conditions continue to influence risk asset valuations including cryptocurrencies.
Market sentiment indicators show mixed signals, with the Crypto Fear and Greed Index fluctuating between fear and neutral territory, suggesting that retail participants remain cautious despite whale accumulation. Derivatives markets display lower futures volumes but steady open interest, indicating that leveraged positions have been reduced from earlier highs, potentially creating a more stable foundation for future price movements. Options market data reveals call-heavy positioning before upcoming Federal Reserve communications, with expectations for Bitcoin to test higher price levels.
The 270,000 BTC accumulation over two weeks translates to an average daily purchase rate of approximately 19,286 BTC, significantly exceeding the daily issuance rate of 450 BTC following the most recent halving. This accumulation-to-issuance ratio of approximately 42.86 to 1 demonstrates that whale buying has absorbed nearly 43 times the new supply entering the market, creating a substantial supply deficit that must be satisfied from existing holder inventories. Such dynamics historically precede extended bull market phases as the available supply becomes increasingly illiquid.
For traders and investors evaluating entry points, the current price structure offers several reference levels. Support exists near $60,000, which served as a psychological floor during recent declines, while the $57,000 level represents the recent swing low that triggered this recovery. Resistance levels include $64,000, $66,000, $68,000, and the critical $70,000 threshold. A measured move calculation based on the recovery from $57,000 to $63,000 projects potential upside toward $69,000, representing a 9.52% additional gain from current levels.
The whale accumulation narrative aligns with broader institutional adoption trends, including corporate treasury strategies, nation-state accumulation, and the development of Bitcoin-based financial products. Strategy, formerly MicroStrategy, holds approximately 847,363 BTC acquired at an average cost basis of $75,651 per coin, demonstrating continued institutional conviction despite current prices trading below their average entry point. This institutional positioning, combined with whale accumulation, creates a foundation of strong hands that reduces the probability of severe downside volatility.
In conclusion, the accumulation of 270,000 BTC by whales over two weeks represents a historically significant market event that signals strong long-term conviction among sophisticated investors. The confluence of reduced exchange reserves, constrained new supply issuance, and aggressive whale buying creates favorable supply-demand dynamics that could support continued price appreciation. While short-term volatility remains likely, particularly around key resistance levels, the underlying structural factors suggest that Bitcoin maintains significant upside potential with targets toward $70,000 and beyond achievable in the coming months. Traders should monitor exchange reserve data, whale wallet movements, and macroeconomic developments to assess the sustainability of this accumulation trend and its implications for price trajectory.
@Gate_Square
repost-content-media
  • Reward
  • Comment
  • Repost
  • Share
#VitalikUnveilsLeanEthereum
1. Introduction to Lean Ethereum
Vitalik Buterin unveiled the "Lean Ethereum" roadmap on July 4, 2026, following extensive research meetings in Berlin. This represents the third major evolution of the Ethereum protocol, following The Merge, and outlines a comprehensive vision for Ethereum's development through 2030. The roadmap emphasizes protocol simplification, enhanced scalability, and post-quantum cryptography integration.
Core Components of Lean Ethereum:
The Lean Ethereum initiative encompasses several critical technical upgrades. Recursive STARK verification
MuhammadAhmad
#VitalikUnveilsLeanEthereum
1. Introduction to Lean Ethereum
Vitalik Buterin unveiled the "Lean Ethereum" roadmap on July 4, 2026, following extensive research meetings in Berlin. This represents the third major evolution of the Ethereum protocol, following The Merge, and outlines a comprehensive vision for Ethereum's development through 2030. The roadmap emphasizes protocol simplification, enhanced scalability, and post-quantum cryptography integration.
Core Components of Lean Ethereum:
The Lean Ethereum initiative encompasses several critical technical upgrades. Recursive STARK verification will replace direct re-execution in the verification process, potentially reducing gas fees by up to 10 times for certain transactions. Multidimensional gas fee structures will move beyond single-factor pricing to consider computation, storage, and data availability simultaneously, enabling more efficient network congestion management. Post-quantum cryptography implementation targets completion by 2029, ensuring Ethereum remains secure against quantum computing threats. Additionally, a new state architecture will restructure blockchain data organization to support higher scalability.
The Ethereum Foundation has committed to significant operational changes, announcing a 40% budget reduction to transition toward an endowment-style model. Annual spending will decrease from approximately 15% of treasury assets to a target of 5% by 2030, demonstrating long-term sustainability commitment.
2. Current Ethereum Market Position and Technical Analysis
As of July 6, 2026, Ethereum trades in the $1,732 to $1,770 range, representing an 18% recovery from the $1,500 support level tested recently. This upward movement reflects positive market sentiment following the Lean Ethereum announcement and continued institutional accumulation.
Price Performance Metrics:
Ethereum has declined approximately 66% from its 2025 highs near $5,100, yet maintains strong fundamental positioning. The recent recovery from $1,500 to $1,770 demonstrates resilient buying pressure at key support levels. Current trading volume indicates healthy market participation, with institutional flows contributing significantly to price stability.
Technical Support and Resistance Analysis:
Primary support establishes at $1,500, representing a strong psychological level where substantial buying emerged recently. Secondary support exists at $1,400, marking historical accumulation zones from previous market cycles. Tertiary support at $1,000 would only activate under extreme bearish scenarios involving broader market capitulation.
Immediate resistance targets $1,865, corresponding to the 50-day exponential moving average. Major psychological resistance sits at $2,000, a level that previously triggered significant profit-taking. Strong resistance between $2,335 and $2,400 marks previous whale accumulation zones where substantial supply exists. Long-term technical analysis identifies $2,750 as a major resistance level based on historical price action.
3. Institutional Accumulation: Sharp Link and BMNR Analysis
Sharp Link (SBET) Ethereum Holdings:
Sharp Link currently holds 886,725 ETH, positioning as the second-largest corporate Ethereum treasury globally. Recent acquisition activity includes 10,000 ETH purchased at an average price of $1,611 per ETH, representing a $16.11 million investment. An additional 5,000 ETH acquisition worth $7.85 million occurred through FalconX brokerage. Despite these substantial purchases, Sharp Link reports an unrealized loss of approximately $1.8 billion on their Ethereum holdings, reflecting the broader market decline from previous highs.
Bitmine Immersion (BMNR) Market Position:
Bitmine Immersion maintains the largest corporate Ethereum position globally, holding 5.67 million ETH as of mid-June 2026. This represents 3.45% of total ETH supply, making BMNR one of the most significant market participants. The scale of institutional accumulation by BMNR and Sharp Link combined exceeds 6.5 million ETH, demonstrating conviction among major players regarding Ethereum's long-term value proposition.
Whale Accumulation Patterns:
On-chain analytics reveal substantial whale activity, with large wallet holdings increasing from 13.77 million ETH to 13.98 million ETH within 96 hours, representing $322 million in purchases. A single whale address acquired 50,537 ETH worth $162 million within 24 hours. Since June 2025, institutional participants have accumulated 3.8% of total ETH supply, indicating strong conviction despite price volatility.
4. Seven-Day Price Forecast and Trading Strategy
Bullish Scenario (60% Probability):
The bullish case projects Ethereum reaching $2,000 to $2,100 within 7 days, driven by sustained positive sentiment from the Lean Ethereum announcement and continued institutional buying. This scenario would generate 13% to 18% gains from current levels. Key catalysts include successful technical implementation announcements and broader market stability.
Base Case Scenario (30% Probability):
The base case anticipates price consolidation between $1,700 and $1,900 as markets digest new information. This range-bound movement allows accumulation for long-term participants while providing short-term trading opportunities within established support and resistance levels.
Bearish Scenario (10% Probability):
A bearish outcome would test support at $1,500 to $1,600, potentially triggered by broader market corrections or unexpected technical delays in roadmap implementation. This scenario remains unlikely given current institutional support and positive sentiment.
Trading Strategy Framework:
For short-term traders operating on 1 to 7 day timeframes, optimal entry zones range between $1,730 and $1,750. Initial profit targets establish at $1,865, representing the 50-day EMA resistance and offering 6.5% potential returns. Secondary targets at $2,000 provide 14.3% potential gains while representing significant psychological resistance. Risk management requires stop-loss placement at $1,680, limiting downside to 3.4% and establishing favorable risk-reward ratios of 1:4.2.
Position sizing recommendations vary by risk tolerance: conservative allocation suggests 5% of portfolio exposure, moderate approaches utilize 10%, while aggressive strategies may deploy up to 15% of available capital.
5. Long-Term Outlook and Price Targets
Institutional Price Predictions:
Standard Chartered analysts project Ethereum reaching $7,500 by year-end 2026, citing Ethereum's dominance in stablecoins and DeFi, institutional accumulation trends, and anticipated Fusaka network upgrades. More aggressive scenarios target $12,000 contingent upon successful 10x Layer 1 throughput increases as outlined in Vitalik Buterin's roadmap. Current probability assessments assign 14% likelihood to $10,000 achievement by December 2026.
Technical Implementation Timeline:
The Lean Ethereum roadmap spans 3 to 4 years, with major milestones scheduled through 2030. Recursive STARK verification implementation will proceed gradually, allowing ecosystem adaptation. Post-quantum cryptography targets 2029 completion, ensuring security against emerging quantum threats. This extended timeline supports gradual price appreciation rather than immediate explosive growth.
6. Risk Assessment and Mitigation
Technical Implementation Risks:
Historical precedent suggests major upgrades do not immediately impact price performance. The Merge and Layer 2 scaling implementations failed to reverse Ethereum's price decline despite technical success. Lean Ethereum's 3 to 4 year implementation timeline means immediate price effects remain limited, with benefits accruing gradually as each component activates.
Market Structure Risks:
Ethereum remains 66% below 2025 highs, indicating significant overhead supply exists. Macroeconomic conditions including Federal Reserve policy decisions, inflation data, and global risk appetite continue influencing cryptocurrency markets substantially. Competition from alternative Layer 1 networks, particularly Solana, presents ongoing market share challenges.
Whale Behavior Patterns:
Recent on-chain data reveals mixed whale activity, with early holders distributing positions near $2,300 to $2,400 resistance levels. Active whales maintain leveraged positions worth $620 million at 5x leverage, indicating sophisticated risk management approaches. This mixed behavior suggests selective profit-taking rather than wholesale abandonment of Ethereum positions.
7. Conclusion and Actionable Recommendations
Vitalik Buterin's Lean Ethereum initiative represents a fundamentally positive development for Ethereum's long-term viability. The technical improvements outlined, including recursive STARKs, multidimensional gas fees, and quantum-resistant cryptography, position Ethereum for sustained competitive advantage through 2030.
Immediate Action Plan:
Traders should consider initiating positions within the $1,730 to $1,750 entry zone, with profit-taking targets at $1,865 (25% of position) and $2,000 (additional 25% of position). Remaining holdings should be maintained for long-term appreciation through 2029 as Lean Ethereum components activate sequentially.
Key Monitoring Points:
Successful breakthrough above $1,865 confirms bullish momentum with next target $2,000. Failure to maintain support at $1,680 signals potential bearish continuation toward $1,500. Volume analysis provides critical confirmation, with spikes above 150% of average daily volume indicating genuine trend strength.
Final Assessment:
Lean Ethereum establishes Ethereum's technical foundation for the next decade while addressing scalability, efficiency, and security concerns. Short-term price action remains influenced by macro factors and technical resistance levels, but institutional accumulation at current prices suggests strong underlying demand. The convergence of technical improvements and institutional adoption creates favorable conditions for long-term value appreciation, with $2,000 representing the immediate psychological barrier and $7,500 serving as the year-end institutional target.@Gate_Square
repost-content-media
  • Reward
  • Comment
  • Repost
  • Share
#gStocksTokenizedStocksLive Gate has officially launched its gStocks tokenized securities service, backed by a strict 1:1 reserve of underlying native stocks. Every gStocks token in circulation is backed by an equivalent amount of the underlying physical stock, ensuring 100% collateralization at all times. If you hold a gStocks token representing Apple shares valued at approximately $250, your token is fully backed by a real Apple stock held in reserve, and the token price tracks the native stock price with near-perfect precision. The 1:1 full reserve standard eliminates any gap between the d
MuhammadAhmad
#gStocksTokenizedStocksLive Gate has officially launched its gStocks tokenized securities service, backed by a strict 1:1 reserve of underlying native stocks. Every gStocks token in circulation is backed by an equivalent amount of the underlying physical stock, ensuring 100% collateralization at all times. If you hold a gStocks token representing Apple shares valued at approximately $250, your token is fully backed by a real Apple stock held in reserve, and the token price tracks the native stock price with near-perfect precision. The 1:1 full reserve standard eliminates any gap between the digital token and the physical asset, giving users complete confidence that their digital position is anchored to tangible equity.
The gStocks service currently supports over 70 tokenized stocks with continuous expansion. The initial launch included 15 tokenized securities trading pairs covering globally sought-after stocks such as Micron, AMD, SanDisk, and SpaceX. The platform covers U.S., Hong Kong, and Korean stock markets, making Gate one of the first in the industry to offer 24/7 trading across three major global equity markets totaling approximately $50 trillion in combined market capitalization accessible from a single unified account.
Trading operates 24/7, meaning you can buy and sell tokenized stocks around the clock regardless of traditional market hours. Traditional exchanges operate approximately 6.5 hours per day across 252 trading days, totaling roughly 1,638 hours annually. gStocks offers 8,760 hours of annual trading availability, a 533% increase in trading window access. Critical market events occurring outside traditional hours can be acted upon immediately rather than waiting for the next session. For a trader managing a $10,000 portfolio, this continuous access can represent the difference between capturing or missing a 5% overnight movement worth $500.
The order book trading model mirrors the familiar crypto experience with zero learning curve. The standard trading fee is 0.1% of trade value, meaning a $1,000 trade incurs only $1 in commission, compared to traditional brokerages charging 0.25% to 0.5% where the same trade costs $2.50 to $5.00. Over 100 trades averaging $1,000, traditional fees at 0.5% accumulate to $500, while Gate at 0.1% accumulates only $100, an 80% reduction in trading costs. There are no funding fees, rollover fees, or overnight financing charges, making total holding cost essentially limited to the 0.2% round-trip entry and exit fee.
Gate has launched stock transfer for U.S. and Hong Kong stocks with zero transfer fees both in and out, eliminating the typical $25 to $75 per transfer charged by conventional brokers. Consolidating 10 positions saves between $250 and $750 in transfer fees alone. The free 1:1 bidirectional conversion between native stocks and tokenized securities ensures seamless movement between formats without conversion premiums.
Fractional ownership starts from 1 USDT, making it accessible at every capital level. A single Nvidia share at approximately $120 requires $120 minimum on a traditional exchange, but through gStocks fractional trading, a trader can invest just 1 USDT owning approximately 0.00833 shares. A $500 capital allocation can diversify across 10 stocks at $50 each, whereas on a traditional exchange that same $500 might purchase only one or two full shares of a single company.
Gate is the first platform globally to launch a futures market for tokenized stocks, establishing a fully closed-loop trading infrastructure. Users can apply leverage and execute two-way strategies including long and short positions on U.S. stocks under a USDT pricing system. With 10x leverage, a $1,000 capital position accesses up to $10,000 in market exposure. Short selling through futures allows traders to profit from declining markets, capturing a $1,000 profit on a $10,000 short position when correctly identifying a 10% price decline, representing a 100% return on committed capital.
Held gStocks tokens can be directly used as margin for leveraged collateralized loans. A user holding $5,000 in gStocks Apple tokens can pledge them as collateral to borrow up to approximately $3,500 at a 70% loan-to-value ratio, accessing liquidity without selling their position. The borrowed funds can be deployed into crypto trading or additional investments, effectively allowing the same capital to serve dual purposes simultaneously within a unified account.
Integration with Gate's wealth management tools, including Simple Earn, enables gStocks holders to earn passive returns on idle stock positions. Tokenized securities can participate in flexible yield generation with one click. If a user holds $10,000 in gStocks tokens earning a 3% annualized yield, that generates approximately $300 per year, or roughly $0.82 per day, without selling or actively managing the position. Over 5 years, compounding accumulates approximately $1,592.74 in total yield, a 15.9% cumulative return on top of any price appreciation.
Auto-settled dividends ensure that when the underlying company distributes dividends, the equivalent value is automatically credited to gStocks holders. If Apple declares a quarterly dividend of $0.25 per share, a holder of 100 tokens receives $25 per quarter automatically, totaling approximately $100 annually, with zero administrative effort and 100% dividend capture rate.
The gStocks service supports trading bots and grid strategies for automated systematic approaches. A grid strategy on a stock oscillating between $240 and $260 can capture approximately 10 increments per cycle at roughly 0.83% profit per trade, yielding approximately 8.3% per cycle. Over 50 cycles annually, cumulative grid profit can approach approximately 415% on deployed capital minus fees.
The institutional API channel supports futures hedging, cross-platform liquidity hedging, and professional strategies. Delta-neutral hedging offsets directional risk while capturing funding rate differentials or dividend yields. Cross-platform arbitrage exploiting a 0.8% price discrepancy on $100,000 volume generates approximately $800 in near-risk-free profit per cycle.
Gate recently recorded over 80,000 participants and more than 9,500 teams in WCTC S8, generating over $50 billion in weighted trading volume, with CFD volume alone exceeding $140 billion. The platform supports over 440 CFD assets alongside its expanding tokenized stocks offering, ensuring tokenized stock traders benefit from proven infrastructure handling billions in daily volume.
In summary, Gate gStocks tokenized stocks live represents the most comprehensive bridge between cryptocurrency and global equity markets available today. The combination of 1:1 reserve backing, 24/7 trading across three markets, fractional ownership from 1 USDT, 0.1% fees, zero transfer fees, auto-settled dividends, Simple Earn yield, leveraged margin, the world's first tokenized stock futures market, institutional API access, and automated trading support creates an ecosystem where every dollar works harder and every hour delivers more opportunity. For traders diversifying beyond crypto, investors earning yield on equity positions, and all users managing stocks and digital assets on a single platform, Gate gStocks is the definitive solution.@Gate_Square
repost-content-media
  • Reward
  • Comment
  • Repost
  • Share
#PredictWorldCup🇵🇹vs🇪🇸
Portugal vs Spain - FIFA World Cup 2026 Round of 16 Match Prediction
This Iberian Derby showdown takes place on July 6, 2026, at AT&T Stadium. The match represents a direct pathway to the semifinals for both teams. Spain, known as La Roja, entered the tournament as one of the favorites from the start. Portugal, Selecao das Quinas, secured their Round of 16 spot by defeating Croatia 2-1. Spain dismantled Austria 3-0 and remains unbeaten in the tournament.
According to Polymarket prediction market data, Spain enters this match as the slight favorite. Market consensus
MuhammadAhmad
#PredictWorldCup🇵🇹vs🇪🇸
Portugal vs Spain - FIFA World Cup 2026 Round of 16 Match Prediction
This Iberian Derby showdown takes place on July 6, 2026, at AT&T Stadium. The match represents a direct pathway to the semifinals for both teams. Spain, known as La Roja, entered the tournament as one of the favorites from the start. Portugal, Selecao das Quinas, secured their Round of 16 spot by defeating Croatia 2-1. Spain dismantled Austria 3-0 and remains unbeaten in the tournament.
According to Polymarket prediction market data, Spain enters this match as the slight favorite. Market consensus indicates that Spain has maintained a clean sheet record through four tournament matches. Mikel Oyarzabal delivered a brace against Austria. Spain's defensive line has allowed only three shots on target throughout the tournament, demonstrating their defensive solidity. Spain's price trades around 51 cents, representing a 51 percent implied probability.
Portugal's underdog status stems from recent form gaps and Spain's unbeaten run. Portugal possesses the presence of Cristiano Ronaldo, who at 41 years of age has already scored four goals in three matches at the 2026 FIFA World Cup. Portugal manager Roberto Martinez turned the match against Croatia through strategic substitutions. Unlocking Bruno Fernandes remains crucial for their creative abilities. Rafael Leao and Pedro Neto can provide threats from the wings.
Spain's team plays under Luis de la Fuente in either a 4-3-3 or 4-2-3-1 formation. Rodri anchors the midfield. Pedri and Dani Olmo handle creative responsibilities. Lamine Yamal, at just 18 years of age, has already scored his first World Cup goal. His pace and dribbling ability could become a threat to Portugal's defense. Aymeric Laporte and Pau Cubarsi occupy center back positions. Marc Cucurella provides attacking support from left back.
Portugal's likely lineup features Diogo Costa in goal. The defense includes Joao Cancelo, Ruben Dias, Renato Veiga, and Nuno Mendes. The midfield consists of Vitinha, Joao Neves, and Bruno Fernandes. The attack features Pedro Neto, Cristiano Ronaldo, and Rafael Leao. Spain's likely lineup has Unai Simon in goal. The defense includes Pedro Porro, Aymeric Laporte, Pau Cubarsi, and Marc Cucurella. The midfield consists of Rodri, Dani Olmo, and Pedri. The attack features Lamine Yamal, Mikel Oyarzabal, and Alex Baena.
The last meeting between these two teams ended in a 2-2 draw. Portugal defeated Spain in the 2025 Nations League final to claim the title. Therefore, this match represents a revenge opportunity for Spain. The Ronaldo versus Yamal head-to-head represents a symbolic era transition. The 41-year-old veteran faces the 18-year-old teenage sensation.
According to Polymarket data, Spain holds a 51 percent winning probability. The draw probability stands at 26 percent. Portugal's winning probability is 23 percent. These odds reflect Spain's defensive strength and unbeaten run. Spain's total tournament volume of 167.6 million dollars demonstrates their popularity.
Match predictions give Spain a slight edge due to their defensive solidity and balanced team performance. However, Portugal possesses Ronaldo's experience and knockout match knowledge. Martinez's tactical flexibility and substitution strategy could change the match outcome. If Portugal disrupts Spain's midfield dominance, the underdogs could deliver a surprise.
The final prediction is a 2-1 victory for Spain. Spain's defense can contain Portugal's attacks while Yamal and Oyarzabal can create scoring opportunities. A goal from Ronaldo can be expected, but Spain's overall balance could carry them to the quarterfinals. The match could go to a draw and potentially to penalties where experience becomes a factor.@Gate_Square
repost-content-media
  • Reward
  • Comment
  • Repost
  • Share
  • Pinned