GateUser-5caa169c

vip
Age 0.2 Year
Peak Tier 0
No content yet
#70%OffshoreRMBViaHK
Hong Kong: The World's Largest Offshore RMB Financial Hub
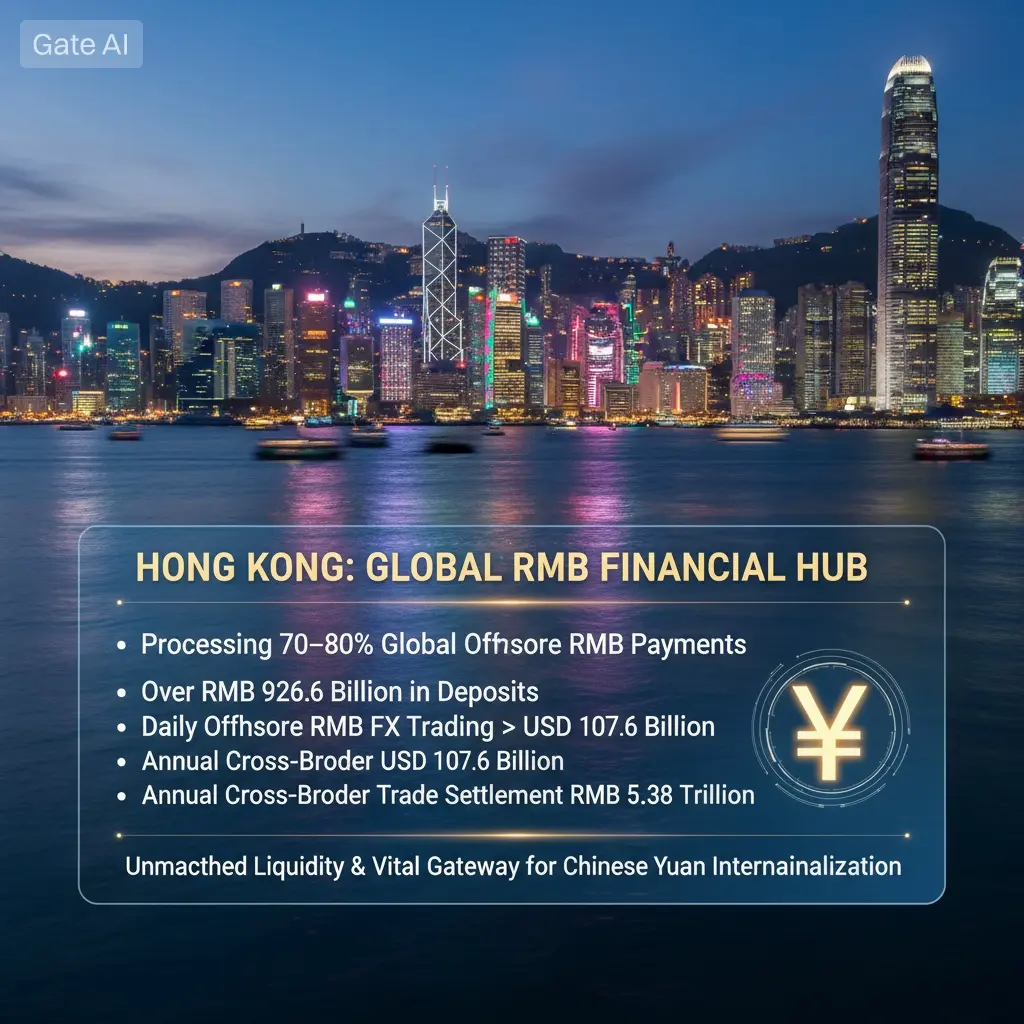
Hong Kong stands as the undisputed global leader in offshore Chinese Yuan (RMB) financial services, handling approximately 70% to 80% of all global offshore RMB payments, clearing, and settlement transactions. This comprehensive analysis examines the critical role Hong Kong plays in the internationalization of China's currency, supported by detailed market data, pricing metrics, volume statistics, and liquidity measurements.
Understanding the Chinese Yuan (RMB) - CNY vs CNH
The Chinese Yuan, officially known as Re
HighAmbition
#70%OffshoreRMBViaHK
Hong Kong: The World's Largest Offshore RMB Financial Hub
Hong Kong stands as the undisputed global leader in offshore Chinese Yuan (RMB) financial services, handling approximately 70% to 80% of all global offshore RMB payments, clearing, and settlement transactions. This comprehensive analysis examines the critical role Hong Kong plays in the internationalization of China's currency, supported by detailed market data, pricing metrics, volume statistics, and liquidity measurements.
Understanding the Chinese Yuan (RMB) - CNY vs CNH
The Chinese Yuan, officially known as Renminbi (RMB), operates in two distinct markets. The Onshore Yuan (CNY) is China's domestic currency, controlled by the People's Bank of China (PBOC) and used exclusively within mainland China. The Offshore Yuan (CNH) represents RMB traded outside mainland China, primarily in Hong Kong, and is freely convertible in international markets. This dual-track system allows China to maintain capital controls domestically while promoting currency internationalization globally.
Hong Kong serves as the primary hub for CNH trading, offering the deepest offshore RMB liquidity pool worldwide. The distinction between CNY and CNH creates price differentials that fluctuate based on market conditions, with CNH typically trading at a slight premium or discount to CNY depending on capital flow expectations and offshore demand.
Hong Kong's Market Dominance - 70% to 80% Global Share
According to data from the Society for Worldwide Interbank Financial Telecommunication (SWIFT), Hong Kong processes approximately 75% of all RMB activity occurring outside mainland China. HSBC's Global Head of RMB Internationalization, Vina Cheung, reports that Hong Kong clears approximately 80% of global RMB payments, cementing its position as the world's largest offshore renminbi center.
This market share translates to staggering transaction volumes. In 2019 alone, RMB trade settlement handled by Hong Kong banks reached RMB 5.38 trillion, representing 89% of total global RMB cross-border trade settlement. The RMB Real Time Gross Settlement (RTGS) system in Hong Kong recorded an average daily turnover of RMB 1,100 billion in 2019, marking a 55% increase compared to 2014 levels.
RMB Deposits and Liquidity Pool - RMB 926.6 Billion
Hong Kong maintains the world's largest offshore RMB deposit pool. As of 2024, RMB deposits in Hong Kong reached RMB 926.6 billion according to the City of London RMB Business Annual Report. This figure represents a substantial capital base that supports global RMB trading activities. In 2019, Hong Kong's RMB capital pool, including customer deposits and certificates of deposit, stood at RMB 658 billion, accounting for nearly 50% of all offshore RMB deposits worldwide according to the People's Bank of China.
The depth of this liquidity pool enables Hong Kong to offer competitive pricing and efficient settlement for RMB transactions. The substantial deposit base attracts international banks, corporations, and investors seeking RMB exposure, creating a self-reinforcing cycle of liquidity concentration.
Foreign Exchange Trading Volume - USD 107.6 Billion Daily
Hong Kong dominates offshore RMB foreign exchange markets with extraordinary trading volumes. According to the Bank for International Settlements (BIS) Triennial Survey of Foreign Exchange and Derivatives Market Turnover conducted in April 2019, the average daily turnover of RMB foreign exchange transactions in Hong Kong reached USD 107.6 billion. This figure represents a monumental 39.6% increase compared to the previous 2016 survey.
The BIS data further reveals Hong Kong's commanding market share in offshore RMB FX trading. Approximately 41% of all offshore RMB foreign exchange transactions occur in Hong Kong, significantly exceeding London's 22% share and Singapore's 16% share. This concentration of trading activity generates substantial liquidity and price discovery efficiency for global RMB markets.
Interest Rate Derivatives Market - USD 12.7 Billion Daily
Beyond spot foreign exchange, Hong Kong leads in RMB-denominated derivatives trading. The BIS Triennial Survey reported that average daily turnover of RMB over-the-counter interest-rate derivatives in Hong Kong nearly doubled to USD 12.7 billion as of April 2019. This derivatives market provides essential risk management tools for institutions managing RMB interest rate exposure.
The availability of RMB futures, forwards, swaps, and options in Hong Kong enables sophisticated hedging strategies that support the currency's international adoption. Market participants can access RMB-denominated foreign exchange futures, gold futures, and commodity futures including aluminum, zinc, copper, nickel, tin, and lead contracts.
Cross-Border Trade Settlement - RMB 5.38 Trillion Annually
Hong Kong's role in facilitating China-global trade is quantified through massive settlement volumes. In 2019, RMB trade settlement handled by Hong Kong banks totaled RMB 5.38 trillion, accounting for 89% of global RMB cross-border trade settlement. This settlement infrastructure enables Chinese and international businesses to conduct trade in RMB rather than USD, reducing currency conversion costs and settlement risks.
The Stock Connect programs further amplify Hong Kong's role in cross-border investment flows. Since launching the Shanghai-Hong Kong Stock Connect in 2014 and Shenzhen-Hong Kong Stock Connect in 2016, northbound trading accumulated over RMB 21 trillion in transaction value by March 2020. These connectivity schemes channel international investment into Chinese equities while providing Chinese investors access to global markets.
Clearing Volume Statistics - RMB 1,100 Billion Daily Average
Hong Kong's RMB clearing infrastructure processes extraordinary transaction volumes. The RMB Real Time Gross Settlement system recorded average daily turnover of RMB 1,100 billion in 2019, representing a 55% increase from 2014 levels. This clearing capacity ensures efficient settlement for the vast majority of global RMB transactions.
The clearing statistics demonstrate Hong Kong's infrastructure superiority in handling RMB payments. Real-time settlement capabilities reduce counterparty risk and settlement delays that would otherwise impede RMB internationalization. The system's reliability and scale attract global banks to maintain RMB clearing operations in Hong Kong.
Comparative Market Analysis - Hong Kong vs Global Centers
Hong Kong's dominance becomes apparent when comparing global offshore RMB centers. London, the second-largest offshore RMB hub, recorded average daily CNH FX trading volume of GBP 172.7 billion (approximately USD 215 billion) in 2024, representing a 43.20% year-over-year increase. London's RMB deposits reached RMB 155.0 billion by December 2024, up 72.97% year-over-year, while outstanding RMB loans totaled RMB 118.6 billion, up 30.08% year-over-year.
Despite London's growth, Hong Kong maintains overwhelming market share in offshore RMB activities. The UK's total RMB clearing volume reached RMB 31 trillion in 2024 with average daily clearing of RMB 121.6 billion, up 45.15% year-over-year. However, these figures remain substantially smaller than Hong Kong's processing volumes.
RMB Internationalization Progress and Policy Support
China's central bank actively promotes RMB internationalization through policies supporting offshore markets. In 2026, the People's Bank of China announced measures to expand offshore RMB business in Shanghai, authorizing six banks to conduct offshore yuan transactions in the Shanghai free trade zone. Additionally, the PBOC created tools enabling overseas central banks, sovereign wealth funds, and international financial organizations to obtain RMB liquidity more easily.
Hong Kong benefits from these policies while maintaining its first-mover advantage. The city's established infrastructure, legal framework based on English common law, and proximity to mainland China create structural advantages that competing centers cannot easily replicate. The Greater Bay Area integration further strengthens Hong Kong's connectivity with Chinese markets.
Investment Products and Market Infrastructure
Hong Kong offers the most comprehensive range of offshore RMB investment products globally. Available instruments include RMB-denominated stocks, bonds, funds, insurance products, and derivative instruments. The Bond Connect program enables international investors to access China's interbank bond market through Hong Kong, with monthly trading volumes reaching RMB 893.1 billion and average daily turnover of RMB 47.0 billion.
From January to May 2026, Bond Connect trading volume totaled RMB 4.85 trillion with average daily turnover of RMB 48.99 billion. These figures demonstrate the scale of RMB-denominated investment flows channeled through Hong Kong.
Future Outlook and Growth Projections
Hong Kong's offshore RMB market continues expanding despite geopolitical challenges and economic uncertainties. The city's cross-border wealth management business reached USD 2.95 trillion in 2026, surpassing Switzerland as the world's top cross-border wealth hub according to Boston Consulting Group. This wealth concentration supports continued growth in RMB-denominated assets and transactions.
The integration of Hong Kong with China's digital yuan (e-CNY) initiatives presents additional growth opportunities. The PBOC's digital yuan operation center signed agreements with 26 financial institutions in Shanghai to promote cross-border digital currency adoption, with Hong Kong positioned to facilitate these flows.
Conclusion
Hong Kong's position as the world's largest offshore RMB financial center is quantified through overwhelming market share statistics: 70% to 80% of global offshore RMB payments, RMB 926.6 billion in deposits, USD 107.6 billion in daily FX trading volume, and RMB 5.38 trillion in annual trade settlement. These figures demonstrate Hong Kong's critical role in China's currency internationalization strategy.
The city's deep liquidity pools, comprehensive market infrastructure, and policy support from Chinese authorities ensure continued dominance in offshore RMB markets. For global businesses, investors, and financial institutions seeking RMB exposure, Hong Kong remains the primary gateway offering price efficiency, settlement reliability, and market depth unavailable elsewhere. As RMB internationalization progresses, Hong Kong's market share, while potentially facing competition from growing centers like London and Singapore, is structurally positioned to maintain leadership through its unique combination of Chinese market access and international financial standards.@Gate_Square
repost-content-media
  • Reward
  • Comment
  • Repost
  • Share
#TradFiCFDGoldMasters
Gold CFD trading in traditional financial markets represents a sophisticated and potentially lucrative domain that allows professional traders and institutional investors to capitalize on global gold price movements without taking physical ownership of the precious metal. Gate.com has introduced an exceptional opportunity for its users where they can not only engage in professional Gold CFD trading but also earn points through the Gate Card Points System on every eligible purchase, redeemable for valuable digital assets including BTC, ETH, USDT, and GT.
Fundamentals of G
HighAmbition
#TradFiCFDGoldMasters
Gold CFD trading in traditional financial markets represents a sophisticated and potentially lucrative domain that allows professional traders and institutional investors to capitalize on global gold price movements without taking physical ownership of the precious metal. Gate.com has introduced an exceptional opportunity for its users where they can not only engage in professional Gold CFD trading but also earn points through the Gate Card Points System on every eligible purchase, redeemable for valuable digital assets including BTC, ETH, USDT, and GT.
Fundamentals of Gold CFD Trading and Professional Perspective
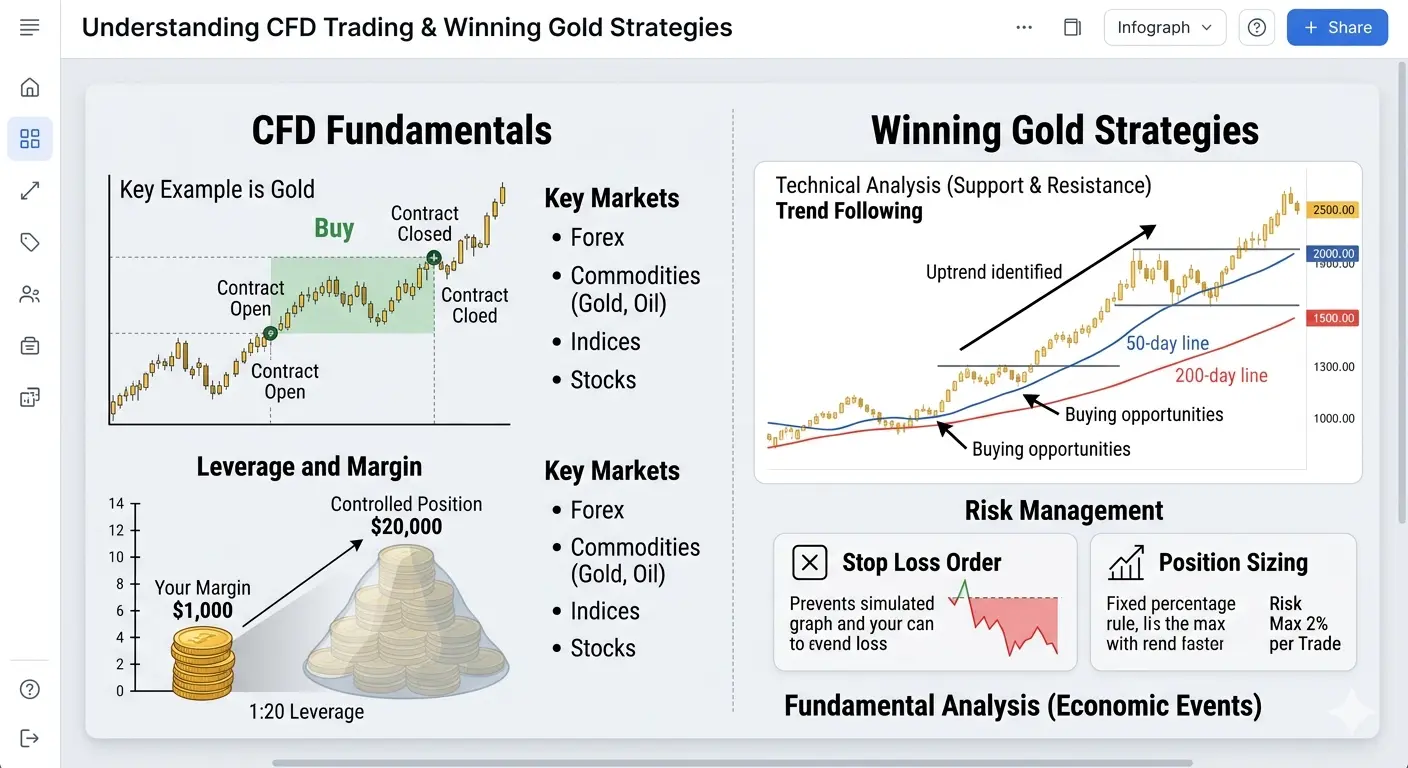
Gold CFD, or Contract for Difference, is a derivative product that enables traders to speculate on gold price movements without owning the underlying physical asset. On Gate.com, XAUUSD trading pairs are pegged to international gold prices, providing professional traders with a transparent and efficient platform. Leverage plays a crucial role in Gold CFD trading, with ratios typically ranging from 1:10 to 1:50 available to qualified traders. For instance, if a trader utilizes 1:20 leverage and opens a 10,000 USD position on XAUUSD, only 500 USD in margin capital is required, amplifying both potential returns and risks proportionally.
Analytical Strategies and Technical Indicators
Professional gold traders employ multiple technical indicators for market analysis. The Relative Strength Index (RSI) operates within the 30 to 70 range, indicating oversold conditions below 30 and overbought conditions above 70. Moving Average Convergence Divergence (MACD) confirms trend direction through signal line crossovers. Bollinger Bands measure volatility, where prices extending beyond the upper band signal overbought conditions. Fibonacci retracement levels at 23.6 percent, 38.2 percent, 50 percent, 61.8 percent, and 78.6 percent establish critical support and resistance zones for entry and exit decisions.
Gate Card Points System: Rewards on Every Purchase
Gate.com has introduced the Gate Card Points System to reward users for their participation in the Gate ecosystem. Eligible purchases made with the Gate Card earn points at fixed rates based on card tier. These points can be redeemed for digital assets including BTC, ETH, USDT, and GT, with redeemed assets credited to designated accounts for subsequent trading, wealth management, or future spending. Points remain valid indefinitely, with additional redeemable assets and benefits continuously being introduced.
Cashback rates vary by card tier as follows: Tier T0 offers 1.00 percent cashback, Tier T1 provides 1.00 percent, Tier T2 delivers 2.00 percent, Tier T3 grants 3.00 percent, Tier T4 awards 5.00 percent, and Tier T5 delivers an impressive 8.00 percent cashback rate. Monthly points cashback limits range from 500 points for T0 (equivalent to up to 5 USDT), 5,000 points for T1 (up to 50 USDT), 10,000 points for T2 (up to 100 USDT), 15,000 points for T3 (up to 150 USDT), 25,000 points for T4 (up to 250 USDT), to 40,000 points for T5 (up to 400 USDT).
Single transaction points cashback limits are structured as: T0 allows up to 200 points per transaction, T1 permits 1,500 points, T2 allows 3,000 points, T3 permits 5,000 points, T4 allows 8,000 points, and T5 permits up to 15,000 points per transaction. These limits ensure high-volume traders can maximize their rewards while maintaining system sustainability.
Card Tier Progression Requirements
Card tier determination follows either Gate VIP level or monthly card spending, with the higher benefit applying. Tier T0 is available for VIP 0 through VIP 4 with zero minimum spending required. Tier T1 requires VIP 5 through VIP 7 or minimum monthly spending of 500 USD. Tier T2 necessitates VIP 8 status or 3,000 USD monthly spending. Tier T3 requires VIP 9 or 6,000 USD monthly expenditure. Tier T4 demands VIP 10 through VIP 12 or 10,000 USD monthly spending. Tier T5, the highest tier, requires VIP 13 through VIP 14 or 15,000 USD in monthly card spending. New tier benefits become effective the following calendar month and remain valid for the entire month.
Risk Management and Capital Protection
Risk management is paramount in Gold CFD trading. Professional traders typically risk no more than 1 to 2 percent of their total trading capital on any single position. Stop-loss orders are mandatory, commonly set at 2 to 3 percent loss limits. Take-profit levels are established at 1:2 or 1:3 risk-to-reward ratios to ensure profitable expectancy over time. Portfolio diversification remains essential, with no single asset exceeding 10 percent of total investment allocation. Position sizing calculations must account for leverage multipliers to prevent excessive exposure.
Market Factors and Fundamental Analysis
Multiple factors influence gold prices. The inverse correlation between the US dollar and gold means that dollar weakness typically drives gold prices higher. Federal Reserve interest rate policies significantly impact gold attractiveness, with lower rates increasing gold's appeal as a non-yielding asset. Geopolitical tensions and economic uncertainty increase demand for gold as a safe-haven asset. Inflation hedge characteristics make gold attractive during periods of monetary expansion. Gold prices demonstrated a remarkable 48 percent year-over-year increase as of October 2025, with continued upward momentum expected based on institutional investment flows and central bank purchasing patterns.
How to Trade Gold CFD on Gate.com
Access the Gate web platform and click on TradFi in the top navigation bar to proceed to the CFD trading page. Agree to the protocol terms and open a CFD trading account. Transfer funds to the CFD account using the Transfer button at the top of the interface. Select XAUUSD or other traditional asset trading pairs from the available options. Choose your trading side, either Buy (Long) for bullish positions or Sell (Short) for bearish positions. Enter your trading amount and place your order with appropriate risk parameters. Gate TradFi trading supports App version 8.4.0 and above for mobile access.
Additional Trading Instruments and Opportunities
Beyond gold, Gate.com offers additional traditional asset CFDs including Silver (XAGUSD), Platinum (XPTUSD), WTI Crude Oil (XTIUSD), and NASDAQ 100 Index (NAS100). This diversification allows traders to construct balanced portfolios across precious metals, energy commodities, and equity indices. Cross-asset correlations can be exploited for hedging strategies, particularly during periods of market stress when gold typically outperforms while equities decline.
Institutional Investment Perspective
Institutional investors maintain strategic allocations to gold and gold-related securities for portfolio resilience. Recent surveys indicate approximately 15 percent of institutional investors currently hold gold positions, representing significant growth potential as awareness increases. Gold serves as a long-duration hedge providing portfolio protection across various adverse circumstances including inflationary and deflationary environments, equity bear markets, and sharp near-term selloffs while supporting real purchasing power across market cycles.
Maximizing Gate Card Benefits for Traders
Active traders can optimize Gate Card usage by routing all trading-related expenses through the card to accumulate maximum points. Monthly spending of 15,000 USD achieves T5 status with 8.00 percent cashback, generating up to 400 USDT in monthly rewards. At T5 level, single transactions can earn up to 15,000 points, making large purchases highly rewarding. Points can be strategically redeemed during favorable market conditions to maximize digital asset accumulation. The ability to redeem points for BTC, ETH, USDT, and GT provides flexibility for traders to align rewards with their investment strategies.
Conclusion
Gold CFD trading represents an exceptional opportunity for professional traders and institutional investors seeking exposure to precious metal price movements. Gate.com's Gate Card Points System enhances this opportunity significantly, allowing users to earn rewards not only from trading profits but also from every eligible purchase through the card. Cashback rates reaching 8.00 percent and monthly rewards up to 400 USDT make Gate.com an ideal platform for Gold CFD trading. The combination of professional-grade trading infrastructure, comprehensive risk management tools, and innovative rewards programs positions Gate.com as a leading destination for sophisticated traders seeking to maximize both trading performance and ancillary benefits.
repost-content-media
  • Reward
  • Comment
  • Repost
  • Share
#WeakNFPShakesRateHikeOdds
The cryptocurrency market has staged a meaningful recovery after the weaker-than-expected June Non-Farm Payrolls (NFP) report reduced expectations for another Federal Reserve rate hike. The softer labor data weakened the U.S. dollar, improved overall market liquidity, and boosted demand for both digital assets and traditional safe havens such as gold.
Although the recovery has been impressive, investors should recognize that the rally has been driven by a combination of improving macroeconomic sentiment, aggressive short covering, and renewed speculative activity ra
BTC1.04%
SOL1.67%
XRP-0.76%
HighAmbition
#WeakNFPShakesRateHikeOdds
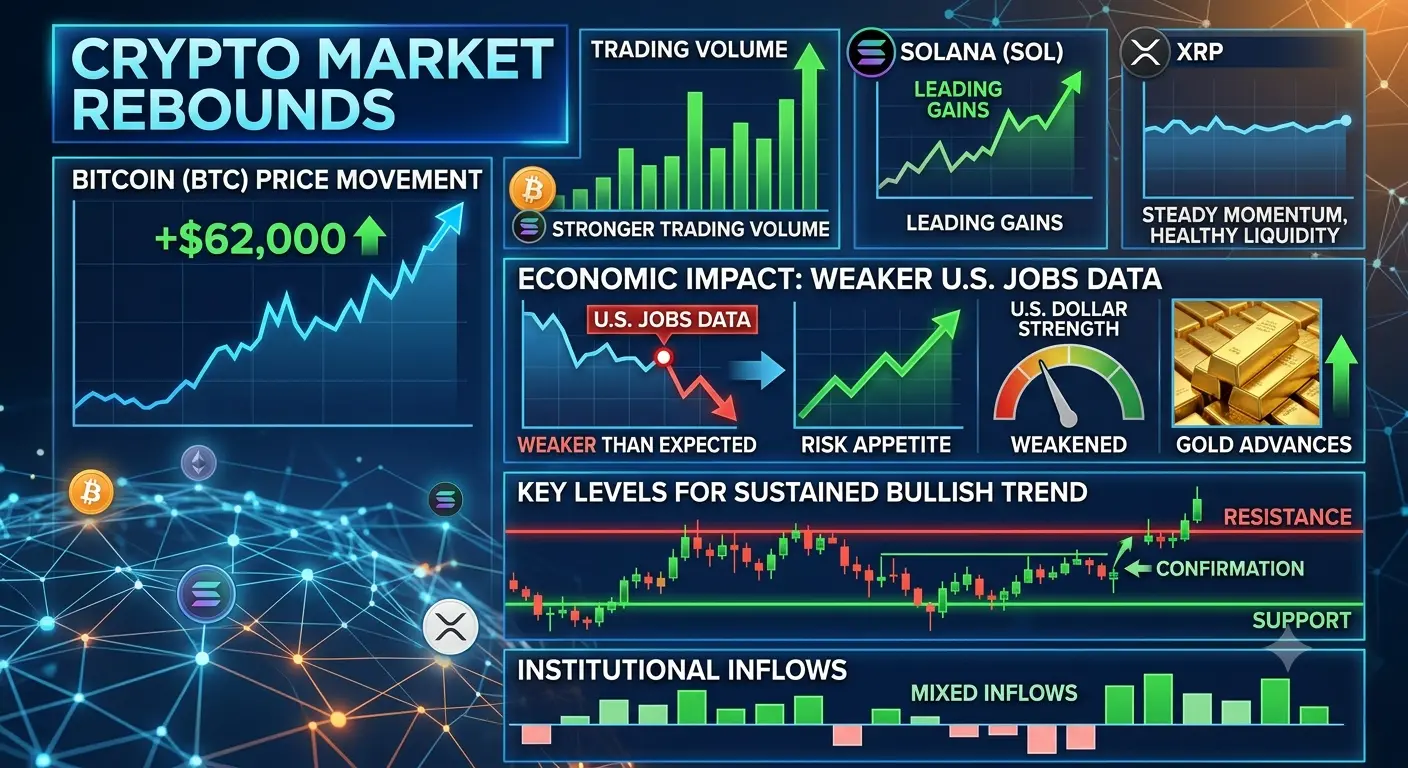
The cryptocurrency market has staged a meaningful recovery after the weaker-than-expected June Non-Farm Payrolls (NFP) report reduced expectations for another Federal Reserve rate hike. The softer labor data weakened the U.S. dollar, improved overall market liquidity, and boosted demand for both digital assets and traditional safe havens such as gold.
Although the recovery has been impressive, investors should recognize that the rally has been driven by a combination of improving macroeconomic sentiment, aggressive short covering, and renewed speculative activity rather than broad institutional accumulation.
This distinction will determine whether the current move evolves into a sustainable uptrend or remains a temporary relief rally.
Bitcoin (BTC): Institutional Recovery with Cautious Optimism
Bitcoin has recovered from approximately 57,000 USD to around 62,850 USD, representing a gain of more than 10 percent from recent lows. Weekly performance has improved to roughly 5.15 percent, while daily gains continue to hold near 1 percent, confirming renewed buying momentum.
Trading activity remains exceptionally healthy.
The BTC/USDT pair on Gate has recorded hundreds of millions of dollars in daily trading volume, demonstrating that this recovery is supported by genuine market participation rather than thin liquidity.
Bitcoin's market capitalization has recovered to nearly 1.24 trillion USD, while U.S. Spot Bitcoin ETFs ended a prolonged outflow streak with approximately 224 million USD of fresh inflows.
Nevertheless, cumulative institutional flows over the previous month remain deeply negative at approximately 6.27 billion USD, suggesting that large investors continue to approach the market cautiously.
Derivative markets remain balanced with neutral funding rates and steadily rising open interest.
Options positioning, however, continues to favor downside protection, indicating that professional traders are maintaining defensive hedges despite recent price appreciation.
Solana (SOL): The Strongest Large-Cap Performer
Solana has emerged as the strongest performer among major cryptocurrencies.
SOL has gained nearly 18.6 percent during the past week, significantly outperforming Bitcoin and most leading digital assets. The network now carries a market capitalization approaching 47 billion USD while maintaining one of the highest growth rates among Layer-1 ecosystems.
One of the primary catalysts behind Solana's strength has been the explosive expansion of tokenized equity trading. Daily trading activity surrounding tokenized stocks has increased dramatically, generating billions of dollars in network volume and attracting fresh liquidity into the ecosystem.
Perpetual futures trading also reflects elevated investor participation, with Solana recording substantially higher derivatives volume than many competing large-cap cryptocurrencies.
This combination of growing ecosystem activity, institutional attention, and increasing liquidity continues to position Solana as one of the highest-beta assets during improving market conditions.
XRP: Stable Institutional Demand Continues
XRP has also participated strongly in the broader recovery.
The asset has appreciated approximately 10 percent over the week while maintaining healthy daily trading volume above 1.5 billion USD.
XRP's market capitalization remains near 70 billion USD, supported by growing institutional adoption and improving regulatory clarity.
Unlike Solana, XRP's performance is driven less by speculative momentum and more by payment infrastructure adoption and long-term institutional positioning. Options markets also reflect comparatively bullish sentiment, with traders maintaining significantly lower downside hedging than Bitcoin.
Gold (XAU): Safe-Haven Demand Accelerates
Gold has benefited directly from weaker employment data and falling expectations for tighter monetary policy.
The precious metal has recovered toward 4,150 USD after several weeks of weakness as declining Treasury yields and a softer U.S. Dollar improved investor appetite for non-yielding assets.
Institutional demand has strengthened as markets increasingly anticipate a more accommodative Federal Reserve policy over coming months.
Market-Wide Recovery Metrics
The entire cryptocurrency market has experienced improving liquidity following the NFP release.
Several important indicators now highlight strengthening market conditions:
• Total crypto market capitalization has expanded alongside Bitcoin's recovery.
• Fear & Greed Index has improved from deeply oversold readings, although sentiment remains within Extreme Fear territory.
• More than 281 million USD in short liquidations accelerated upward momentum as bearish traders were forced to close positions.
• Recent options expiries totaling more than 10 billion USD have contributed to increased market volatility while simultaneously reducing uncertainty heading into the next trading cycle.
Liquidity & Market Structure
Market liquidity has improved noticeably compared with recent weeks.
Stablecoin dominance has started declining, indicating that capital is gradually rotating from defensive positions into higher-risk digital assets.
Long-term holders continue accumulating while short-term supply decreases, suggesting experienced investors are positioning for potential upside over the coming quarters despite cautious institutional ETF flows.
Technical Outlook
Bitcoin
Immediate Resistance • 63,400 USD • 65,000 USD
Major Resistance • 71,000–72,000 USD
Key Support • 60,000 USD
Major Accumulation Zone • 58,000–55,000 USD
A sustained breakout above 64,000–65,000 USD would invalidate the current bearish technical structure and significantly improve the probability of a broader market recovery.
Risk Assessment
Despite improving sentiment, several risks remain.
Institutional ETF flows continue to reflect net selling over longer timeframes.
Mining economics remain under pressure, with production costs still above prevailing market prices, forcing many miners to liquidate reserves.
Historical market cycles also suggest that July frequently delivers relief rallies during bear markets, while August has often produced renewed volatility and downside pressure.
These factors indicate that investors should remain disciplined rather than assuming the current recovery automatically marks the beginning of a new bull market.
Trading Strategy
Bitcoin (BTC)
Accumulation Zone: 60,000–58,000 USD
Breakout Confirmation: Above 65,000 USD
Bullish Target: 71,000–72,000 USD
Extended Target: 75,000–78,000 USD
Solana (SOL)
Strong momentum leader with the highest upside potential during risk-on conditions.
Sustained strength could open a move toward significantly higher price levels if institutional inflows accelerate.
XRP
Suitable for investors seeking comparatively lower volatility with improving institutional participation.
Continued regulatory clarity may support gradual long-term appreciation.
Market Outlook
The weaker NFP report has improved macroeconomic conditions for risk assets and created a favorable short-term environment for cryptocurrencies. Liquidity has strengthened, the U.S. dollar has weakened, and market sentiment has begun recovering from extremely depressed levels.
However, sustainable upside will ultimately depend on continued institutional capital inflows rather than short-covering alone. If Bitcoin successfully establishes support above 60,000 USD and breaks 65,000 USD, the broader cryptocurrency market could enter a much stronger recovery phase led by Bitcoin, Solana, and XRP.
Until then, disciplined accumulation, proper risk management, and close monitoring of macroeconomic developments remain the most prudent strategy for investors.
@Gate_Square
repost-content-media
  • Reward
  • Comment
  • Repost
  • Share
#MyGateTradeStory
Every trader has a story. Some chapters are filled with excitement, some with disappointment, and some with lessons that become more valuable than any profit. My journey on Gate has been exactly that—a combination of wins, losses, growth, patience, and continuous learning.
When I first entered the world of trading, I was attracted by the opportunities that financial markets offered. Like many beginners, I thought success would come quickly. I believed that finding the right trade was all that mattered.
What I did not realize at the time was that trading is not just about en
HighAmbition
#MyGateTradeStory
Every trader has a story. Some chapters are filled with excitement, some with disappointment, and some with lessons that become more valuable than any profit. My journey on Gate has been exactly that—a combination of wins, losses, growth, patience, and continuous learning.
When I first entered the world of trading, I was attracted by the opportunities that financial markets offered. Like many beginners, I thought success would come quickly. I believed that finding the right trade was all that mattered.
What I did not realize at the time was that trading is not just about entries and exits. It is about discipline, risk management, psychology, patience, and the ability to keep learning every single day.
My journey with Gate started during a period when I was eager to understand the markets better. At first, I focused on observing price movements, studying market trends, and learning how different assets reacted to news, liquidity, and investor sentiment. Every chart seemed complicated, every market move felt unpredictable, and every successful trader appeared to possess a secret formula that I did not know.
Very quickly, I discovered that there is no secret formula.
The market rewards preparation, consistency, and discipline.
Like many traders, I experienced my first losses early. Those losses were frustrating because I thought I had made the perfect analysis.
Sometimes I entered trades too early.
Sometimes I held positions for too long.
Sometimes emotions influenced my decisions more than logic did. Looking back today, I realize those losses were not failures. They were tuition fees paid to the market.
Each losing trade taught me something valuable.
One loss taught me not to chase price movements.
Another taught me the importance of stop-loss management.
A different loss showed me why risk management matters more than confidence.
Instead of quitting, I decided to learn from every mistake.
That decision changed everything.
Gate became more than just a trading platform for me. It became an environment where I could continue improving my knowledge and skills.
Through market analysis, trading events, educational content, community discussions, and daily market participation, I gradually developed a deeper understanding of how markets function.
As time passed, I began to notice improvements in my trading approach.
I became more patient.
I stopped trying to catch every opportunity.
I learned that missing a trade is often better than forcing a bad trade.
I learned that preserving capital is just as important as growing capital.
Most importantly, I learned that successful trading is a marathon, not a sprint.
One of the most memorable parts of my journey was participating in community events and trading competitions. I still remember the excitement of seeing my name climb rankings after months of consistent effort. There were periods when results did not go my way, but I kept participating, learning, and improving.
Persistence eventually produced results.
There were moments when my hard work was recognized. There were events where I managed to secure rewards and achieve rankings that once seemed impossible. Those achievements were not important because of the prizes themselves. They were important because they represented progress.
They proved that consistent effort eventually creates opportunities.
What made those moments special was knowing how much work happened behind the scenes. The hours spent studying charts. The time invested in understanding market structures. The mistakes corrected after difficult trades. The patience required to stay focused during challenging periods.
Every reward carried a lesson behind it.
Every achievement represented growth.
At the same time, the journey was never perfect.
There were days when markets moved against expectations.
There were weeks when opportunities seemed limited.
There were periods when I questioned my strategies.
There were trades that looked promising but failed.
There were moments when confidence was tested.
However, those difficult periods often became the most valuable learning experiences.
Markets have a unique way of teaching humility.
Whenever I became overconfident, the market reminded me to remain disciplined.
Whenever I became impatient, the market reminded me to wait for quality setups.
Whenever I focused too much on short-term outcomes, the market reminded me to think long term.
These lessons helped shape my mindset far beyond trading itself.
Another thing I appreciate about Gate is the variety of opportunities available to users.
Whether it is spot trading, futures trading, market analysis, community engagement, campaigns, educational resources, or global events, there is always something new to explore and learn from.
This diversity helped me understand that financial markets are larger than a single asset or strategy.
The more I learned, the more I realized how much there is still to learn.
That mindset continues to motivate me today.
One of the biggest misconceptions many new traders have is believing that successful traders never lose. My experience taught me the opposite.
Losses are part of trading.
Every professional trader experiences losses.
What matters is how you respond to them.
Do you allow losses to discourage you?
Or do you use them as opportunities to improve?
I chose the second path.
Every losing trade became a lesson.
Every mistake became a learning opportunity.
Every challenge became motivation to become better.
Over time, this approach helped me develop a stronger and more disciplined trading mindset.
The most valuable thing I have gained from Gate is not a reward, a ranking, or a profitable trade.
It is knowledge.
Knowledge compounds over time.
A reward may be spent.
A profitable trade may eventually be forgotten.
But knowledge stays with you and continues creating value long into the future.
The second most valuable thing I gained is confidence.
Not the confidence that comes from winning.
The confidence that comes from experience.
The confidence that comes from understanding risk.
The confidence that comes from surviving difficult market conditions and continuing to move forward.
The confidence that comes from knowing that growth is a continuous process.
Today, I still consider myself a student of the markets.
I continue learning.
I continue analyzing.
I continue improving.
Every trading session provides new information.
Every market cycle offers new lessons.
Every challenge creates new opportunities for growth.
My journey with Gate is still ongoing, and I believe the best chapters are yet to be written.
If there is one message I would share with every new trader, it is this:
Do not measure success only by profits.
Measure success by how much you learn.
Profits can fluctuate.
Markets can change.
Opportunities can come and go.
But the lessons you gain through experience remain with you forever.
I have won some trades.
I have lost some trades.
I have achieved results that made me proud.
I have made mistakes that taught me valuable lessons.
Through all of it, one thing has remained constant: continuous learning.
That is what makes this journey meaningful.
Thank you, Gate, for providing opportunities to learn, grow, participate, compete, and connect with a global community of traders and investors.
The journey continues, the learning never stops, and the next chapter is waiting to be written.
#MyGateTradingMoment @Gate_Square
repost-content-media
  • Reward
  • Comment
  • Repost
  • Share
#MyGateTradeStory
Every trader remembers their first big lesson.
Some lessons come through success. Others come through mistakes. In my case, one of the most important lessons of my trading journey came from a single trade that changed the way I look at the market forever.
My journey on Gate started when the platform regularly rewarded selected community posts with Futures Vouchers. At that time, if your content was selected, you could receive a voucher worth 50 USDT that could be used for futures trading. As a content creator and active community member, I worked hard to create quality posts
BLESS-2.67%
HighAmbition
#MyGateTradeStory
Every trader remembers their first big lesson.
Some lessons come through success. Others come through mistakes. In my case, one of the most important lessons of my trading journey came from a single trade that changed the way I look at the market forever.
My journey on Gate started when the platform regularly rewarded selected community posts with Futures Vouchers. At that time, if your content was selected, you could receive a voucher worth 50 USDT that could be used for futures trading. As a content creator and active community member, I worked hard to create quality posts and engage with the community.
One day, my effort paid off.
My post was selected, and I received a 50 USDT Futures Voucher.
I was extremely excited.
For many experienced traders, 50 USDT might not seem like a large amount, but for me, it represented an opportunity. More importantly, it was proof that my contributions to the community had been recognized.
I decided to use that voucher carefully and begin my futures trading journey.
At that time, I was paying close attention to a project called Bless. Most of my focus was on this coin because I believed it had strong momentum and offered trading opportunities.
The voucher had a limited lifespan of seven days before expiration, so I knew I had to use it wisely.
During the first few days, everything seemed to be going perfectly.
I studied the market, opened positions, managed trades, and gradually started growing the voucher balance. Every successful trade increased my confidence. Every profitable move made me believe I was beginning to understand the market.
Day after day, the balance continued growing.
By the sixth day, through consistent trading on Bless, I had managed to increase the voucher value from 50 USDT to approximately 65 USDT.
I was thrilled.
Seeing the account grow felt incredible.
I remember checking the balance repeatedly because I could hardly believe the progress. For someone still relatively new to futures trading, it felt like a major achievement.
Then came the seventh day.
I still had one final day before the voucher expired.
My confidence was high because the previous days had gone well. I continued focusing on Bless and kept trading. During that final day, I managed to generate another 5 USDT in gains, bringing the voucher value close to 70 USDT.
At that moment, I felt unstoppable.
I was already imagining how much more I might earn before the voucher expired.
That confidence would soon become my biggest mistake.
I clearly remember looking at the timer and noticing that only around 30 minutes remained before the voucher expiration.
Instead of protecting the gains I had already built, I decided to take one more trade.
I thought it would be a quick opportunity.
I believed I could earn a little extra profit before time ran out.
The market had other plans.
Bless was trading around 0.053.
Based on my analysis at the time, I opened a short position.
I expected the price to move lower.
Instead, the exact opposite happened.
Within minutes, the market started moving against me.
At first, I was not worried.
I thought it was just a temporary fluctuation.
I expected the price to reverse.
But it did not.
The upward movement became stronger.
Every minute that passed increased the pressure.
Instead of falling, Bless continued climbing aggressively.
What happened next remains one of the most unforgettable moments of my trading journey.
In less than twenty minutes, Bless surged from approximately 0.053 to nearly 0.07.
The market was moving fast.
Much faster than I expected.
I watched the unrealized loss grow larger and larger.
The numbers on the screen kept getting worse.
As a beginner trader, I did not fully understand risk management.
I did not understand position sizing.
I did not understand the importance of protecting profits.
Most importantly, I did not understand when to accept a loss and exit.
I simply watched.
And the market continued moving against me.
The balance that had taken seven days of effort to build started disappearing rapidly.
The 70 USDT value I had worked so hard to reach was being erased in real time.
Every second felt painful.
The excitement I had felt earlier turned into stress.
The confidence I had built over the week began fading.
By the time the voucher was close to expiration, almost everything was gone.
After seven days of trading, learning, analyzing, and growing the balance, only around 10 USDT remained.
Seven days of effort.
Thirty minutes of mistakes.
That was all it took
When the voucher finally expired, I sat there staring at the screen.
I felt disappointed.
I felt frustrated.
I felt upset with myself.
I kept replaying the trade in my mind.
What if I had closed earlier?
What if I had protected profits?
What if I had simply stopped trading when I reached 70 USDT?
But markets do not reward "what if."
Markets reward discipline.
That day became one of the most valuable lessons of my entire trading journey.
At the time, it felt like a painful experience.
Today, I see it differently.
The market taught me something that no book, video, or tutorial could have taught as effectively.
It taught me the true importance of risk management.
It taught me that protecting capital is just as important as generating profits.
It taught me that confidence without discipline can become dangerous.
It taught me that one emotional decision can erase days of hard work.
Most importantly, it taught me patience.
After that experience, I did not quit.
I did not blame the market.
I did not give up on trading.
Instead, I decided to learn.
I started studying more.
I spent more time understanding leverage.
I learned about stop-loss placement.
I learned about position management.
I learned that successful trading is not about being right all the time.
It is about managing risk when you are wrong.
Gradually, my experience grew.
My understanding improved.
My decision-making became more disciplined.
Every lesson from that trade became part of my trading foundation.
Looking back today, I am actually grateful for that experience.
Of course, losing most of the voucher was painful.
Of course, watching seven days of effort disappear was difficult.
But the knowledge gained from that mistake has stayed with me far longer than the voucher ever could.
The loss was temporary.
The lesson was permanent.
That experience transformed my mindset.
It showed me that trading is not a game of quick profits.
It is a journey of continuous improvement.
It is a process of building discipline, patience, emotional control, and experience.
Since then, Gate has remained an important part of my journey.
The platform has given me opportunities to learn, participate in events, engage with the community, explore markets, and continuously improve my skills.
The rewards were valuable.
The trading opportunities were valuable.
But the lessons were the most valuable of all.
Today, whenever I see new traders entering the market, I remember my own experience.
I remember the excitement of receiving that first voucher.
I remember growing it from 50 USDT to 70 USDT.
I remember the confidence.
I remember the mistake.
And I remember the lesson.
Because sometimes the most important victory is not making money.
Sometimes the most important victory is gaining experience.
My first major trading lesson cost me almost an entire week's worth of progress.
But it also gave me something far more valuable:
A stronger mindset.
A better understanding of risk.
Greater patience.
And a foundation that continues helping me improve every single day.
The market took away my profits that day.
But it gave me wisdom in return.
And that wisdom is still paying dividends today.
@Gate_Square #MyGateTradingMoment.
repost-content-media
  • Reward
  • Comment
  • Repost
  • Share
#MyGateTradeStory
My Gate Trading Moment: A Strategic BTC Trade
The cryptocurrency market never sleeps, and neither do the opportunities it presents. Today, I want to share my trading journey with Bitcoin on Gate, the best cryptocurrency exchange for both beginners and experienced traders.
Current Market Snapshot
Bitcoin is currently trading at $63,659.7 USDT, showing a positive movement of 2.09% with a price increase of $1,303.2 from the opening price of $62,356.4. The 24-hour high reached $63,919.9, while the low touched $62,339.4. The trading volume stands at 8,395.598 BTC, demonstrating s
BTC1.04%
HighAmbition
#MyGateTradeStory
My Gate Trading Moment: A Strategic BTC Trade
The cryptocurrency market never sleeps, and neither do the opportunities it presents. Today, I want to share my trading journey with Bitcoin on Gate, the best cryptocurrency exchange for both beginners and experienced traders.
Current Market Snapshot
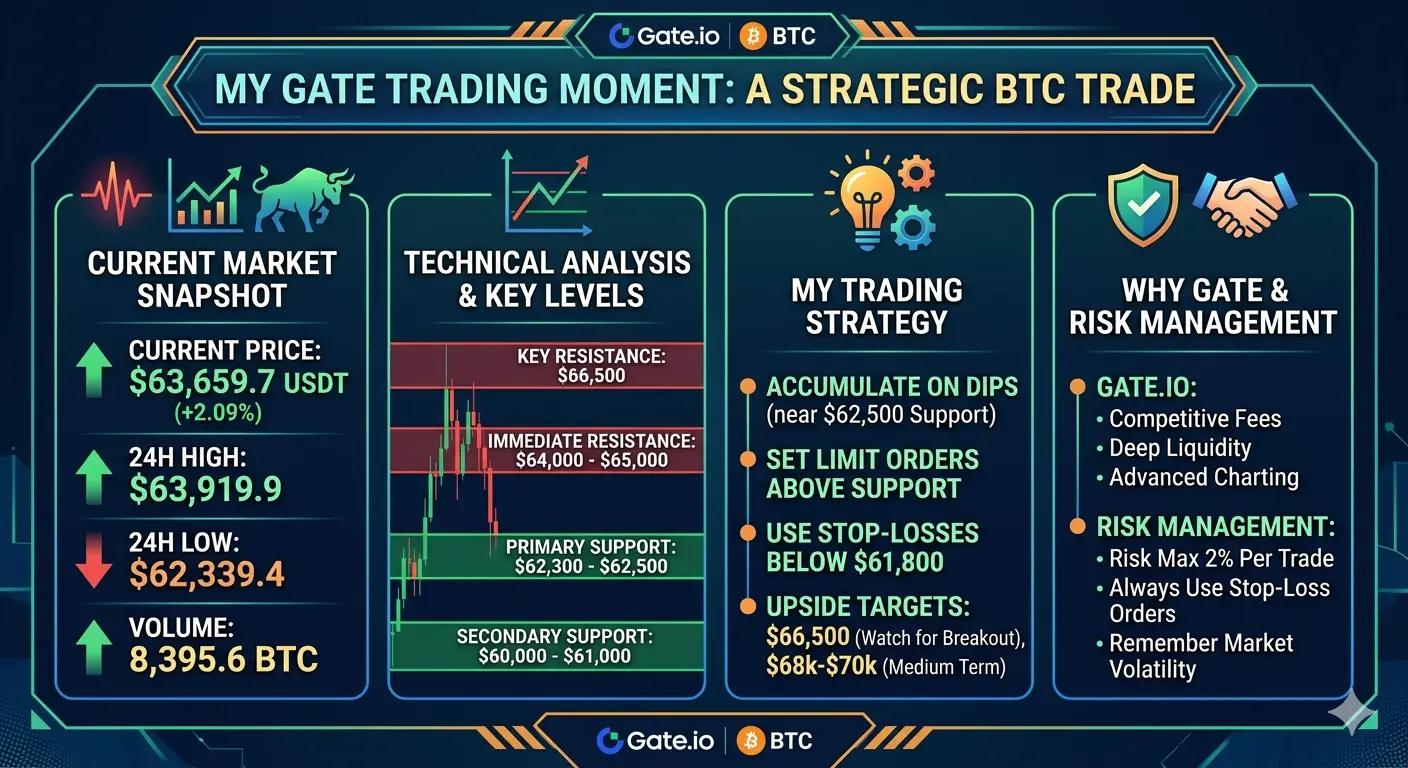
Bitcoin is currently trading at $63,659.7 USDT, showing a positive movement of 2.09% with a price increase of $1,303.2 from the opening price of $62,356.4. The 24-hour high reached $63,919.9, while the low touched $62,339.4. The trading volume stands at 8,395.598 BTC, demonstrating strong market participation.
Technical Analysis and Key Levels
Based on my analysis of the recent price action, here are the critical levels I am monitoring:
Support Levels:
Primary Support: $62,300 - $62,500 range. This zone has shown strong buying interest and has acted as a floor during recent pullbacks.
Secondary Support: $60,000 - $61,000. A psychological level that could trigger significant buying if tested.
Resistance Levels:
Immediate Resistance: $64,000 - $65,000. The recent high of $63,919.9 suggests this area will be challenging to break.
Key Resistance: $66,500. Breaking above this level could signal a continuation of the uptrend toward higher targets.
My Trading Strategy
My approach combines technical analysis with risk management principles. I am currently looking for opportunities to accumulate BTC on dips toward the $62,500 support level. The strategy involves setting limit orders slightly above support to catch potential bounces while maintaining stop-losses below $61,800 to protect capital.
For upside targets, I am watching the $66,500 resistance level closely. A breakout above this zone with strong volume would confirm bullish momentum, potentially opening the path toward $68,000 - $70,000 in the medium term.
Why Gate is My Preferred Exchange
Gate provides the perfect environment for executing this strategy. With competitive fees, deep liquidity, and advanced charting tools, I can implement my trading plan with confidence. The platform's security features give me peace of mind while holding positions overnight.
Risk Management
No trade is complete without proper risk management. I never risk more than 2% of my portfolio on a single trade and always use stop-loss orders. Remember, the cryptocurrency market is highly volatile, and past performance does not guarantee future results.
Final Thoughts
Bitcoin continues to show resilience despite market uncertainties. The current price action suggests accumulation by smart money at lower levels. By combining technical analysis with disciplined risk management on Gate, I believe we can navigate these markets successfully.
Join me on Gate and share your own trading stories. Let us learn and grow together in this exciting market.
@Gate_Square
repost-content-media
  • Reward
  • Comment
  • Repost
  • Share
#BTC
Bitcoin is currently trading at approximately $63,750, representing a critical juncture in the market as multiple macroeconomic and geopolitical factors converge. This analysis examines every major catalyst affecting BTC price action and provides detailed projections for the coming week.
Current Market Status
Bitcoin has experienced significant volatility over recent weeks, recovering from lows near $60,000 following the US-Iran peace deal announcement. The cryptocurrency has shown resilience, climbing back above $65,000 at its peak before settling around current levels. The Fear and Gre
HighAmbition
#BTC
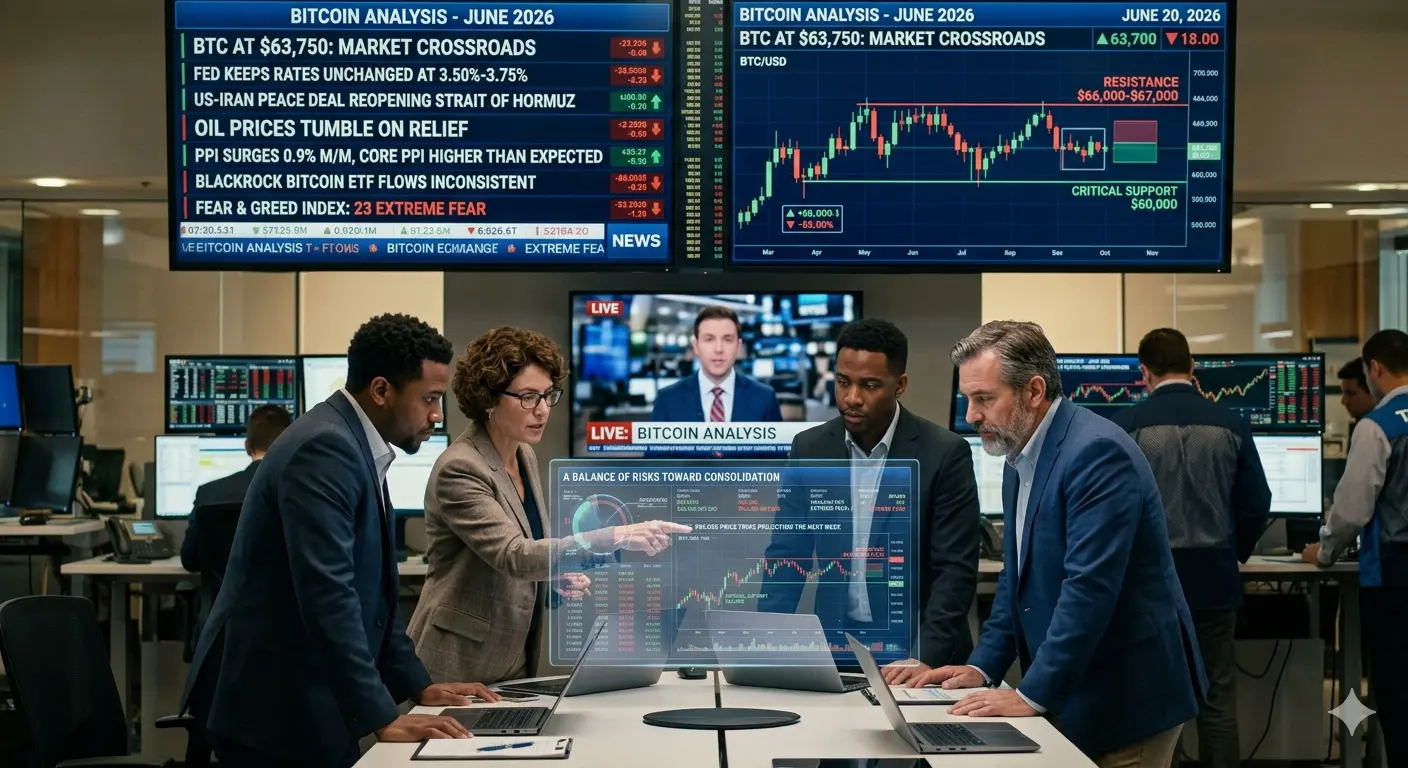
Bitcoin is currently trading at approximately $63,750, representing a critical juncture in the market as multiple macroeconomic and geopolitical factors converge. This analysis examines every major catalyst affecting BTC price action and provides detailed projections for the coming week.
Current Market Status
Bitcoin has experienced significant volatility over recent weeks, recovering from lows near $60,000 following the US-Iran peace deal announcement. The cryptocurrency has shown resilience, climbing back above $65,000 at its peak before settling around current levels. The Fear and Greed Index remains at a concerning 23, indicating Extreme Fear sentiment despite the recent bounce. This divergence between price recovery and market sentiment suggests the rally may be fragile and driven more by short-term factors than genuine conviction.
US-Iran Deal Impact Analysis
The preliminary peace agreement between the United States and Iran represents one of the most significant geopolitical developments affecting Bitcoin this month. The deal, mediated by Pakistan, includes reopening the Strait of Hormuz and lifting the US naval blockade of Iran. This development has had a mixed but generally positive impact on Bitcoin.
If the deal had failed or been postponed, Bitcoin would likely have faced severe downward pressure. Geopolitical tensions typically drive investors toward safe-haven assets like gold and the US dollar, while risk assets including Bitcoin suffer. The Strait of Hormuz closure would have disrupted approximately 20% of global oil supply, triggering energy price spikes and broader market instability. In such a scenario, Bitcoin could have retested the $60,000 support level or even broken below it toward $58,000-$59,000.
However, with the deal proceeding as planned and formal signing occurring in Switzerland, the geopolitical risk premium has been removed from markets. This has allowed Bitcoin to stabilize and attempt building a base. The reopening of the Strait of Hormuz has caused oil prices to tumble more than 4%, reducing inflationary pressures and providing breathing room for risk assets. Copper prices have surged on the deal news, indicating renewed risk appetite in commodity markets that often correlates with crypto sentiment.
Kevin Warsh Fed Meeting and Monetary Policy
Kevin Warsh has now chaired his first Federal Reserve meeting as the new Fed Chair, marking a significant shift in monetary policy communication. This meeting carried extraordinary importance for Bitcoin and broader crypto markets.
The Federal Reserve maintained interest rates unchanged at 3.50% to 3.75%, which was widely expected. However, the key developments came from updated economic projections and Warsh's communication style. The dot plot revealed that officials now expect the benchmark rate to reach 3.8% by year-end 2026, up from previous projections of 3.4%, signaling a more hawkish stance than markets anticipated.
Warsh has introduced significant changes to Fed communication, dropping forward guidance on future rate paths and establishing five task forces to overhaul central bank messaging. This creates uncertainty for markets, as investors can no longer rely on explicit Fed signals for future policy direction. The Fed has also signaled possible rate hikes later in 2026 if inflation persists, with markets now pricing in a 54% chance of a hike.
For Bitcoin, this hawkish shift presents headwinds. Higher interest rates reduce the attractiveness of non-yielding assets like Bitcoin, as investors can earn better returns in traditional fixed-income instruments. The removal of forward guidance increases market volatility, which typically pressures risk assets. However, if inflation data begins cooling, the Fed may still pivot toward easing, which would be bullish for Bitcoin.
CPI and PPI Data Impact
Inflation data remains crucial for Bitcoin price direction. Recent Producer Price Index readings have shown concerning trends, with July PPI surging 0.9% month-over-month against forecasts of 0.2%, and 3.3% year-over-year versus expected 2.5%. Core PPI also exceeded expectations at 0.9% monthly.
These elevated inflation readings reduce expectations for near-term Fed rate cuts, creating a challenging environment for Bitcoin. When CPI and PPI data exceed forecasts, it typically strengthens the US dollar and pressures Bitcoin lower as traders anticipate tighter monetary policy. Conversely, softer inflation data would support Bitcoin by increasing the probability of rate cuts.
The relationship between inflation data and Bitcoin has become increasingly pronounced in 2026 as institutional adoption has grown. Bitcoin now responds more sensitively to macroeconomic shifts, behaving increasingly like a risk asset rather than an inflation hedge. Traders should monitor upcoming CPI and PPI releases closely, as surprises in either direction can trigger significant Bitcoin volatility.
Technical Analysis and Market Structure
From a technical perspective, Bitcoin is showing mixed signals. The cryptocurrency is trading above its 100-day EMA at approximately $65,549, which provides some support. However, the MACD histogram and overall momentum indicators suggest caution.
Bitcoin's Sharpe ratio recently hit levels that have marked cycle lows since 2015, suggesting potential bottoming conditions. Long-term holders absorbed approximately 125,000 BTC in June, indicating strong conviction among seasoned investors. Strategy (formerly MicroStrategy) has continued accumulating Bitcoin, purchasing an additional 1,587 BTC for $100 million, bringing their total holdings above 800,000 coins.
However, bearish patterns persist. A bear flag formation remains intact on higher timeframes, with immediate TBO Support around $63,418. If this support fails, the technical target suggests a potential move toward $49,000 or even $38,555 in a worst-case breakdown scenario. Bitcoin dominance stands at 56.5%, with altcoins continuing to underperform, indicating that capital is not rotating aggressively into higher-risk crypto assets.
Open interest has been rising while funding rates remain negative, suggesting a short squeeze has been driving recent price appreciation. While this can fuel rallies, it also means the recovery lacks fundamental buying support and may be vulnerable to reversal.
Additional Market Factors
Several other factors merit consideration in this analysis. The Bank of Japan's rate decision carries significance for Bitcoin, as speculative short positions in the yen are at nine-year highs. If the BOJ signals more aggressive tightening, it could trigger a yen short squeeze and unwind carry trades that have supported risk assets, potentially impacting Bitcoin negatively.
SpaceX's historic IPO has created some distraction in markets, with the stock gaining nearly 40% in its first days of trading. Some analysts note that Cathie Wood sold Bitcoin-related positions to buy SpaceX shares, representing potential capital rotation away from crypto.
Bitcoin ETF flows remain critical to watch. BlackRock's Bitcoin ETF inflows have been inconsistent, and traders are hoping for a rebound in institutional demand to sustain price levels. The correlation between ETF inflows and Bitcoin price has strengthened considerably.
One-Week Price Projection
For the upcoming week, Bitcoin faces a challenging environment with multiple conflicting forces. The Iran deal provides a geopolitical relief tailwind, but Fed hawkishness and elevated inflation data create monetary headwinds.
The most likely scenario sees Bitcoin trading in a range between $62,000 and $67,000 over the next seven days. Support levels to watch include $63,418 (immediate TBO Support), $62,000 (psychological level), and $60,000 (critical support that marked the recent bottom). Resistance levels include $65,500 (recent highs), $66,000-$67,000 (congestion zone), and $68,000 (strong resistance).
If bearish technical patterns resolve to the downside, Bitcoin could test $60,000 again or potentially break lower toward $58,000. Conversely, if institutional buying resumes through ETFs and macro conditions stabilize, a move toward $68,000-$70,000 remains possible.
The balance of risks appears skewed toward further consolidation or mild downside rather than a strong breakout. Traders have been burned by collapsed ceasefires twice in recent months, creating skepticism about geopolitical-driven rallies. The Fed's hawkish pivot under Warsh removes a key bullish catalyst that had supported Bitcoin earlier in 2026.
Key Levels to Monitor
Critical support: $60,000 (must hold to maintain bullish structure)
Immediate support: $63,418
Resistance: $66,000-$67,000
Major resistance: $68,000-$70,000
Conclusion
Bitcoin at $63,750 represents a market at a crossroads. The Iran peace deal removes significant geopolitical risk, but monetary policy headwinds under the new Fed leadership create uncertainty. Technical indicators suggest caution, with bearish patterns still intact despite the recent bounce. For the coming week, expect continued volatility with a slight bearish bias as markets digest the Fed's new communication approach and await fresh inflation data. Long-term holders remain committed, but short-term price action will likely be driven by macroeconomic developments and institutional flow data.
#USIranTalksPostponed #TradFiCFDGoldMasters #STRC跌破面值11%創上市新低 #WarshDebutsAsFedHoldsRatesSteady
repost-content-media
  • Reward
  • Comment
  • Repost
  • Share
#MyGateTradeStory
XRP is currently trading at 1.1470, positioning itself in a critical consolidation zone. The cryptocurrency has been experiencing heightened volatility as institutional interest grows and regulatory clarity continues to evolve. Recent price action suggests a potential breakout scenario is developing, with traders closely monitoring key technical levels.
Technical Analysis Overview
Support Levels
The immediate support for XRP stands at 1.12, which has acted as a reliable floor during recent pullbacks. Below this, secondary support is located at 1.10, representing the previous
XRP-0.81%
HighAmbition
#MyGateTradeStory
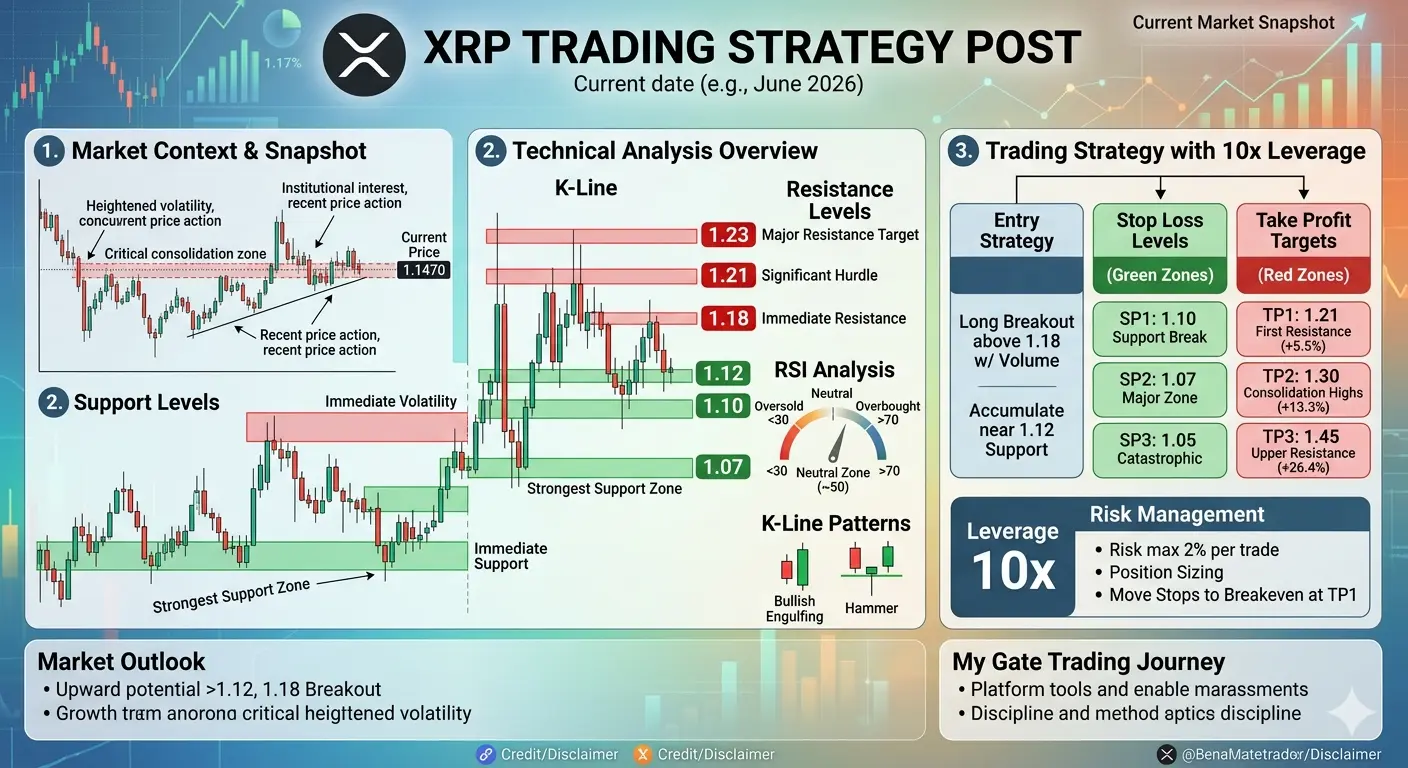
XRP is currently trading at 1.1470, positioning itself in a critical consolidation zone. The cryptocurrency has been experiencing heightened volatility as institutional interest grows and regulatory clarity continues to evolve. Recent price action suggests a potential breakout scenario is developing, with traders closely monitoring key technical levels.
Technical Analysis Overview
Support Levels
The immediate support for XRP stands at 1.12, which has acted as a reliable floor during recent pullbacks. Below this, secondary support is located at 1.10, representing the previous consolidation range low. The strongest support zone sits at 1.07, a level that has historically provided substantial buying interest and could serve as a safety net for long positions.
Resistance Levels
On the upside, XRP faces immediate resistance at 1.18, which aligns with the recent rejection zone. The next significant hurdle is 1.21, where previous selling pressure has been observed. The major resistance target is 1.23, a breakout above which could trigger a sustained rally toward higher price targets.
RSI Analysis
The Relative Strength Index is currently reading in the neutral zone, indicating that XRP is neither overbought nor oversold. This positioning provides room for movement in either direction. A reading below 30 would signal oversold conditions and potential buying opportunities, while readings above 70 would suggest overbought conditions and possible profit-taking scenarios.
K-Line Patterns
Recent candlestick formations show mixed signals with some indecision patterns emerging. The presence of higher lows on the daily timeframe suggests underlying bullish sentiment, though volume confirmation remains essential for validating any breakout attempts. Traders should watch for bullish engulfing patterns or hammer formations near support levels as potential entry signals.
Trading Strategy with 10x Leverage
Given the current price of 1.1470 and utilizing 10x leverage, here is a structured trading plan designed for optimal risk management.
Entry Strategy
Consider entering a long position if XRP breaks above 1.18 with volume confirmation. Alternatively, accumulate on dips toward the 1.12 support level with scaled entries. The position sizing should account for the 10x leverage multiplier, meaning a 10 percent move in price results in a 100 percent gain or loss on the leveraged position.
Stop Loss Levels
Protect your capital with strategic stop loss placement. Set SP1 at 1.10, representing a break below immediate support. Position SP2 at 1.07, the strongest support zone, as a secondary protection level. Maintain SP3 at 1.05 as a catastrophic stop to preserve account equity in case of unexpected market events.
Take Profit Targets
Plan your exits with disciplined profit-taking levels. Target TP1 at 1.21, capturing the first resistance zone for a 5.5 percent price move. Set TP2 at 1.30, representing a 13.3 percent gain and aligning with recent consolidation highs. Position TP3 at 1.45 for a 26.4 percent move, targeting the upper resistance zone and maximizing the risk-reward ratio.
Risk Management
With 10x leverage, risk management becomes paramount. Never risk more than 2 percent of your total trading capital on a single trade. Use position sizing calculations to determine appropriate entry amounts based on your stop loss distance. Monitor the trade actively and be prepared to adjust stops to breakeven once TP1 is achieved.
Market Outlook
XRP shows potential for upward movement if it can maintain support above 1.12 and break through the 1.18 resistance. The neutral RSI provides flexibility for both bullish and bearish scenarios. Institutional developments and broader market sentiment will likely dictate the next major directional move.
My Gate Trading Journey
Trading on Gate has provided access to advanced leverage options and comprehensive charting tools essential for executing this strategy. The platform's robust infrastructure supports precise entry and exit execution, which is critical when trading with leverage. Consistent application of technical analysis and disciplined risk management has been the foundation of successful trading outcomes.
Final Thoughts
This XRP trading setup offers a balanced approach with clear entry, exit, and risk management parameters. The 10x leverage amplifies both potential gains and losses, making strict adherence to stop losses essential. Monitor price action closely and adjust the strategy as market conditions evolve.
@Gate_Square
repost-content-media
  • Reward
  • Comment
  • Repost
  • Share
Spot User Exclusive: Get 10x Convert Rewards & 185 SpaceX Shares https://www.gate.com/campaigns/5149?ch=3926&ref=VLFCVA8MAQ&ref_type=132
HighAmbition
Spot User Exclusive: Get 10x Convert Rewards & 185 SpaceX Shares https://www.gate.com/campaigns/5149?ch=3926&ref=VLFCVA8MAQ&ref_type=132
repost-content-media
  • Reward
  • Comment
  • Repost
  • Share
#PredictWorldCup🇩🇪vs🇨🇮
Germany vs Ivory Coast 2026 FIFA World Cup Match Prediction
Match Details:
Germany and Ivory Coast face off in a crucial Group E encounter on June 20, 2026, at BMO Field in Toronto, Canada. This matchday 2 fixture carries significant weight as both teams enter with 3 points from their opening games. Germany demolished Curacao 7-1 in their first match, while Ivory Coast secured a hard-fought 1-0 victory over Ecuador courtesy of a late Amad Diallo strike.
Polymarket Prediction Market Analysis:
According to Polymarket data, Germany holds a commanding position in the Gr
HighAmbition
#PredictWorldCup🇩🇪vs🇨🇮
Germany vs Ivory Coast 2026 FIFA World Cup Match Prediction
Match Details:
Germany and Ivory Coast face off in a crucial Group E encounter on June 20, 2026, at BMO Field in Toronto, Canada. This matchday 2 fixture carries significant weight as both teams enter with 3 points from their opening games. Germany demolished Curacao 7-1 in their first match, while Ivory Coast secured a hard-fought 1-0 victory over Ecuador courtesy of a late Amad Diallo strike.
Polymarket Prediction Market Analysis:
According to Polymarket data, Germany holds a commanding position in the Group E winner market at 74 cents, with Ivory Coast trailing at 21 cents. This represents one of the most lopsided markets across the entire FIFA World Cup ecosystem on the prediction platform. The market sentiment heavily favors the four-time world champions, reflecting their overwhelming squad depth and attacking prowess demonstrated in their opening match.
Team Form and Statistics:
Germany enters this fixture in scintillating form under manager Julian Nagelsmann. Die Mannschaft have scored 10 goals across their last three international matches and found the back of the net first in 9 of their last 10 outings. The attacking quartet of Jamal Musiala, Florian Wirtz, Kai Havertz, and Thomas Muller provides creativity and finishing ability that few teams can match. Germany's defensive solidity was evident despite conceding once against Curacao, a match where they dominated possession and created numerous chances.
Ivory Coast arrives with confidence after their first World Cup appearance in 12 years. The Elephants have won five of their last six matches, including a notable 2-1 friendly victory over France. Their defensive organization against Ecuador showcased their ability to grind out results, with Yan Diomande earning FIFA Player of the Match honors. However, they will be without striker Elye Wahi, who was denied entry to Canada due to match-fixing allegations, potentially weakening their attacking options.
Head-to-Head History:
These nations have met only once at senior level, playing out a 2-2 draw in a friendly at Veltins-Arena in Gelsenkirchen on November 18, 2009. That historical result offers little guidance given the vastly different circumstances and personnel involved 17 years later.
Tactical Breakdown:
Germany's approach centers on controlling possession through their technically gifted midfield, stretching opponents with overlapping full-backs, and exploiting spaces with intricate passing combinations. Nagelsmann's system demands high pressing and quick transitions, overwhelming opponents with sustained attacking pressure.
Ivory Coast will likely adopt a counter-attacking strategy, utilizing the pace of Amad Diallo and Yan Diomande on the break. Their success against Ecuador demonstrated discipline and organization, but facing Germany's relentless attack presents a different caliber of challenge entirely.
Key Factors:
The Toronto venue favors neither side significantly, though Germany's experience in major tournaments provides a psychological edge. Ivory Coast's confidence from their opening victory should not be underestimated, yet the quality gap between the squads remains substantial. Germany's ability to rotate fresh legs while maintaining performance levels adds another dimension to their advantage.
My Prediction:
Germany will secure a 3-1 victory over Ivory Coast. The Germans' superior attacking firepower and squad depth should prove decisive, though Ivory Coast's counter-attacking threat means they will likely find the net. Expect Germany to control possession from the outset, creating numerous chances through their creative midfielders, while Ivory Coast attempts to stay compact and hit on the break.
The match promises to be an entertaining encounter with Germany ultimately demonstrating why they are considered among the tournament favorites. Their combination of youth and experience, tactical flexibility under Nagelsmann, and momentum from their opening demolition of Curacao positions them strongly to claim all three points and effectively secure passage to the knockout stages.
repost-content-media
  • Reward
  • Comment
  • Repost
  • Share
#广场预测世界杯赢40000U
Tunisia vs Japan: World Cup 2026 Group F Match Analysis - Based on Polymarket Predictions
The upcoming clash between Tunisia and Japan in Group F of the 2026 FIFA World Cup presents a fascinating tactical battle between two teams at very different stages of their tournament campaigns. Scheduled for June 20, 2026 at Estadio BBVA in Guadalupe, Mexico, this fixture carries significant weight for both nations as they seek to advance from what many consider one of the more competitive groups in this expanded 48-team tournament.
Polymarket Prediction Market Analysis
According to Poly
HighAmbition
#广场预测世界杯赢40000U
Tunisia vs Japan: World Cup 2026 Group F Match Analysis - Based on Polymarket Predictions
The upcoming clash between Tunisia and Japan in Group F of the 2026 FIFA World Cup presents a fascinating tactical battle between two teams at very different stages of their tournament campaigns. Scheduled for June 20, 2026 at Estadio BBVA in Guadalupe, Mexico, this fixture carries significant weight for both nations as they seek to advance from what many consider one of the more competitive groups in this expanded 48-team tournament.
Polymarket Prediction Market Analysis
According to Polymarket, the world's largest prediction market, Japan enters this matchup as the clear favorite with traders assigning approximately 64.5% implied probability for a Japanese victory. This substantial market confidence reflects not just Japan's superior squad depth and recent form, but also the contrasting circumstances both teams face heading into this crucial second group game.
The prediction market data reveals that Japan's odds have remained relatively stable, supported by their resilient performance in their opening match against the Netherlands, where they secured a valuable 2-2 draw despite falling behind twice. Tunisia, meanwhile, finds itself in turmoil following a humiliating 5-1 defeat to Sweden in their opener, a result that led to the immediate dismissal of their manager and the appointment of an interim coach just days before facing Japan.
Team Form and Current Situation
Japan demonstrated remarkable character in their opening fixture against the Netherlands, one of the tournament favorites. Under the guidance of head coach Hajime Moriyasu, who has been in charge for nearly eight years, Japan showcased their tactical flexibility and mental resilience. The Samurai Blue pulled level twice through goals from Keito Nakamura and Daichi Kamada, with the equalizer coming in the 88th minute. This result has put Japan in a strong position to advance, and a victory against Tunisia would virtually secure their passage to the knockout stages.
The Japanese squad features an impressive blend of experienced campaigners and emerging talents. Takefusa Kubo remains their most important attacking option, capable of unlocking defenses with his dribbling and vision. Ritsu Doan provides width and creativity from the flanks, while Ayase Ueda offers a genuine goal threat through the center. The team's depth is evidenced by the fact that quality players like Takehiro Tomiyasu sometimes find themselves on the bench. Japan's tactical system under Moriyasu emphasizes high pressing, quick transitions, and structured possession play that has proven effective against both Asian and European opposition.
Tunisia, by contrast, approaches this match in a state of crisis. The Eagles of Carthage suffered their heaviest World Cup defeat in the opening game against Sweden, conceding five goals in a performance that exposed significant defensive frailties and a lack of cohesion throughout the team. The 5-1 loss prompted the Tunisian Football Federation to take immediate action, replacing their coach with an interim appointment. This upheaval comes at the worst possible time, with the team needing to regroup quickly to salvage their tournament hopes.
The North African side had actually qualified for the World Cup with an impressive defensive record, becoming the first nation in history to complete a World Cup qualifying campaign without conceding a single goal. However, that defensive solidity completely evaporated against Sweden, raising serious questions about their ability to compete at this level. Key players like Ellyes Skhiri, Hannibal Mejbri, and Yassine Meriah will need to rediscover their form quickly if Tunisia is to have any chance of upsetting the odds.
Tactical Breakdown and Key Matchups
From a tactical perspective, this match presents a clear contrast in styles. Japan will look to dominate possession, using their technical superiority and quick passing combinations to break down what is expected to be a compact Tunisian defensive block. Moriyasu's side typically operates with a fluid system that can shift between different formations, often utilizing a back three that allows their wing-backs to push high and create overloads in wide areas.
Tunisia's best hope lies in organization and discipline. Under their new interim management, they are expected to adopt a more defensive approach, looking to frustrate Japan and hit on the counter-attack when opportunities arise. The Eagles of Carthage possess pace in wide areas and physical presence in midfield, but their confidence will be fragile after the Sweden debacle. Set pieces could represent their most likely route to goal, given Japan's occasional vulnerability in defending aerial situations.
The midfield battle will be crucial. Japan's Kaishu Sano is expected to anchor their midfield, providing the platform for more creative players to influence the game. Tunisia will rely on experienced campaigners like Skhiri to disrupt Japan's rhythm and protect their backline. If Tunisia can successfully congest the central areas and force Japan wide, they may be able to limit the clear-cut chances their opponents create.
My Analysis and Prediction
Based on the available evidence, including Polymarket's prediction data and the respective form of both teams, I believe Japan will secure victory in this encounter. The 64.5% implied probability assigned by prediction market traders aligns with my assessment of the matchup.
Japan's advantages are multiple and significant. They possess superior technical quality, better tactical organization, greater squad depth, and crucially, they enter the match with confidence intact following their impressive comeback against the Netherlands. The stability provided by Moriyasu's long tenure and the clear identity he has established for this team cannot be overstated. Japan knows exactly what they are trying to achieve and has the players capable of executing that game plan.
Tunisia faces an almost impossible task in trying to turn around their fortunes so quickly after the managerial change and heavy defeat. While they have quality players who performed admirably during qualification, the psychological damage of the Sweden result combined with the disruption of changing coaches makes a significant improvement unlikely. Their defensive record in qualifying suggests they are capable of better, but the step up in competition has exposed limitations that will be difficult to address in just a few days.
The match will likely follow a pattern where Japan controls possession and probes for openings, while Tunisia attempts to remain compact and look for counter-attacking opportunities. Japan's patience and ability to vary their attacking approach should eventually tell, particularly as the game progresses and Tunisian legs tire from defending deep.
I predict Japan will win this match by a scoreline of 2-0 or 2-1. The Japanese victory probability in my estimation is approximately 70%, slightly higher than the Polymarket consensus, reflecting my belief that Tunisia's off-field turmoil will prove decisive. A draw, while possible if Tunisia can rediscover their defensive organization, appears unlikely given the contrasting momentum of the two sides
Broader Group F Implications
This match carries significant implications for the final Group F standings. The Netherlands and Sweden are the other two teams in the group, with the Dutch being heavy favorites to top the section. Japan's draw against the Netherlands puts them in a strong position, and victory against Tunisia would likely set up a decisive final match against Sweden for group supremacy or secure qualification.
For Tunisia, defeat would almost certainly eliminate them from contention, making their final match against the Netherlands a mere formality. Even a draw would leave them needing an improbable combination of results in the final round of fixtures. The pressure is therefore immense on the North African side, which may paradoxically work against them as they face a Japanese team that can afford to play with more patience and confidence.
Conclusion
The Tunisia versus Japan match represents a classic World Cup group stage encounter between a team in crisis and a team building momentum. The prediction markets, team form, tactical analysis, and psychological factors all point toward a Japanese victory. While football occasionally produces surprises that defy logic and probability, the circumstances surrounding this particular fixture make an upset highly unlikely.
Japan's blend of technical excellence, tactical sophistication, and mental resilience developed under Moriyasu's long-term project should prove too much for a Tunisian side struggling to recover from their opening game trauma. The Samurai Blue have the opportunity to take a significant step toward the knockout stages, and I expect them to seize it with a professional performance that reflects their status as one of Asia's most progressive football nations.
For Tunisia, this match represents a damage limitation exercise and an opportunity to restore some pride. Realistically, their World Cup campaign may already be over before this second game kicks off, but sport has a way of producing unexpected narratives. However, based on all available evidence and analysis, Japan's victory appears the most probable outcome, with the prediction markets correctly identifying the likely winner of this Group F encounter.
@Gate_Square
#认证创作者专属推广任务
repost-content-media
  • Reward
  • Comment
  • Repost
  • Share
#ShareYourUSStocksWinNvidia
The SAMSUNG/USD Perpetual Futures contract trading on Hyperliquid represents a derivative instrument that tracks the performance of Samsung Electronics stock without requiring direct equity ownership. This perpetual contract allows traders to gain exposure to Samsung price movements with the flexibility of cryptocurrency-style trading mechanics including leverage and continuous trading hours. The current trading environment shows significant activity with the contract experiencing a positive daily movement of over two percent, indicating healthy market participatio
SAMSUNG-7.22%
HighAmbition
#ShareYourUSStocksWinNvidia
The SAMSUNG/USD Perpetual Futures contract trading on Hyperliquid represents a derivative instrument that tracks the performance of Samsung Electronics stock without requiring direct equity ownership. This perpetual contract allows traders to gain exposure to Samsung price movements with the flexibility of cryptocurrency-style trading mechanics including leverage and continuous trading hours. The current trading environment shows significant activity with the contract experiencing a positive daily movement of over two percent, indicating healthy market participation and interest from traders seeking exposure to the Korean technology giant.
Understanding the current price action is essential for developing an effective trading strategy. The contract opened at 192.54 and has traded within a daily range of 192.54 to 201.49, demonstrating reasonable volatility that creates opportunities for both short-term scalpers and longer-term position traders. The previous close at 192.54 provides context for overnight sentiment, while the current price level near 199 suggests the market is maintaining bullish momentum with buyers showing willingness to push prices higher throughout the trading session.
Support and resistance analysis forms the foundation of any sound trading approach. At the current price level around 199, several key technical levels demand attention. Immediate support can be identified around the daily open of 192.54, which represents the session low and a level where buyers initially stepped in. Below this, psychological support exists at 190, followed by stronger technical support near 185. These levels become critical for risk management as they represent areas where selling pressure historically encounters buying interest.
On the resistance side, the immediate challenge appears at the daily high of 201.49, which represents the upper boundary of current price exploration. A decisive break above this level could open the path toward the next psychological resistance at 205, followed by more substantial resistance near 210. These resistance levels are not arbitrary numbers but represent zones where supply has previously overwhelmed demand, requiring significant buying conviction to overcome.
The trading plan for SAMSUNG perpetual futures at current levels requires careful consideration of multiple factors. Entry strategy should focus on identifying optimal risk-reward setups. For bullish positions, waiting for a pullback toward the 195 to 197 range offers better entry pricing than chasing at current levels. This approach allows traders to position themselves near support while maintaining logical stop placement below the 192 session low. Alternatively, momentum traders might consider entries on confirmed breaks above 201.50 with the expectation of continued upward movement.
Risk management remains paramount when trading perpetual futures due to the leverage typically available and the funding rate mechanics that affect holding costs. Position sizing should never exceed comfortable risk parameters, with individual trades representing no more than two to five percent of total trading capital. Stop loss placement requires balancing protection against normal market noise while allowing sufficient room for the trade to develop. For long positions entered near 199, stops below 192 provide reasonable protection while acknowledging the daily range volatility.
Target setting should follow a tiered approach to maximize profitability while managing risk. Initial profit targets near 205 capture the first resistance level and represent a three percent gain from current levels. Secondary targets at 210 offer more substantial returns of approximately five to six percent while requiring sustained bullish momentum. Traders employing this approach should consider partial profit-taking at each target level, reducing exposure while letting remaining positions run with trailing stops to capture extended moves.
The broader market context significantly impacts SAMSUNG perpetual futures performance. Samsung Electronics operates as a major semiconductor and technology conglomerate with exposure to multiple growth sectors including artificial intelligence memory solutions, smartphone manufacturing, and display technologies. Recent analyst upgrades and positive sentiment surrounding high-bandwidth memory demand create a favorable fundamental backdrop that supports higher valuations. Goldman Sachs has notably raised price targets significantly, reflecting confidence in the company's ability to capitalize on artificial intelligence infrastructure spending.
Funding rates on perpetual contracts require constant monitoring as they represent the cost of holding positions overnight. Positive funding rates indicate long positions paying shorts, suggesting bullish sentiment but also increasing holding costs for extended positions. Traders should factor these costs into their holding period calculations and adjust position sizes accordingly. Periods of elevated funding rates might suggest crowded positioning, increasing the risk of sudden reversals.
Technical indicators can provide additional confirmation for trading decisions. Moving averages help identify trend direction with the fifty-period and two-hundred-period averages serving as dynamic support and resistance levels. Volume analysis reveals the conviction behind price movements, with breakouts on high volume carrying more significance than those on low participation. Momentum indicators such as relative strength index help identify overbought or oversold conditions that might signal potential reversal points.
Market sentiment analysis extends beyond technical indicators to include broader risk appetite measures. Technology sector performance, Korean won exchange rate movements, and global semiconductor demand all influence Samsung stock performance and by extension the perpetual contract. Traders should monitor these macro factors alongside technical levels to develop a complete market understanding.
Execution considerations for SAMSUNG perpetual futures include understanding the specific contract specifications on Hyperliquid. Tick sizes, minimum order quantities, and available leverage all impact trading decisions. Using limit orders rather than market orders helps avoid slippage, particularly important in less liquid periods or during volatile news events. Traders should also familiarize themselves with the platform's liquidation mechanics to avoid forced position closures during adverse moves.
Psychological factors play a crucial role in trading success. The fear of missing out can drive poor entry decisions, while loss aversion might cause premature exits from profitable positions. Developing and adhering to a predetermined trading plan helps mitigate these emotional responses. Recording trade rationales and outcomes facilitates continuous improvement and pattern recognition.
The path forward for SAMSUNG perpetual futures appears constructive based on current technical positioning and fundamental tailwinds. However, traders must remain vigilant for changes in market conditions that could invalidate current assumptions. Regular reassessment of support and resistance levels as price action develops ensures the trading plan remains relevant and responsive to evolving market dynamics.
In conclusion, trading SAMSUNG perpetual futures at current price levels around 199 offers opportunities for disciplined traders who approach the market with proper risk management and clear strategic objectives. The combination of favorable technical positioning, supportive fundamental factors, and reasonable volatility creates an environment where well-planned trades can achieve attractive risk-adjusted returns. Success requires patience in waiting for optimal entry points, discipline in adhering to stop losses, and flexibility in adapting to changing market conditions.@Gate_Square #ShareYourUSStocksWinNvidia #TradeCFDWinGold
repost-content-media
  • Reward
  • Comment
  • Repost
  • Share
#ShareYourUSStocksWinNvidia
#NVDAX
NVDAX is currently trading at $207.7, showing resilience after fluctuating between $204.21 and $208.25 over the past 24 hours. The stock has registered a modest gain of 0.03% in the daily timeframe while experiencing a pullback of 4.33% over the past week. Trading volume has seen significant expansion alongside price movements, indicating heightened institutional participation and stronger capital flows into the asset.
Technical Analysis Across Multiple Timeframes
On the 15-minute chart, NVDAX displays a bullish moving average alignment with MA7 positioned
NVDAX-0.60%
HighAmbition
#ShareYourUSStocksWinNvidia
#NVDAX
NVDAX is currently trading at $207.7, showing resilience after fluctuating between $204.21 and $208.25 over the past 24 hours. The stock has registered a modest gain of 0.03% in the daily timeframe while experiencing a pullback of 4.33% over the past week. Trading volume has seen significant expansion alongside price movements, indicating heightened institutional participation and stronger capital flows into the asset.
Technical Analysis Across Multiple Timeframes
On the 15-minute chart, NVDAX displays a bullish moving average alignment with MA7 positioned above MA30 and MA120, suggesting short-term upward momentum. However, both the CCI and Williams Percentage Range indicators have entered overbought territory, signaling potential exhaustion in buying pressure and the possibility of a near-term correction. Traders should exercise caution as these oscillators approach extreme levels.
The 4-hour timeframe presents a contrasting picture with a bearish moving average configuration where MA7 sits below MA30 and MA120, indicating a clear downtrend in the medium-term perspective. This divergence between short-term and medium-term signals suggests consolidation or range-bound behavior may persist in the immediate future.
Daily timeframe analysis reveals a concerning MACD bearish divergence pattern where price has achieved new highs while the DIF line failed to confirm this movement. This classic technical signal often precedes short-term pullbacks and warrants defensive positioning for risk-averse traders.
Critical Support and Resistance Levels
Immediate support is established at approximately $204.21, representing the recent 24-hour low and a key demand zone where buyers have previously stepped in. A secondary support level exists around $200, which aligns with psychological round-number support and previous consolidation areas. The major support floor is located at $183, based on medium-term trend analysis, where substantial buying interest would be expected to emerge.
On the resistance side, immediate resistance stands at $208.25, marking the recent 24-hour high. A decisive break above this level could open the path toward $212-$215, representing the next congestion zone. The significant resistance cluster exists between $235 and $255, where prior price rejection and profit-taking activities have been observed. Analyst price targets from major institutions cluster around $255-$270, with some bullish projections extending toward $272 based on fundamental catalysts.
Price Forecast and Scenario Analysis
The bull case for NVDAX remains compelling despite recent consolidation. Fundamental drivers include the ongoing Blackwell architecture ramp, accelerating agentic AI demand, and full-stack platform stickiness that increases customer switching costs. Meta Platforms has committed to millions of Blackwell and Rubin GPUs, while OpenAI is building more than 10 gigawatts of NVIDIA systems. CEO Jensen Huang has indicated the company sees at least $1 trillion in orders for Blackwell and Vera Rubin through 2027. Under this optimistic scenario, price targets of $255-$272 appear achievable over the next 12 months, representing upside potential of approximately 23-31% from current levels.
The base case scenario assumes continued execution on revenue guidance of approximately $78 billion for Q1 FY2027, stable gross margins around 75%, and gradual recovery in China Data Center contributions. This outlook supports a price target of $237-$245, consistent with consensus analyst estimates and representing 14-18% upside potential.
The bear case centers on geopolitical risks, particularly the complete exclusion of China Data Center compute contribution from guidance, estimated at approximately $50 billion in addressable market. Concentration risk from hyperscalers representing 50% of Data Center revenue presents additional vulnerability. Should these headwinds materialize alongside broader tech sector weakness, support at $183 becomes critical, with potential downside extending toward $175-$180 in a risk-off environment.
Strategic Trading Plan
For active traders, the current price action suggests a range-bound approach between $204 support and $208 resistance. Consider initiating long positions on confirmed breaks above $208.25 with targets at $212, $215, and eventually $235. Stop-loss orders should be placed below $203 to protect against false breakouts.
Swing traders might accumulate positions near the $204-$205 support zone with a medium-term horizon targeting $235-$255. Risk management remains paramount given the bearish MACD divergence on the daily chart, suggesting position sizing should reflect elevated volatility expectations.
Investors with longer time horizons can view current levels as accumulation opportunities, particularly on any weakness toward $200 or the $183 support level. The structural AI infrastructure demand narrative remains intact, and valuation compression from previous highs has improved the risk-reward profile for patient capital.
Volume analysis confirms institutional interest remains robust, with 24-hour trading activity significantly elevated. This liquidity environment supports efficient execution for both entry and exit strategies. Monitor earnings announcements, guidance updates, and geopolitical developments closely as these catalysts will likely determine the next directional move.
Risk management protocols should include strict stop-loss discipline, position sizing appropriate for account risk tolerance, and awareness of the 4-hour bearish trend alignment that may produce headwinds for bullish positions in the near term.@Gate_Square #Web3SecurityGuide #GMTokenLaunchAndPromotion #CryptoSurvivalGuide
repost-content-media
  • Reward
  • Comment
  • Repost
  • Share
#StrongNonfarmPayrollsRekindleRateHikeFear
On June 5, 2026, the United States Bureau of Labor Statistics released the May Nonfarm Payrolls report, and the numbers shocked the market. The US economy added 172,000 jobs in May, which was roughly double what economists had predicted. The consensus forecast was only 85,000 jobs, with some estimates clustering between 80,000 and 88,000. The unemployment rate held steady at 4.3 percent, right in line with expectations. This was not just a small beat; it was a blowout. The previous month of April had already been revised upward to 179,000 jobs, so th
HighAmbition
#StrongNonfarmPayrollsRekindleRateHikeFear
On June 5, 2026, the United States Bureau of Labor Statistics released the May Nonfarm Payrolls report, and the numbers shocked the market. The US economy added 172,000 jobs in May, which was roughly double what economists had predicted. The consensus forecast was only 85,000 jobs, with some estimates clustering between 80,000 and 88,000. The unemployment rate held steady at 4.3 percent, right in line with expectations. This was not just a small beat; it was a blowout. The previous month of April had already been revised upward to 179,000 jobs, so the labor market was showing no signs of slowing down whatsoever. The three-month average of job gains remained solid, painting a picture of an economy that was still humming along at a steady pace, with companies continuing to hire, consumers continuing to spend, and wages continuing to rise.
The key term in the headline is "Rekindle." This word means to reignite or bring back something that had previously faded. In this context, it means that the fear of interest rate hikes, which had somewhat diminished in earlier months as the market hoped for rate cuts, has now come roaring back to life. Before this NFP report, many investors and market participants had been building their strategies around the expectation that the Federal Reserve would eventually cut interest rates. The narrative was that the labor market was stagnating, layoffs were increasing, and the economy was slowing down, all of which would push the Fed toward easing monetary policy. Wall Street was pricing in a gradual path of rate reductions. But the 172,000 jobs number shattered that narrative completely.
Here is why strong employment data rekindles rate hike fear, step by step. First, when job growth is robust, it signals that the economy is still strong and businesses are confident enough to hire more workers. Second, a strong economy with more people earning wages means more consumer spending, which drives demand for goods and services. Third, when demand outpaces supply, businesses can raise prices, which fuels inflation. Fourth, the Federal Reserve's primary mandate is to keep inflation under control, ideally around 2 percent. When inflation is running above target, as it was at 3.8 percent year-over-year in April 2026, the Fed cannot afford to lower interest rates because that would make borrowing even cheaper and further stimulate spending and inflation. Fifth, instead of cutting rates, the Fed may need to either keep rates elevated for longer or actually raise them further to cool down the economy and bring inflation back toward its target.
The reaction in the interest rate futures market was immediate and dramatic. According to CME's FedWatch tool, the probability of a Federal Reserve rate hike by the December 2026 policy meeting jumped to 68.4 percent, up from just 52 percent the day before the NFP report. For the June meeting, the market still expected the Fed to hold rates steady in the 3.50 to 3.75 percent range, but the December outlook shifted sharply toward tightening. The 10-year Treasury yield surged to 4.52 percent, and the 2-year yield jumped 7 basis points to 4.12 percent. Cleveland Fed President Beth Hammack, considered the most hawkish voting member on the Federal Open Market Committee, stated after the jobs report that it may soon be appropriate to raise rates, given that the labor market appears to be in balance and inflationary pressures remain elevated. Even JPMorgan's chief global strategist David Kelly acknowledged the situation, though he cautioned that it would be dangerous for the Fed to hike rates given the broader context.
The phrase "rekindle" is particularly important because the fear of rate hikes had existed before. In 2023 and early 2024, the Fed had already undertaken a series of rate hikes to combat rising inflation. By 2026, rates had come down from their peak to the 3.50 to 3.75 percent range, and many investors had started to believe the tightening cycle was over. The market had begun to look forward to rate cuts, which would make borrowing cheaper, encourage investment in risk assets like crypto and stocks, and generally create a more favorable environment for growth-oriented investments. But the strong NFP report reminded everyone that the Fed's battle against inflation is not yet won, and that the central bank might need to return to a more aggressive posture.
Now let us discuss what this all means for Bitcoin and the crypto market, step by step, in detail. When the NFP report was released on June 5, Bitcoin was already under pressure from multiple headwinds. The crypto had been declining for about 10 days, losing roughly 19,000 dollars from recent highs. But the NFP data accelerated the sell-off dramatically. Bitcoin dropped approximately 4 percent in the hours immediately following the report. It fell below the critical 60,000 dollar support level, reaching an intraday low of around 59,100 dollars before stabilizing near 59,400 dollars. This marked the weakest price for Bitcoin since October 2024. Over the past week alone, Bitcoin had fallen nearly 20 percent, and from its October peak above 126,000 dollars, it had lost more than 52 percent of its value.
The mechanism through which strong NFP data hits Bitcoin operates through several interconnected channels. The first channel is the interest rate channel. When rate hike expectations increase, borrowing costs rise across the economy. Higher interest rates make it more expensive to finance investments, and they reduce the attractiveness of risk assets like Bitcoin, which do not generate interest or dividends. Investors can earn a safer, guaranteed return by holding Treasury bonds or keeping money in savings accounts, so the relative appeal of risky speculative assets diminishes. The second channel is the dollar strength channel. Strong NFP data typically boosts confidence in the US economy, which strengthens the US dollar. A stronger dollar makes Bitcoin, which is priced in dollars, relatively more expensive for international buyers, reducing global demand. The third channel is the risk appetite channel. When investors fear that monetary policy will tighten, they tend to reduce their exposure to risk assets across the board. This means they pull capital not just from Bitcoin but from stocks, especially high-growth tech stocks, and from other speculative investments. The fourth channel is the liquidity channel. Higher interest rates drain liquidity from the financial system. Less liquidity means less money flowing into markets, which reduces buying pressure and can amplify selling pressure. The fifth channel is the sentiment channel. The psychological impact of rate hike fears creates a negative feedback loop. As prices fall, more investors panic and sell, driving prices even lower, which scares even more investors, and the cycle continues.
The broader crypto market also suffered. Crypto-linked stocks fell sharply after US markets opened on Friday, and the Fear and Greed Index had been sitting at 11, firmly in "Extreme Fear" territory. This reading is significant because it indicates that the market is psychologically positioned at a very pessimistic level, meaning most participants are too fearful to buy. However, historically, such extreme fear readings have sometimes preceded reversals, because once the selling exhausts itself, even a small positive catalyst can spark a rebound.
It is also worth noting that the NFP shock was not the only headwind facing Bitcoin at this time. Multiple negative factors converged simultaneously. Michael Saylor's Strategy, which had been Bitcoin's largest single buyer, had turned seller, removing a major source of demand. Bitcoin ETF investors were heading for the exits, with significant outflows reported. The prospect of interest rate hikes was adding macroeconomic pressure. And speculative capital was increasingly focused on the AI trade rather than crypto, drawing money away from digital assets. The combination of all these factors created what market analysts described as a "good news is bad news" scenario, where strong economic data was actually detrimental to risk assets because it implied tighter monetary policy ahead.
The geopolitical context also matters. The US-Iran conflict had disrupted Strait of Hormuz shipping lanes and pushed oil prices above 100 dollars per barrel at its peak, contributing to CPI inflation running at 3.8 percent year-over-year. This elevated inflation, combined with a resilient labor market, created a difficult situation for the Fed. The central bank was essentially trapped: inflation was above target and being fueled by both domestic demand and geopolitical energy shocks, while the job market showed no signs of weakening that would naturally slow down the economy. This dual pressure meant the Fed had little room to ease policy, which was precisely why rate hike fears were rekindled so strongly.
In summary, the headline "Strong Nonfarm Payrolls Rekindle Rate Hike Fear" captures a critical dynamic. The robust May jobs number of 172,000, double the expected 85,000, forced investors to completely reassess their assumptions about Federal Reserve policy. Where the market had been pricing in gradual rate cuts, it now had to confront the possibility of rate hikes. This shift rippled through every asset class. The dollar strengthened, Treasury yields spiked, gold fell 3.27 percent on the day, equities dropped, and Bitcoin broke below 60,000 dollars to its weakest level since October 2024. The crypto market entered extreme fear territory as multiple headwinds converged. The essential lesson is that in the current macro environment, strong economic data is bad news for risk assets because it implies the Fed will maintain or even increase its restrictive monetary policy stance, keeping the cost of capital high and reducing the attractiveness of speculative investments like Bitcoin.@Gate_Square #ShareYourUSStocksWinNvidia #IranAttacksIsrael #TradeCFDWinGold #Web3SecurityGuide
repost-content-media
  • Reward
  • Comment
  • Repost
  • Share
#BitcoinRalliesOver5Percent
Bitcoin Rallies Over 5 Percent: Is This the Beginning of a Larger Recovery?
Bitcoin has staged an impressive comeback, rallying more than 5 percent after finding strong support near $59,160 and reclaiming the $63,000 level. The recovery has reignited optimism across the cryptocurrency market after weeks of intense selling pressure that pushed Bitcoin to its lowest levels in many months. While the broader market remains cautious due to macroeconomic uncertainty and geopolitical risks, the latest rebound suggests that buyers are once again willing to step into the ma
HighAmbition
#BitcoinRalliesOver5Percent
Bitcoin Rallies Over 5 Percent: Is This the Beginning of a Larger Recovery?
Bitcoin has staged an impressive comeback, rallying more than 5 percent after finding strong support near $59,160 and reclaiming the $63,000 level. The recovery has reignited optimism across the cryptocurrency market after weeks of intense selling pressure that pushed Bitcoin to its lowest levels in many months. While the broader market remains cautious due to macroeconomic uncertainty and geopolitical risks, the latest rebound suggests that buyers are once again willing to step into the market at discounted prices.
The recent correction was driven by a combination of powerful headwinds. Strong US economic data, particularly the Nonfarm Payrolls report, reinforced concerns that the Federal Reserve may keep interest rates elevated for longer than previously expected. At the same time, persistent inflation pressures, rising Treasury yields, and escalating tensions in the Middle East created a risk-off environment that pressured nearly all speculative assets. Bitcoin, which is highly sensitive to global liquidity conditions, became one of the primary casualties of this shift in investor sentiment.
Despite these challenges, the speed and strength of Bitcoin's recovery highlight an important reality about the current market structure. Unlike previous bear markets, institutional participation remains significantly higher than in past cycles. Spot Bitcoin ETFs have introduced a new class of investors into the market, and many of these participants continue to view sharp corrections as strategic buying opportunities rather than reasons to abandon their positions. This institutional presence has helped create stronger demand zones during periods of extreme fear.
Another major factor supporting the rebound is the behavior of long-term holders. On-chain data continues to indicate that a substantial portion of Bitcoin holders have chosen not to sell despite the recent decline. Historically, when long-term investors remain confident during periods of panic, the market often finds a bottom sooner than expected. This reduction in selling pressure allows new buyers to absorb available supply more efficiently, creating the conditions necessary for recovery.
The rally has also been fueled by short-covering activity. During the decline below $60,000, many traders positioned themselves for further downside. When Bitcoin stabilized and began moving higher, these short sellers were forced to close their positions, creating additional buying pressure. This process accelerated the upward move and helped Bitcoin reclaim key technical levels within a relatively short period.
From a technical perspective, the market is now entering a critical phase. The $60,000 zone has become one of the most important support areas on the chart. The fact that Bitcoin quickly recovered after testing this level suggests that institutional and long-term demand remains strong. As long as price action remains above this region, the broader recovery structure remains intact.
The next major obstacle for the bulls lies between $65,000 and $68,000. This area previously acted as support before the recent breakdown and may now serve as resistance. A decisive breakout above this zone would significantly strengthen the bullish case and could trigger a larger move toward $70,000, $75,000, and potentially even $80,000. Market participants should pay close attention to trading volume during any breakout attempt, as strong volume would indicate genuine buying interest rather than a temporary short squeeze.
Macroeconomic conditions remain the most important external factor influencing Bitcoin's direction. The Federal Reserve continues to walk a difficult path between controlling inflation and maintaining economic growth. If future inflation reports show signs of cooling and economic activity begins to moderate, expectations for easier monetary policy could return. Such a scenario would likely benefit Bitcoin and other risk assets by improving liquidity conditions throughout the financial system.
On the other hand, if inflation remains stubbornly high and employment data continues to surprise to the upside, the Fed may be forced to maintain restrictive policies for longer. This would increase borrowing costs, strengthen the US dollar, and potentially limit upside momentum in the cryptocurrency market. For this reason, traders should closely monitor upcoming inflation data, employment reports, and Federal Reserve commentary.
Geopolitical developments also remain a significant source of uncertainty. The ongoing tensions involving Iran and Israel have already impacted commodity markets, energy prices, and investor sentiment. Historically, periods of geopolitical instability can create substantial volatility in Bitcoin. While initial reactions are often negative, prolonged uncertainty can sometimes increase interest in decentralized assets that operate independently of traditional financial systems.
One overlooked factor supporting Bitcoin is the continued reduction in available exchange supply. Over the past several years, a growing amount of Bitcoin has been moved into long-term storage and institutional custody solutions. When fewer coins are available for immediate sale, even moderate increases in demand can produce significant price movements. This supply dynamic could become increasingly important if institutional inflows begin accelerating again.
Another positive development is the gradual recovery of market sentiment. Fear and Greed indicators recently reached extreme fear levels, reflecting widespread pessimism among investors. Historically, such conditions have often appeared near important market bottoms because most potential sellers have already exited their positions. As confidence slowly returns, sidelined capital may begin re-entering the market, providing additional support for prices.
Looking ahead, the bullish scenario remains straightforward. If Bitcoin successfully maintains support above $60,000 and breaks through resistance near $65,000, momentum could quickly carry prices toward $70,000 and beyond. A sustained move above $70,000 would likely attract renewed institutional interest and strengthen confidence that the correction phase is ending.
The bearish scenario cannot be ignored. A failure to hold above $60,000 would expose Bitcoin to another test of the recent low near $59,160. If that support level breaks, the market could revisit lower zones around $57,000 or $55,000 before finding stronger demand. Traders should remain disciplined and avoid becoming overly emotional in either direction.
Trading Strategy
Accumulation remains favorable above the $60,000 support zone for traders with a bullish outlook. Conservative investors may wait for confirmation through a breakout above $65,000 before increasing exposure. Short-term targets remain $65,000, $68,000, $70,000, and $75,000, while longer-term investors may continue focusing on the broader adoption trend and future cycle potential.
Risk management should remain the top priority. Volatility is likely to remain elevated as markets digest economic data, geopolitical developments, and Federal Reserve expectations. Proper position sizing and disciplined stop-loss management remain essential for navigating the current environment.
Bitcoin's rally of more than 5 percent represents more than just a short-term bounce. It reflects renewed buyer confidence, resilient institutional demand, strong long-term holder conviction, and a market that continues to attract capital despite significant macroeconomic challenges. While risks remain and volatility is far from over, the recovery from $59,160 to above $63,000 suggests that Bitcoin may be in the early stages of rebuilding momentum.
The battle between bulls and bears is now centered around the $60,000–$65,000 range. A breakout above resistance could signal the beginning of a broader recovery phase, while a failure to maintain support would increase the risk of another correction. For now, the market appears to be stabilizing, and all eyes are on whether Bitcoin can transform this 5 percent rally into the foundation for its next major upward move.@Gate_Square #ShareYourUSStocksWinNvidia #WinGoldBarsWithGrowthPoints #TradeCFDWinGold
repost-content-media
  • Reward
  • Comment
  • Repost
  • Share
#BitminePlans300MPreferredStockOffering
BitMine Immersion Technologies (BMNR) has announced a major capital raising initiative of approximately $300 million through a Series A Perpetual Preferred Stock issuance. The structure includes 3 million shares priced at $100 each, offering a 9.5% annual cumulative dividend, paid weekly when declared. While this appears to be a conventional financial instrument on the surface, the real market interpretation is far more significant: it is increasingly being viewed as a large-scale institutional liquidity pipeline potentially directed toward cryptocurren
HighAmbition
#BitminePlans300MPreferredStockOffering
BitMine Immersion Technologies (BMNR) has announced a major capital raising initiative of approximately $300 million through a Series A Perpetual Preferred Stock issuance. The structure includes 3 million shares priced at $100 each, offering a 9.5% annual cumulative dividend, paid weekly when declared. While this appears to be a conventional financial instrument on the surface, the real market interpretation is far more significant: it is increasingly being viewed as a large-scale institutional liquidity pipeline potentially directed toward cryptocurrency accumulation.
This development arrives at a critical stage for global markets where Bitcoin, Ethereum, gold, and oil are all reacting to a combination of macroeconomic stress, geopolitical instability, and shifting institutional capital flows. The importance of BitMine’s action is not only in the size of the raise, but in the strategic signal it sends regarding long-term crypto demand from publicly traded companies.
1. Current Market Environment (Macro + Crypto + Commodities)
At the time of analysis, global markets are positioned in a highly sensitive equilibrium:
Bitcoin (BTC): $63,200
Ethereum (ETH): $1,684
Gold (XAU/USD): $4,320
WTI Crude Oil: $94.50
Each of these assets is responding to overlapping macro forces:
Key macro drivers:
Persistent inflation pressure in the US economy
Strong labor market data reducing expectations of near-term rate cuts
Elevated Treasury yields tightening global liquidity
US Federal Reserve maintaining restrictive policy stance
Iran–Israel geopolitical conflict increasing risk premiums
Oil supply disruption fears via the Strait of Hormuz
Mixed institutional flows in crypto ETFs
This environment creates a “dual-pressure market” where:
Risk assets struggle due to liquidity tightening
Safe-haven assets gain from uncertainty
Commodities react to geopolitical disruption
2. BitMine Strategic Positioning (Core Business Shift)
BitMine is no longer functioning as a traditional technology or mining-focused firm in market perception. Instead, it is increasingly classified as a crypto treasury accumulation entity.
Current reported holdings include:
ETH: 4,000,000+ ETH (approx. $6.7B+ value at $1,684)
BTC: ~192 BTC (approx. $12M+)
Total crypto + cash exposure: ~$13.4B
Additional equity exposure in crypto-linked firms
This places BitMine among the largest institutional crypto holders globally, comparable in strategic influence (not structure) to early Bitcoin treasury adopters.
The central strategy is:
Increase crypto holdings per share over time, using capital markets as a funding engine.
This model creates a self-reinforcing structure: capital raise → crypto accumulation → balance sheet expansion → market revaluation → further capital access
3. Structure of the $300M Preferred Offering (Financial Breakdown)
Total raise: $300,000,000
Security type: Series A Perpetual Preferred Stock
Units: 3,000,000 shares
Price per share: $100
Dividend: 9.5% annually (cumulative)
Payment schedule: weekly (conditional on declaration)
This structure is significant because:
9.5% yield implies $28.5M annual dividend obligation
Likely requires yield generation via staking + treasury strategies
Creates incentive for productive capital deployment rather than passive holding
This makes the instrument effectively:
part fixed income product
part crypto-linked yield instrument
part leveraged digital asset accumulation vehicle
4. Bitcoin Market Structure and Price Context
Bitcoin Current Market: $63,200
Recent price structure:
Recent low: $59,160
Recovery zone: $60,000 – $63,500
Previous high cycle: $126,000 (2025 peak)
Market condition:
Approx. -50% from cycle peak
High volatility compression phase
Institutional accumulation zone forming
Key Bitcoin dynamics:
(A) Supply Scarcity Effect
Bitcoin supply is capped at 21 million coins. Institutional treasury accumulation reduces circulating liquidity, especially when assets are moved into long-term custody.
At current price:
$300M = approx. 4,700 BTC
Total circulating supply impact appears small numerically
But liquidity impact is amplified due to OTC accumulation behavior
(B) ETF + Treasury Dual Demand
Market now has two structural demand engines:
Spot ETFs (passive institutional inflow)
Corporate treasuries (active accumulation)
This dual structure creates sustained demand pressure even during corrections.
(C) Liquidity Sensitivity
Bitcoin is highly sensitive to:
US dollar strength
Treasury yields (currently ~4%+ region)
Fed rate expectations
Global liquidity cycles
5. Ethereum Market Structure (Key Focus Asset)
Ethereum Current Price: $1,684
Ethereum is strategically more important in this specific narrative due to BitMine’s accumulation bias.
Ethereum strengths in this context:
Proof-of-stake yield generation (staking rewards)
Reduced supply via locked staking contracts
Increasing institutional infrastructure adoption
Tokenization and real-world asset integration trend
If even a moderate portion of $300M flows into ETH:
potential ETH absorption: ~170,000 ETH to 200,000 ETH equivalent
significant short-term liquidity compression possible
Ethereum market structure:
Major support: $1,600 / $1,550 / $1,450
Resistance: $1,750 / $1,850 / $2,000
ETH tends to outperform BTC in percentage terms during capital inflow phases due to lower market cap elasticity.
6. Gold Market Position (Safe-Haven Dynamics)
Gold Current Price: $4,320
Gold remains structurally strong despite short-term corrections:
Historical peak: ~$5,598 earlier cycle high
Yearly performance: +40% to +41%
Current phase: consolidation after macro-driven rally
Gold is reacting to:
geopolitical tension demand
inflation hedge positioning
central bank accumulation behavior
USD volatility cycles
Key levels:
Support: $4,300 / $4,200 / $4,000
Resistance: $4,500 / $4,600 / $4,800
Gold and Bitcoin currently operate in parallel but different narratives:
Gold = traditional safety hedge
Bitcoin = digital liquidity + speculative hedge
7. Oil Market Shock (Geopolitical Supply Risk)
Oil Current Price: $94.50
Oil is the most directly impacted asset due to the Iran–Israel conflict and Strait of Hormuz disruption risks.
Key structural issue:
~20% of global oil passes through Hormuz
~20% LNG flow affected
Supply stress implications:
global inflation pressure increases
transportation costs rise
manufacturing input costs increase
central bank policy becomes more restrictive
Oil scenarios:
Upside breakout: $100 → $105 → $110
Downside correction: $90 → $85
Oil at elevated levels directly impacts Bitcoin and risk assets through inflation and liquidity tightening channels.
8. Market Interconnection Model (Critical Insight)
All major assets are now interconnected:
If oil rises:
inflation rises
Fed remains hawkish
BTC & ETH face liquidity pressure
If gold rises:
risk-off sentiment increases
capital shifts away from equities/crypto
If BTC rises:
risk-on sentiment returns
ETH typically follows with higher beta movement
If institutional crypto raises increase:
long-term structural bullish cycle strengthens
9. Risk Factors for Crypto Impact
Despite bullish structural signals, key risks remain:
No confirmation that full $300M will go into BTC or ETH
Heavy allocation may go to Ethereum only
ETF outflows remain inconsistent
High interest rate environment suppresses liquidity
Geopolitical escalation can trigger sudden sell-offs
Treasury company valuations already under pressure
Recent data shows:
crypto treasury sector lost significant market value in recent months
market is transitioning from hype phase to consolidation phase
10. Full Trading Structure Summary
Bitcoin (BTC)
Current: $63,200
Bull case: $65,000 → $68,000 → $70,000 → $75,000
Bear case: $60,000 → $59,160 → $57,000 → $55,000
Ethereum (ETH)
Current: $1,684
Bull case: $1,750 → $1,850 → $2,000 → $2,200
Bear case: $1,600 → $1,550 → $1,450
Oil (WTI)
Current: $94.50
Bull case: $100 → $105 → $110
Bear case: $90 → $85
Gold
Current: $4,320
Bull case: $4,500 → $4,600 → $4,800
Bear case: $4,200 → $4,000
11. Final Conclusion (Core Market Message)
BitMine’s $300M preferred stock offering is not an isolated corporate financing event—it is part of a broader structural transformation where institutional capital markets are increasingly being used to fund direct exposure to digital assets.
The key implications are:
Bitcoin gains structural support through treasury accumulation narrative
Ethereum may receive disproportionate benefit due to BitMine’s historical strategy
Liquidity conditions remain the primary macro driver of all crypto assets
Oil-driven inflation risk continues to shape Federal Reserve policy
Gold remains the macro hedge against uncertainty
Ultimately, this development reinforces one central theme:
Crypto markets are increasingly being driven not by retail speculation alone, but by structured institutional capital flows that operate through corporate balance sheets, ETFs, and treasury expansion models.
The next phase of price action across Bitcoin and Ethereum will depend not only on market sentiment—but on how aggressively institutional capital deployment accelerates following this and similar capital raises.@Gate_Square #ShareYourUSStocksWinNvidia #TradeCFDWinGold
repost-content-media
  • Reward
  • Comment
  • Repost
  • Share
#GatePartnersWithAlpacaToBridgeCryptoAndStocks
Gate has officially announced a strategic partnership with Alpaca, a US-regulated self-clearing broker-dealer, marking a significant milestone in the evolution of multi-asset trading platforms. This collaboration is designed to bring real US stock trading directly into the Gate ecosystem, enabling users to access both cryptocurrency markets and traditional financial assets within a single unified platform. It represents a major step in Gate’s long-term strategy to transform from a crypto exchange into a global financial super-app.
At its core, th
HighAmbition
#GatePartnersWithAlpacaToBridgeCryptoAndStocks
Gate has officially announced a strategic partnership with Alpaca, a US-regulated self-clearing broker-dealer, marking a significant milestone in the evolution of multi-asset trading platforms. This collaboration is designed to bring real US stock trading directly into the Gate ecosystem, enabling users to access both cryptocurrency markets and traditional financial assets within a single unified platform. It represents a major step in Gate’s long-term strategy to transform from a crypto exchange into a global financial super-app.
At its core, this partnership is focused on eliminating the long-standing divide between digital assets and traditional equity markets. For years, investors have been forced to operate across separate financial systems. Crypto traders use exchanges for digital assets like Bitcoin and Ethereum, while stock investors rely on traditional brokerage accounts to access equities. This separation creates friction, slows down capital movement, and increases complexity for global investors. Gate and Alpaca aim to solve this problem by merging both ecosystems into a single seamless trading experience.
With this integration, users will be able to trade cryptocurrencies, US stocks, and ETFs side by side without switching platforms, converting funds manually, or dealing with multiple onboarding processes. This creates a unified financial environment where capital can move freely between asset classes in real time.
Alpaca plays a critical role in making this vision possible. As a regulated US broker-dealer, Alpaca provides institutional-grade brokerage infrastructure that powers the entire lifecycle of stock trading. This includes order execution, clearing, settlement, custody of assets, dividend processing, and handling corporate actions. Alpaca’s API-first architecture is already used by fintech platforms globally, supporting millions of brokerage accounts. By integrating this system, Gate can offer full stock trading functionality without building a traditional brokerage infrastructure from the ground up, which would otherwise require years of development and massive regulatory overhead.
Through this partnership, Gate users will gain access to more than 10,000 US-listed stocks and ETFs across major exchanges including NASDAQ, NYSE, NYSE Arca, NYSE American, and BATS. This coverage spans nearly the entire US equity market. It includes globally recognized technology leaders such as Apple, Microsoft, Amazon, Google (Alphabet), Meta, Tesla, and NVIDIA, as well as traditional industrial giants, financial institutions, healthcare companies, and energy firms. In addition, users can invest in major ETFs such as the S&P 500, Nasdaq 100, and sector-based funds that provide diversified exposure to the broader market.
One of the most impactful features of this system is fractional share investing. Gate enables users to invest in US stocks starting from just $1, removing one of the biggest barriers in traditional equity markets. Previously, high stock prices often prevented small retail investors from accessing premium companies. For example, buying a full share of companies like Amazon or NVIDIA could require hundreds or even thousands of dollars. Fractional ownership solves this problem by allowing users to purchase a portion of a share, making investing far more flexible, inclusive, and globally accessible.
Another major innovation is the use of USDT-based trading for stocks. Users can directly deploy stablecoins like USDT to purchase equities without needing to convert funds into fiat currencies through banks or external financial institutions. This significantly reduces friction and improves speed. A user can hold Bitcoin or Ethereum, convert it into USDT within Gate, and immediately invest in Apple or Tesla stocks—all within the same ecosystem. This crypto-native workflow is designed to preserve the efficiency and speed that digital asset users are already familiar with.
A key distinction in Gate’s offering is that it provides real stock ownership, not derivative-based exposure such as CFDs. When users buy a stock on Gate, they are acquiring actual shares of the underlying company. This includes full ownership rights such as dividend eligibility and participation in corporate actions like stock splits or mergers. Unlike CFD products, there are no hidden overnight financing fees or leveraged derivative structures involved. This makes the product more suitable for long-term investors who want genuine exposure to equity markets rather than short-term speculative instruments.
From a portfolio management perspective, this integration offers significant advantages.
Instead of managing separate accounts across crypto exchanges and traditional brokerage platforms, users can now consolidate all their assets into one unified dashboard. This includes cryptocurrencies, US stocks, ETFs, and potentially other financial instruments in the future. The ability to view and manage everything in one place improves transparency, simplifies decision-making, and enhances strategic asset allocation.
For global investors, this unified structure also enables more efficient diversification. A user can balance risk across Bitcoin, Ethereum, technology stocks, and index ETFs without moving between platforms or dealing with settlement delays. This level of integration allows for faster reactions to market movements and more precise portfolio rebalancing.
From a broader industry perspective, the Gate-Alpaca partnership reflects a powerful global trend: the convergence of crypto platforms and traditional financial systems. Exchanges are no longer limited to digital asset trading alone. Instead, they are evolving into comprehensive financial ecosystems that offer access to multiple asset classes under one roof. This shift indicates that the boundary between decentralized finance and traditional finance is gradually dissolving.
As regulatory clarity improves and infrastructure becomes more advanced, more platforms are expected to follow this model. The integration of stocks, crypto, ETFs, commodities, and other financial instruments into a single ecosystem represents the next phase of financial evolution. Gate’s partnership with Alpaca positions it at the forefront of this transformation.
Looking ahead, this model could expand even further. Future developments may include access to bonds, options, mutual funds, commodities, forex, and other global investment instruments. If successfully executed, this would create a truly all-in-one financial platform where users can manage every aspect of their investment portfolio without leaving a single application.
Ultimately, the Gate and Alpaca collaboration represents a foundational shift in how global investing may work in the future. It removes barriers between financial systems, increases accessibility for retail investors, and moves the industry closer to a unified financial infrastructure where crypto and traditional markets operate as one interconnected ecosystem.
@Gate_Square #ShareYourUSStocksWinNvidia #PredictNBAFinalsWin20000U #BitcoinETFSees7272BTCOutflow
repost-content-media
  • Reward
  • Comment
  • Repost
  • Share
#TradeCFDWinGold
CFD stands for Contract for Difference. It is a popular financial instrument that allows traders to speculate on the price movements of various assets without actually owning the underlying asset. When you trade CFDs, you enter into a contract with a broker to exchange the difference in price of an asset from the time the contract is opened to when it is closed. This means you can profit from both rising and falling markets, making CFDs a versatile tool for traders.
CFD trading works on the principle of margin and leverage. Leverage allows you to control a larger position siz
HighAmbition
#TradeCFDWinGold
CFD stands for Contract for Difference. It is a popular financial instrument that allows traders to speculate on the price movements of various assets without actually owning the underlying asset. When you trade CFDs, you enter into a contract with a broker to exchange the difference in price of an asset from the time the contract is opened to when it is closed. This means you can profit from both rising and falling markets, making CFDs a versatile tool for traders.
CFD trading works on the principle of margin and leverage. Leverage allows you to control a larger position size with a relatively small amount of capital. For example, with a leverage of one to twenty, you can control a position worth twenty thousand dollars by depositing just one thousand dollars as margin. This margin is essentially a good faith deposit that secures your position. The margin requirement represents the portion of your capital needed to open and maintain a leveraged position.
One of the primary advantages of CFD trading is flexibility. You can trade various markets including forex pairs, commodities like gold and oil, stock indices, and individual stocks. Gold CFDs are particularly popular among traders because gold serves as both a commodity and a safe haven asset. During times of economic uncertainty and geopolitical tensions, investors flock to gold, often driving its price higher. This makes gold an attractive asset for traders seeking opportunities in volatile markets.
To start trading CFDs, you first need to choose a reliable broker that offers CFD trading services. Once you have an account, you can select the asset you want to trade, decide whether you believe the price will rise or fall, and open a position accordingly. If you expect the price to increase, you open a long position or buy. If you anticipate a price decrease, you open a short position or sell. The profit or loss is determined by the difference between the entry price and the exit price, multiplied by the position size.
Risk management is crucial in CFD trading. Because leverage amplifies both gains and losses, it is essential to use stop loss orders to limit potential losses. A stop loss automatically closes your position when the price reaches a predetermined level, protecting your capital from excessive drawdowns. Similarly, take profit orders can lock in gains when the price reaches your target level. Position sizing is another critical aspect of risk management. Never risk more than a small percentage of your trading capital on a single trade.
Understanding market analysis is fundamental to successful CFD trading. Technical analysis involves studying price charts and using indicators to identify trends and potential entry and exit points. Common technical indicators include moving averages, relative strength index, and support and resistance levels. Fundamental analysis focuses on economic data, news events, and geopolitical developments that can impact asset prices. For gold trading specifically, factors such as interest rates, inflation data, currency movements, and central bank policies play significant roles.
Trading costs in CFD trading typically include spreads, which are the difference between the buy and sell prices, and overnight financing charges if you hold positions beyond the trading day. Some brokers may also charge commissions. It is important to understand these costs as they affect your overall profitability.
Winning Strategies for Gold CFD Trading
Gold trading requires a well defined strategy to achieve consistent profitability. One effective approach is trend following. This strategy involves identifying the direction of the gold price trend and trading in that direction. When gold is in an uptrend, you look for opportunities to buy or go long. When gold is in a downtrend, you look for opportunities to sell or go short. Trend following works because trends tend to persist over time, and riding a trend can generate substantial profits.
Another popular strategy is breakout trading. This involves entering a trade when the price breaks through significant support or resistance levels. Breakouts often signal the beginning of a new trend or the continuation of an existing one with increased momentum. To trade breakouts effectively, you need to identify key levels on the price chart and wait for a confirmed break with strong volume.
Range trading is suitable when gold prices are moving sideways between established support and resistance levels. In this strategy, you buy near support and sell near resistance, profiting from the price oscillations within the range. This approach requires patience and discipline, as you must wait for the price to reach the boundaries of the range before entering trades.
Technical analysis plays a vital role in gold CFD trading. Moving averages help smooth out price data and identify trend direction. The fifty day and two hundred day moving averages are commonly used to determine long term trends. When the shorter term moving average crosses above the longer term moving average, it signals a potential uptrend. When it crosses below, it signals a potential downtrend.
Support and resistance levels are price points where the market has historically reversed or paused. These levels act as barriers that prices struggle to break through. Identifying these levels helps you determine optimal entry and exit points. Round numbers and previous swing highs and lows often serve as significant support and resistance levels.
Risk management separates successful traders from unsuccessful ones. Always use stop loss orders to protect your capital. Determine your stop loss level before entering a trade based on technical levels or a percentage of your account balance. A common rule is to risk no more than one to two percent of your trading capital on any single trade. This ensures that a string of losses will not devastate your account.
Position sizing is equally important. Calculate the appropriate position size based on your stop loss distance and risk percentage. This prevents you from taking excessively large positions that could wipe out your account on a single adverse move. Consistent position sizing helps maintain emotional stability and prevents impulsive decisions.
Understanding market sentiment and economic factors enhances your gold trading decisions. Gold often moves inversely to the US dollar and interest rates. When interest rates are low, gold becomes more attractive as it does not yield interest. During periods of inflation or economic uncertainty, demand for gold as a safe haven increases. Monitoring economic calendars for central bank announcements, inflation reports, and geopolitical events helps you anticipate potential market movements.
Trading psychology is often overlooked but critically important. Fear and greed are the two primary emotions that drive market behavior. Fear can cause you to exit profitable trades too early or hesitate to enter valid setups. Greed can lead to overtrading, ignoring stop losses, or taking excessive risks. Developing emotional discipline through a trading plan and maintaining a trading journal helps you identify and correct psychological weaknesses.
Backtesting your strategies on historical data validates their effectiveness before risking real capital. Keep a detailed trading journal documenting your trades, including entry and exit reasons, position sizes, and emotional state. Regularly reviewing your journal reveals patterns in your trading behavior and areas for improvement.
Patience is essential in gold trading. Not every day presents a high probability trading opportunity. Waiting for the right setup according to your strategy prevents overtrading and preserves capital for better opportunities. Quality trades are more important than quantity.
Continuous learning and adaptation keep you competitive in evolving markets. Stay updated with market news, refine your strategies based on performance, and remain open to new ideas while maintaining the core principles of risk management and discipline. Successful gold CFD trading combines technical skill, psychological control, and consistent execution of a proven strategy.@Gate_Square #PredictWorldCupShare20000U #ShareYourUSStocksWinNvidia #BitcoinRalliesOver5Percent
repost-content-media
  • Reward
  • Comment
  • Repost
  • Share
#PutinVisitsChina
Russian President Vladimir Putin’s state visit to China on May 19–20, 2026, was not a normal diplomatic engagement but a strategically timed geopolitical signal that reflected deeper global realignments already in motion across trade systems, energy markets, and financial power structures. The visit took place during a period of elevated macro uncertainty where global markets were already sensitive to inflation pressures, energy volatility, geopolitical fragmentation, and shifting monetary influence between East and West.
The meeting between Russia and China was widely inter
HighAmbition
#PutinVisitsChina
Russian President Vladimir Putin’s state visit to China on May 19–20, 2026, was not a normal diplomatic engagement but a strategically timed geopolitical signal that reflected deeper global realignments already in motion across trade systems, energy markets, and financial power structures. The visit took place during a period of elevated macro uncertainty where global markets were already sensitive to inflation pressures, energy volatility, geopolitical fragmentation, and shifting monetary influence between East and West.
The meeting between Russia and China was widely interpreted as a reinforcement of a long-term strategic alignment that is gradually reshaping global economic architecture, particularly in areas related to trade settlement systems, energy security, and alternative financial cooperation mechanisms.
2. Strategic Direction: Movement Toward a Multipolar Global Order
A central theme emerging from the summit was the continued strengthening of a multipolar world structure, where global influence is no longer concentrated in a single financial center but distributed across multiple regional power blocs. Both Russia and China emphasized expanded cooperation in trade, infrastructure, energy, and technology, while also highlighting the importance of reducing dependency on traditional Western financial systems.
This shift does not occur abruptly but gradually through repeated agreements, bilateral settlements, and infrastructure alignment, which collectively signal a long-term transition toward diversified global economic influence. Markets interpret this as a structural change rather than a short-term diplomatic event.
3. Economic Cooperation: Deepening Sectoral Integration
During the visit, multiple agreements were discussed across key strategic sectors including energy cooperation, artificial intelligence development, transportation infrastructure, scientific research, defense-related collaboration, and media coordination frameworks.
One of the most significant long-term energy discussions involved pipeline expansion projects such as the Power of Siberia 2 initiative, which, if fully developed, could significantly increase natural gas flow from Russia to China. This reflects a broader shift where Russia increasingly relies on Asian demand while China secures long-term energy supply stability.
These developments indicate not only economic cooperation but also structural reorientation of global trade routes.
4. Energy Markets: Inflation Pressure and Global Pricing Sensitivity
Energy markets responded to the broader geopolitical environment surrounding the summit rather than the event itself. Oil prices remained elevated during this period, with WTI trading near $99–$108 and Brent crude maintaining a higher range around $105–$110+, reflecting persistent supply risk premiums.
Several underlying drivers contributed to this volatility, including geopolitical instability in the Middle East, ongoing disruptions related to the Russia–Ukraine conflict, and structural uncertainty in global supply chains. Higher energy prices continue to play a central role in global inflation dynamics, influencing central bank decisions and risk asset performance across markets.
5. Financial System Shift: Gradual Expansion of Non-Dollar Trade
One of the most structurally important themes reinforced during the summit was the continued expansion of trade settlements outside the U.S. dollar system. Increased use of local currencies such as the Chinese yuan and Russian ruble in bilateral trade reflects a gradual reconfiguration of global settlement networks.
While this transition is not immediate or absolute, the direction is clear: countries are increasingly exploring alternative financial frameworks that reduce reliance on traditional Western banking channels.
From a macro perspective, this trend is significant because it introduces long-term questions about currency dominance, liquidity distribution, and global reserve asset competition.
₿ 6. Bitcoin Market Behavior: Stability Instead of Shock Reaction
Despite strong geopolitical narratives, Bitcoin did not experience a dramatic breakout or collapse during the summit period. Instead, it demonstrated stable and controlled price behavior, trading in a relatively narrow range around $77,000–$78,000 after earlier monthly fluctuations.
This reflects a structural change in Bitcoin market dynamics, where price action is increasingly influenced by institutional flows, macro liquidity conditions, interest rate expectations, and ETF-driven capital movements rather than short-term geopolitical headlines.
Bitcoin’s reaction suggests that it is evolving from a purely sentiment-driven asset into a macro-integrated financial instrument.
7. Institutional vs Retail Interpretation Gap
A clear divergence emerged between retail expectations and institutional positioning. Many retail participants anticipated a strong bullish reaction driven by de-dollarization narratives and geopolitical fragmentation. However, institutional investors remained focused on broader macro indicators such as inflation data, Federal Reserve policy outlook, bond yield behavior, and ETF capital flows.
As a result, the market exhibited strong narrative impact in the long term, while short-term price movement remained relatively muted, highlighting the difference between storytelling-driven expectations and liquidity-driven market behavior.
8. Gold Market Context: Parallel Safe-Haven Dynamics
Gold continued to perform strongly within a broader safe-haven framework, trading in the range of approximately $4,500–$4,700 per ounce during the same period. Its strength was supported by inflation uncertainty, geopolitical risk premiums, and concerns regarding global financial fragmentation.
Interestingly, Bitcoin maintained partial correlation with gold behavior, reinforcing its evolving narrative as a digital counterpart to traditional safe-haven assets, particularly among institutional investors who view it as a hedge against long-term monetary uncertainty.
9. Middle East and Global Risk Expansion
Additional geopolitical pressure from the Middle East contributed to elevated global risk sensitivity. Ongoing tensions created concerns around shipping routes, energy infrastructure security, and potential escalation scenarios that could significantly impact oil supply stability.
Such conditions typically increase inflation expectations while simultaneously reducing investor risk appetite, which affects both traditional and digital asset markets through liquidity tightening and volatility expansion.
10. Russia–Ukraine Conflict: Persistent Macro Influence
The ongoing conflict between Russia and Ukraine continues to act as a structural macro driver affecting energy flows, commodity pricing, and global risk sentiment. Continuous disruptions in infrastructure and supply chains maintain elevated uncertainty levels across global markets.
This sustained instability contributes to persistent inflation concerns and reinforces demand for assets perceived as neutral or decentralized in nature.
11. Crypto Market Structure: Altcoin Stability with Select Strength
While Bitcoin remained relatively stable, major altcoins also reflected macro-driven behavior without extreme volatility. Ethereum traded in the $4,100–$4,300 range, while Solana remained in the mid-$80 zone, showing consolidation rather than breakdown.
The broader crypto market was influenced by AI-related narratives, infrastructure development trends, and increasing institutional participation, which helped maintain structural support across major assets.
12. Key Bitcoin Structural Levels
Market participants closely monitored important psychological and technical levels including $75,000 as a major support zone, $80,000 as a resistance boundary, and $85,000 as a breakout confirmation level, while long-term expectations remained focused on higher macro targets depending on liquidity expansion cycles.
13. Overall Market Interpretation: Structural Change Over Immediate Reaction
The most important conclusion from the summit is that its impact was not reflected in immediate explosive price movements but rather in long-term reinforcement of existing global trends. These include increasing geopolitical fragmentation, gradual expansion of multipolar financial systems, continued discussion around de-dollarization, and strengthening narratives around Bitcoin as a neutral digital asset.
The key takeaway is that modern financial markets no longer react solely to geopolitical events in isolation; instead, they integrate such events into broader macro frameworks where liquidity, institutional positioning, and monetary policy carry significantly more weight in short-term pricing behavior.
The Putin visit china summit represents a significant geopolitical signal that reinforces long-term structural transitions in global trade, energy systems, and financial alignment between major world powers. While immediate market reactions remained controlled, the broader implications strengthen ongoing macro narratives involving de-dollarization, energy-driven inflation cycles, and the evolving role of Bitcoin as a globally neutral asset within a fragmented financial system.
This event does not create a short-term market shock, but it adds another layer to an already shifting global order where economic influence is becoming increasingly distributed and interconnected across multiple power centers.
repost-content-media
  • Reward
  • Comment
  • Repost
  • Share
#PYTHUnlocks2.13BillionTokens
PYTH Network (PYTH) 2.13 Billion Token Unlock — The Biggest Oracle Supply Shock of 2026
A Critical Moment for PYTH and the Entire Altcoin Market
The crypto market is now entering one of the most sensitive supply events of 2026 as PYTH Network prepares to unlock approximately 2.13 billion PYTH tokens between May 19–21. Across the entire digital asset industry, this unlock is being viewed as a major stress test not only for PYTH itself but also for overall market liquidity, investor confidence, and the ability of utility-focused projects to survive massive inflatio
HighAmbition
#PYTHUnlocks2.13BillionTokens
PYTH Network (PYTH) 2.13 Billion Token Unlock — The Biggest Oracle Supply Shock of 2026
A Critical Moment for PYTH and the Entire Altcoin Market
The crypto market is now entering one of the most sensitive supply events of 2026 as PYTH Network prepares to unlock approximately 2.13 billion PYTH tokens between May 19–21. Across the entire digital asset industry, this unlock is being viewed as a major stress test not only for PYTH itself but also for overall market liquidity, investor confidence, and the ability of utility-focused projects to survive massive inflationary phases without losing long-term momentum.
At current market prices fluctuating around $0.038–$0.044, the unlock carries an estimated valuation between $81 million and $94 million. However, beyond the dollar amount, what truly matters is the psychological effect this event is creating inside the market. Traders understand that sudden supply expansion can rapidly weaken price action if demand fails to absorb new circulation fast enough.
This is why PYTH has become one of the most heavily discussed tokens across crypto communities during May 2026.
Unlike smaller unlocks that markets often ignore, this event is large enough to influence sentiment across DeFi infrastructure, oracle projects, Layer-2 ecosystems, and even broader altcoin liquidity conditions. The market is now entering a phase where every major transaction, exchange inflow, whale wallet movement, and staking shift is being monitored aggressively.
Why The 2.13 Billion Unlock Matters So Much
The unlock itself represents nearly 37% of PYTH’s pre-event circulating supply and approximately 21.3% of the total 10 billion token supply. Before the unlock, circulating supply remained near 5.75 billion PYTH, but after the event circulation could expand toward the 7.87–7.9 billion range.
That is an enormous increase within a very short time period.
In crypto markets, price is heavily influenced by the balance between supply and demand. When circulating supply expands aggressively while liquidity conditions remain weak, markets usually struggle to maintain stability. Even if long-term fundamentals remain strong, short-term volatility can still become extremely violent.
Another major factor is trader psychology. In crypto, fear often arrives before actual selling. Many traders begin reducing exposure days or even weeks before major unlocks because they expect others to sell first. This creates pre-event weakness that can sometimes become stronger than the unlock itself.
That behavior is already visible in PYTH’s recent price structure.
Allocation Breakdown — Where The Tokens Are Going
The unlocked PYTH supply is distributed across several categories:
~1.13 Billion PYTH → Ecosystem Growth This allocation supports partnerships, developer expansion, liquidity programs, protocol adoption, grants, and long-term ecosystem growth initiatives.
~537.5 Million PYTH → Publisher Rewards These rewards compensate the oracle publishers and data providers responsible for delivering real-time market information into the PYTH infrastructure.
Remaining Allocation → Team, Contributors, Early Investors & Protocol Operations This section includes operational funding, contributor incentives, strategic holders, private-sale participants, and long-term ecosystem expansion programs.
However, one extremely important detail is often ignored by panic-driven traders:
Not all 2.13 billion tokens instantly become active sell pressure.
A meaningful portion may remain locked inside ecosystem initiatives, staking structures, treasury management systems, governance allocations, or long-term strategic holdings. Because of this, many analysts estimate the real immediate liquid supply entering exchanges could initially remain closer to 8–10% rather than the full 37% headline figure dominating social media.
Still, under fragile market conditions even partial sell pressure can create heavy volatility.
PYTH Is Facing a Liquidity War
This unlock is not simply about “tokens entering circulation.” It is actually a battle between liquidity and confidence.
If demand remains strong enough to absorb new supply, PYTH could stabilize and eventually recover. But if exchange inflows rise aggressively while buy-side liquidity weakens, the market may experience a prolonged downside cycle similar to previous unlock periods.
This is exactly why analysts are calling the event one of the largest “supply absorption tests” of 2026.
Large holders and institutional participants are now expected to play a decisive role. If whales begin aggressively depositing tokens onto exchanges, retail fear could accelerate quickly. On the other hand, if staking participation increases and ecosystem wallets retain holdings instead of selling, the market could absorb pressure far more efficiently than expected.
The next few weeks may determine whether PYTH enters a deeper bearish phase or transforms this period into a major accumulation zone.
Historical Performance & Why Traders Are Nervous
The market’s fear is not random.
Previous PYTH unlock cycles during May 2024 and May 2025 were followed by extended bearish periods where the token suffered drawdowns between approximately 65–72% over subsequent months.
That historical weakness is one of the main reasons traders remain extremely cautious now.
Crypto markets usually move through three stages during large unlock cycles:
Phase One → Pre-Unlock Fear Selling Traders reduce exposure ahead of uncertainty.
Phase Two → Unlock Volatility Large wallet movements and liquidation activity create sharp price swings.
Phase Three → Supply Absorption Markets eventually stabilize once buyers absorb circulating supply.
Right now, PYTH is transitioning between the fear stage and the volatility stage.
Technical Analysis & Important Price Levels
From a technical perspective, PYTH continues trading inside a weak bearish structure around the $0.038–$0.044 range.
Immediate Resistance Levels: $0.044 – $0.045 $0.050 – $0.054
Major Resistance Zones: $0.057 $0.061 $0.065
These areas remain critical because sellers repeatedly regained control near these levels during previous recovery attempts. If PYTH cannot reclaim higher resistance regions, bearish momentum could continue dominating the market for several more weeks.
Key Support Zones: $0.038 – $0.039 $0.035 – $0.036
Critical Breakdown Levels: $0.030 $0.025 $0.020
The $0.038 region has now become one of the most important psychological zones for the entire market structure. A breakdown below $0.035 could trigger aggressive liquidations, stop-loss cascades, and stronger panic across derivatives markets.
Some bearish long-range projections even discuss the possibility of PYTH revisiting the $0.020 region if macro crypto conditions deteriorate further and demand fails to recover.
However, bullish recovery scenarios still remain possible.
If the market absorbs supply efficiently and PYTH reclaims the $0.060–$0.065 region with strong volume support, momentum could shift significantly. Under stronger recovery conditions, traders may begin targeting $0.075, $0.085, and eventually the psychological $0.10 barrier once again.
PYTH’s Real Strength — Why Long-Term Investors Still Believe
Despite heavy unlock fears, PYTH remains one of the most important oracle infrastructures in the crypto ecosystem.
The network powers real-time price feeds across Solana, Sui, Aptos, Ethereum Layer-2 ecosystems, and multiple DeFi applications including lending markets, perpetual exchanges, derivatives platforms, and liquidity systems.
Without reliable oracle infrastructure, decentralized finance cannot function efficiently.
This is the strongest bullish argument supporting PYTH long term.
Unlike speculative meme-driven assets, PYTH provides infrastructure utility that many DeFi systems genuinely depend on. This creates long-term relevance even during periods of severe short-term volatility.
Bullish Arguments Supporting PYTH: Growing oracle demand across DeFi ecosystems. Increasing adoption on Layer-2 networks. Higher staking participation may reduce active circulating supply. Institutional accumulation during panic phases could stabilize valuation. A relief rally may emerge if exchange inflows remain smaller than expected. Long-term ecosystem growth could eventually absorb inflation pressure.
Some investors now believe the unlock could eventually create a major accumulation opportunity if panic becomes excessive.
Major Risks The Market Is Watching Closely
Several important risks still remain:
Large exchange inflows from unlock recipients. Weak altcoin liquidity across the broader market. Heavy derivatives leverage increasing liquidation risks. Simultaneous unlocks involving ZRO and KAITO fragmenting liquidity. Continued bearish sentiment suppressing recovery attempts. Whale-driven volatility causing panic among retail traders.
Another critical factor is Bitcoin dominance. If capital continues rotating toward Bitcoin while altcoins weaken, PYTH and similar infrastructure assets may struggle to recover quickly even if fundamentals remain strong.
Market Sentiment & Trading Strategies
Short-term traders are focusing primarily on volatility opportunities near resistance zones between $0.050 and $0.057 while targeting downside regions near $0.042, $0.038, and $0.035.
Bearish traders are searching for rejection confirmations while bullish participants are waiting for signs that supply absorption is stabilizing.
Long-term investors are approaching the situation more carefully. Many are waiting for post-unlock stabilization before opening larger accumulation positions. Their focus remains on staking growth, ecosystem adoption, on-chain activity, and whether demand can successfully absorb circulating expansion over time.
Institutional participants are expected to remain extremely active during this phase. Large funds often hedge unlock risks through derivatives while simultaneously preparing strategic accumulation during panic-driven weakness.
Final Outlook — A Defining Moment for PYTH
The PYTH 2.13 billion token unlock is not just another token release event. It is one of the biggest liquidity, confidence, and tokenomics tests facing the crypto market in 2026.
If demand successfully absorbs the new supply, PYTH could eventually transform this period into a powerful long-term accumulation zone. But if exchange inflows accelerate while liquidity remains weak, downside pressure could continue dominating price action for months.
The coming weeks will therefore become extremely important for determining PYTH’s future direction.
Traders and investors will closely monitor whale activity, staking participation, exchange reserves, derivatives positioning, ecosystem growth, trading volume, and broader crypto market momentum as the market attempts to absorb one of the largest oracle-sector unlock events in recent years.
repost-content-media
  • Reward
  • Comment
  • Repost
  • Share
  • Pinned