Trade
Trading Type
Spot
Trade crypto freely
Pre-Market
Trade new tokens before they are officially listed
Margin
Magnify your profit with leverage
Convert & Block Trading
0 Fees
Trade any size with no fees and no slippage
Alpha
Points
Get promising tokens in streamlined on-chain trading
Leveraged Tokens
Get exposure to leveraged positions simply
Futures
Futures
Hundreds of contracts settled in USDT or BTC
Options
HOT
Trade European-style vanilla options
Unified Account
Maximize your capital efficiency
Demo Trading
Futures Kickoff
Get prepared for your futures trading
Futures Events
Participate in events to win generous rewards
Demo Trading
Use virtual funds to experience risk-free trading
Earn
Launch
CandyDrop
Collect candies to earn airdrops
Launchpool
Quick staking, earn potential new tokens
HODLer Airdrop
Hold GT and get massive airdrops for free
Launchpad
Be early to the next big token project
Alpha Points
NEW
Trade on-chain assets and enjoy airdrop rewards!
Futures Points
NEW
Earn futures points and claim airdrop rewards
Investment
Simple Earn
Earn interests with idle tokens
Auto-Invest
Auto-invest on a regular basis
Dual Investment
Buy low and sell high to take profits from price fluctuations
Soft Staking
Earn rewards with flexible staking
Crypto Loan
0 Fees
Pledge one crypto to borrow another
Lending Center
One-stop lending hub
VIP Wealth Hub
Customized wealth management empowers your assets growth
Private Wealth Management
Customized asset management to grow your digital assets
Quant Fund
Top asset management team helps you profit without hassle
Staking
Stake cryptos to earn in PoS products
BTC Staking
HOT
Stake BTC and earn 10% APR
GUSD Minting
Use USDT/USDC to mint GUSD for treasury-level yields
More
ASTROLABE
No content yet
ASTROLABE
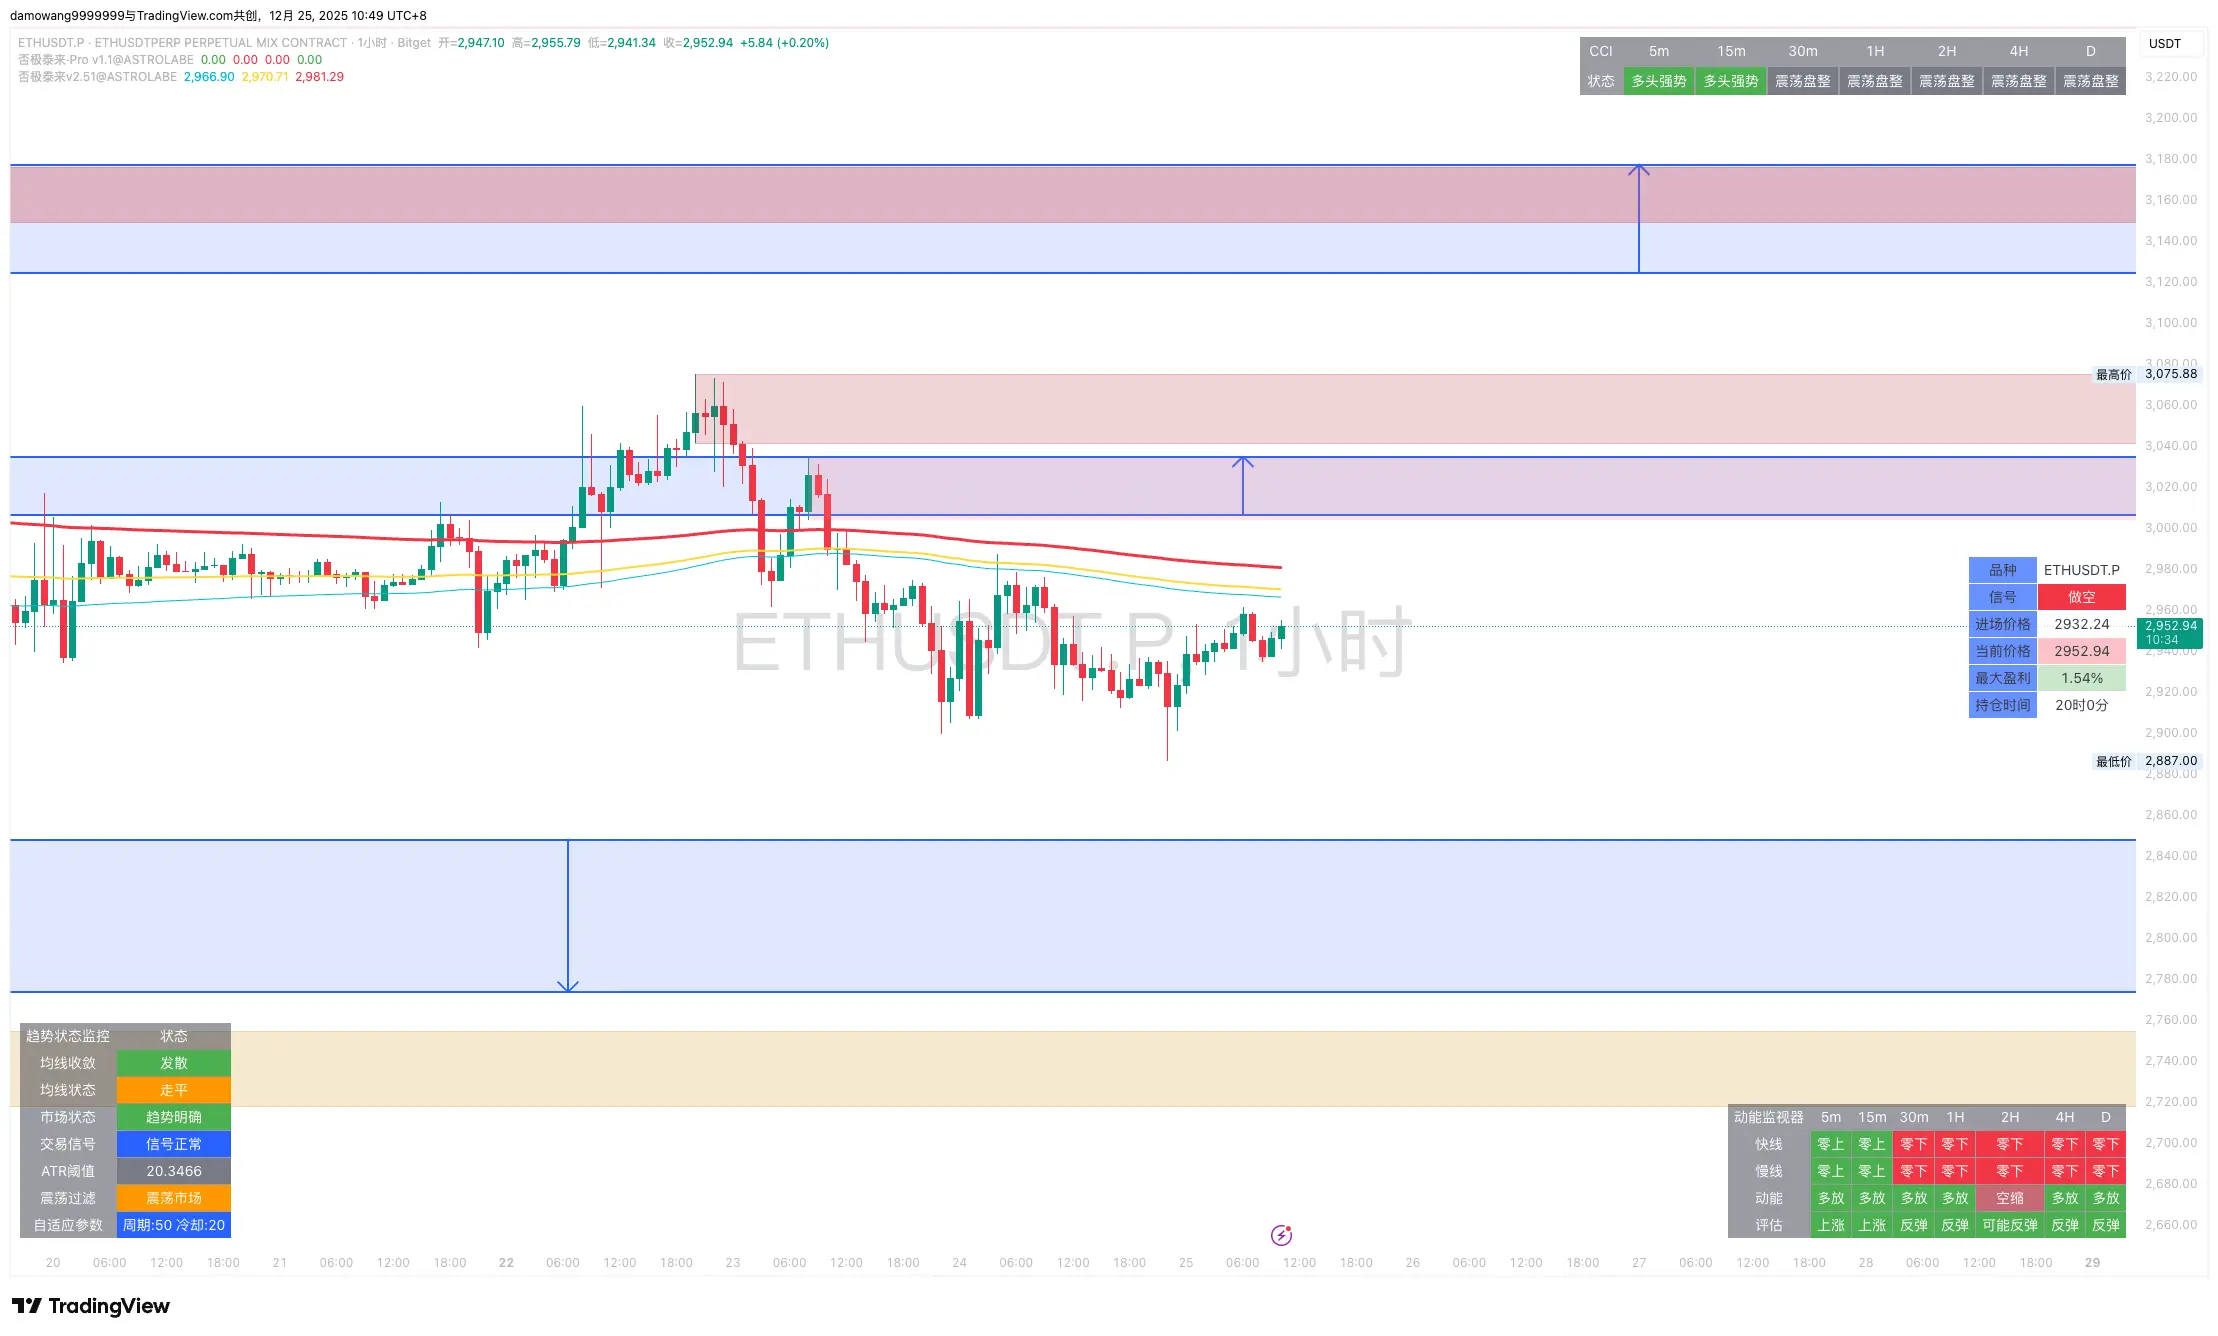
#ETH Intraday Analysis
1️⃣ Structure Interpretation
As BTC remains volatile, ETH's rebound strength and sustainability are clearly lacking, and the overall structure still remains in a weak zone. The current trend is more like passive following + internal weakness, without forming any reliable reversal pattern. When the price approaches key upper areas, it quickly encounters selling pressure, limiting the rebound height.
2️⃣ Capital Flow & On-Chain & Exchange Dynamics
Lack of risk appetite: In an environment of declining risk preference, capital allocation to ETH is noticeably low, with risk
View Original1️⃣ Structure Interpretation
As BTC remains volatile, ETH's rebound strength and sustainability are clearly lacking, and the overall structure still remains in a weak zone. The current trend is more like passive following + internal weakness, without forming any reliable reversal pattern. When the price approaches key upper areas, it quickly encounters selling pressure, limiting the rebound height.
2️⃣ Capital Flow & On-Chain & Exchange Dynamics
Lack of risk appetite: In an environment of declining risk preference, capital allocation to ETH is noticeably low, with risk
- Reward
- 1
- Comment
- Repost
- Share
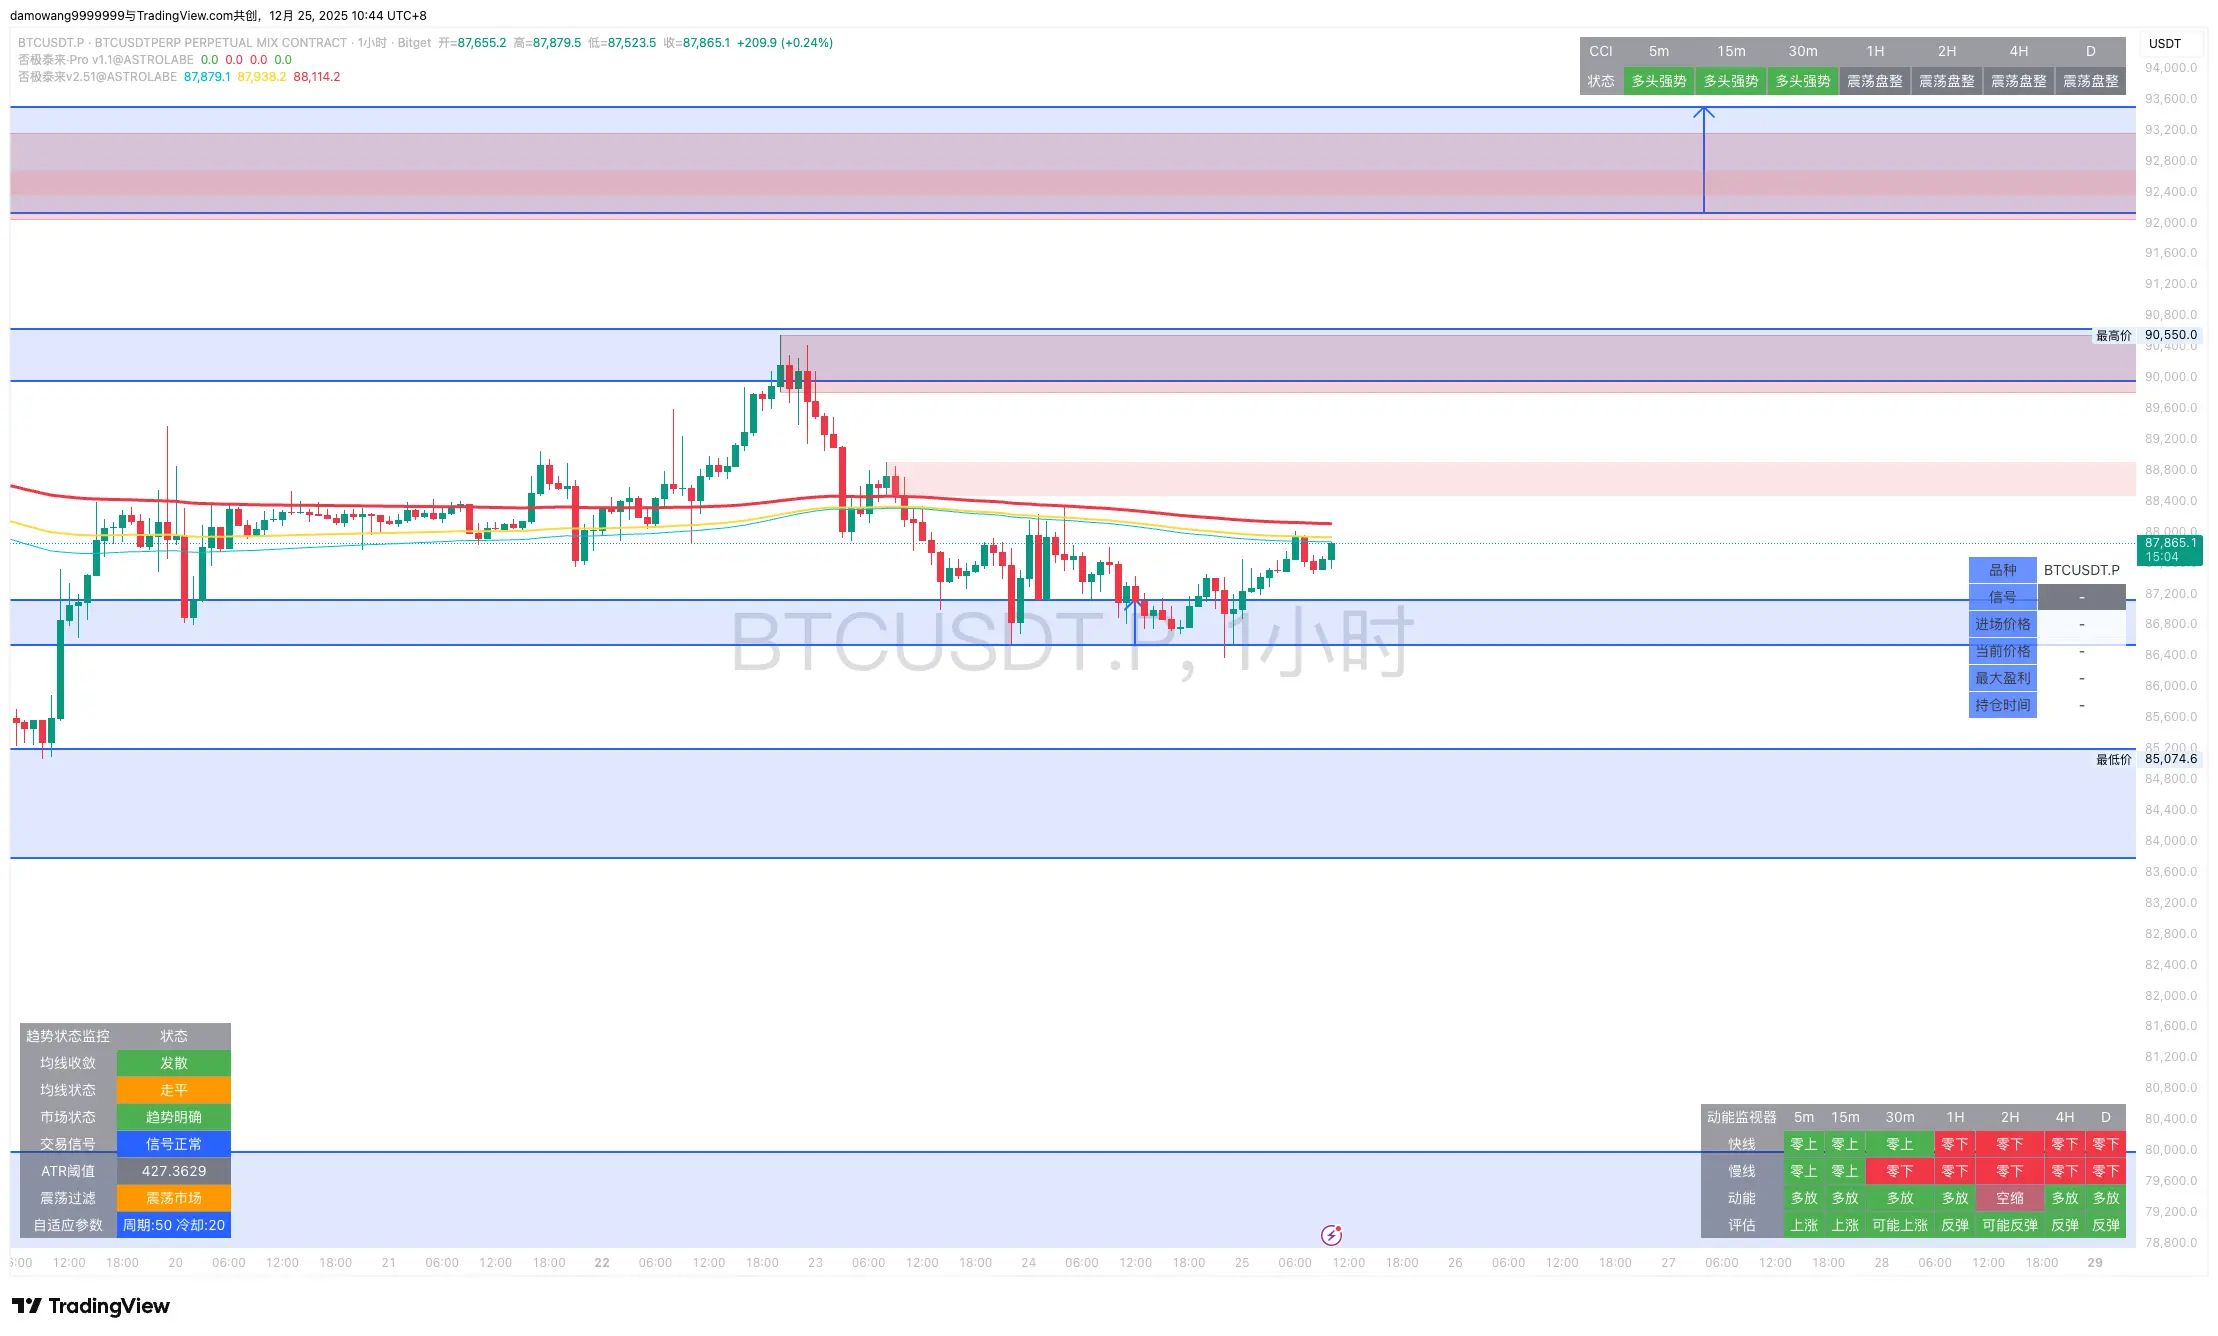
#BTC Intraday Analysis
1️⃣ Structure Interpretation
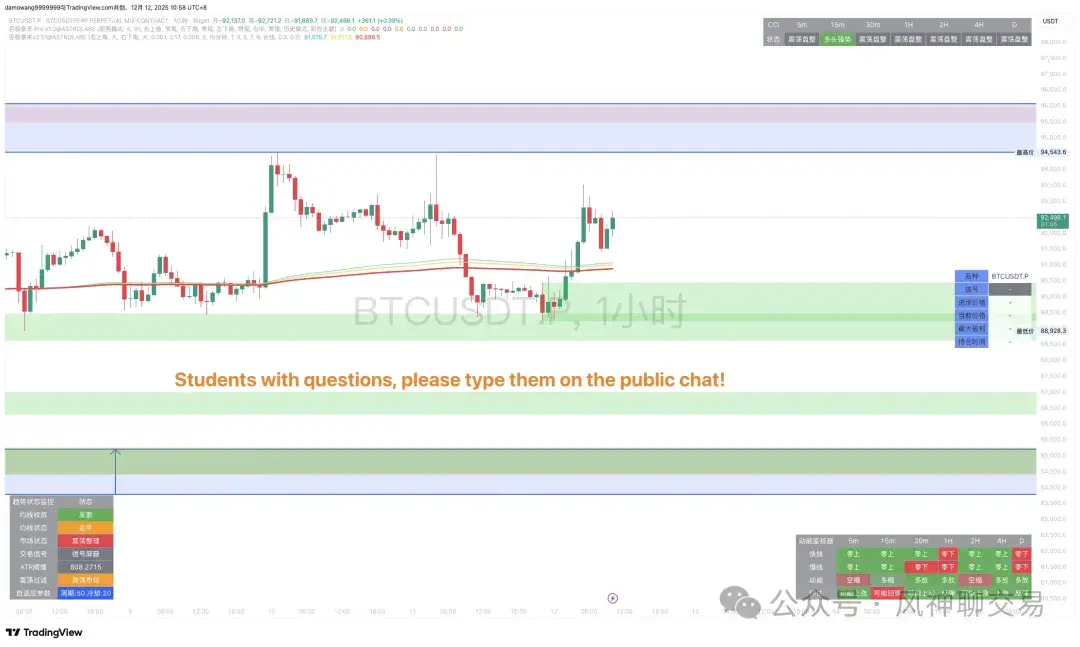
Bitcoin continues to operate within a high-level, slightly weak oscillation structure today. From the current performance, the price repeatedly encounters resistance at the key upper pressure zone, with rebound heights being clearly suppressed, while there is no panic selling at the lower end. This results in a state of indecision and ongoing consumption. The current trend is not a rapid decline driven by leverage, but rather a typical characteristic of spot selling with insufficient buying support and persistent outflows. The greatest risk
1️⃣ Structure Interpretation
Bitcoin continues to operate within a high-level, slightly weak oscillation structure today. From the current performance, the price repeatedly encounters resistance at the key upper pressure zone, with rebound heights being clearly suppressed, while there is no panic selling at the lower end. This results in a state of indecision and ongoing consumption. The current trend is not a rapid decline driven by leverage, but rather a typical characteristic of spot selling with insufficient buying support and persistent outflows. The greatest risk
BTC-0.21%
- Reward
- 1
- Comment
- Repost
- Share
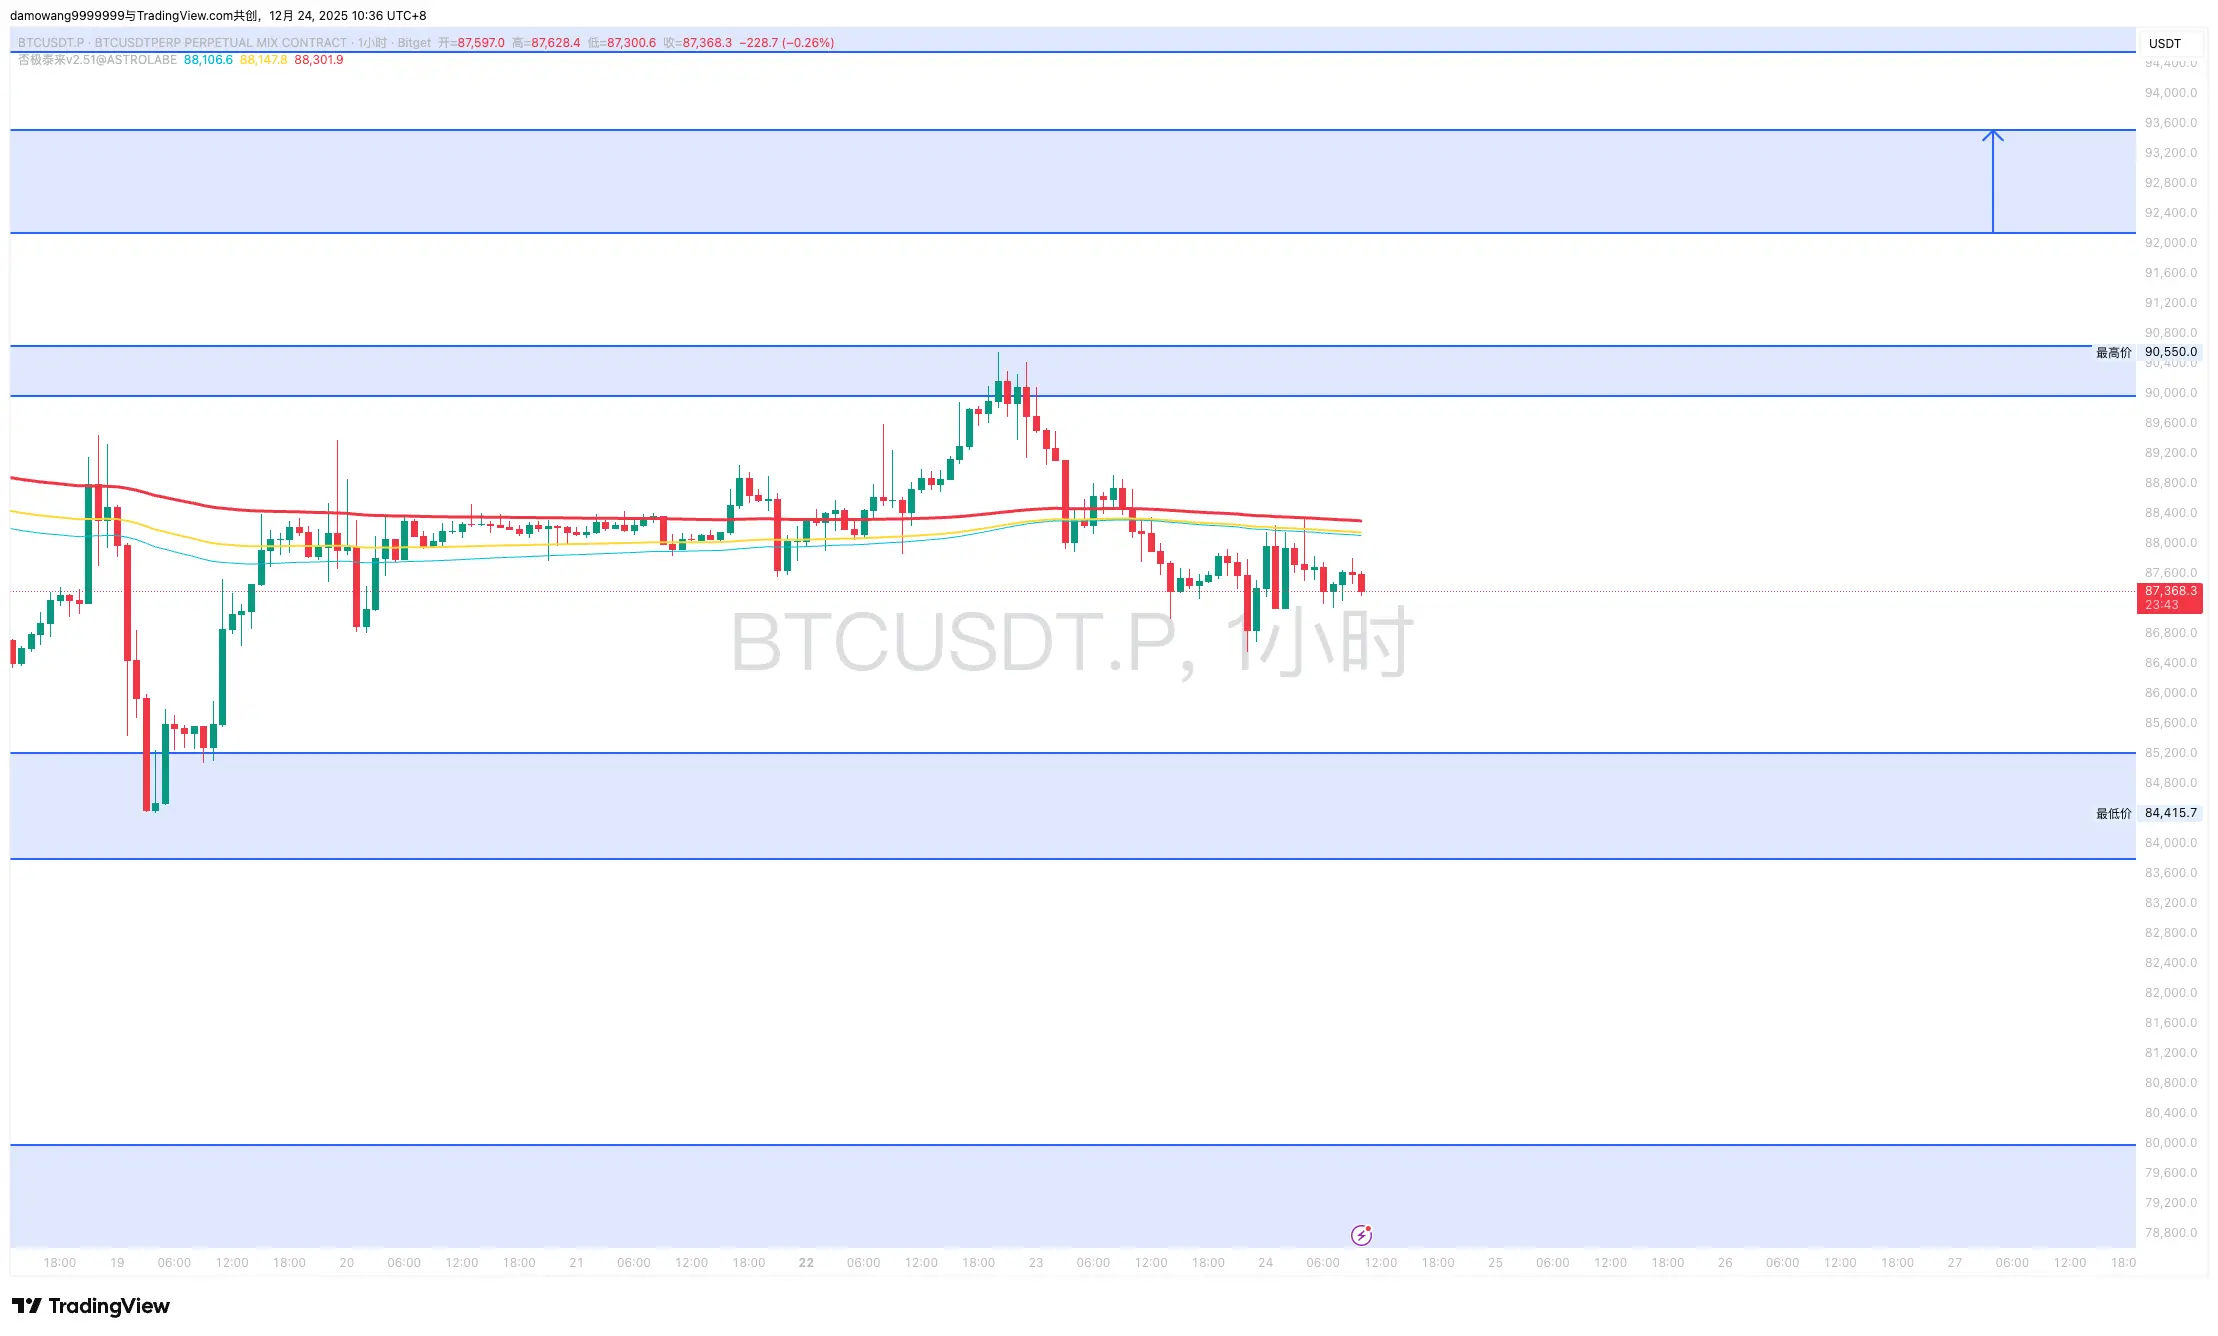
#BTC Intraday Analysis
1️⃣ Structure Interpretation:
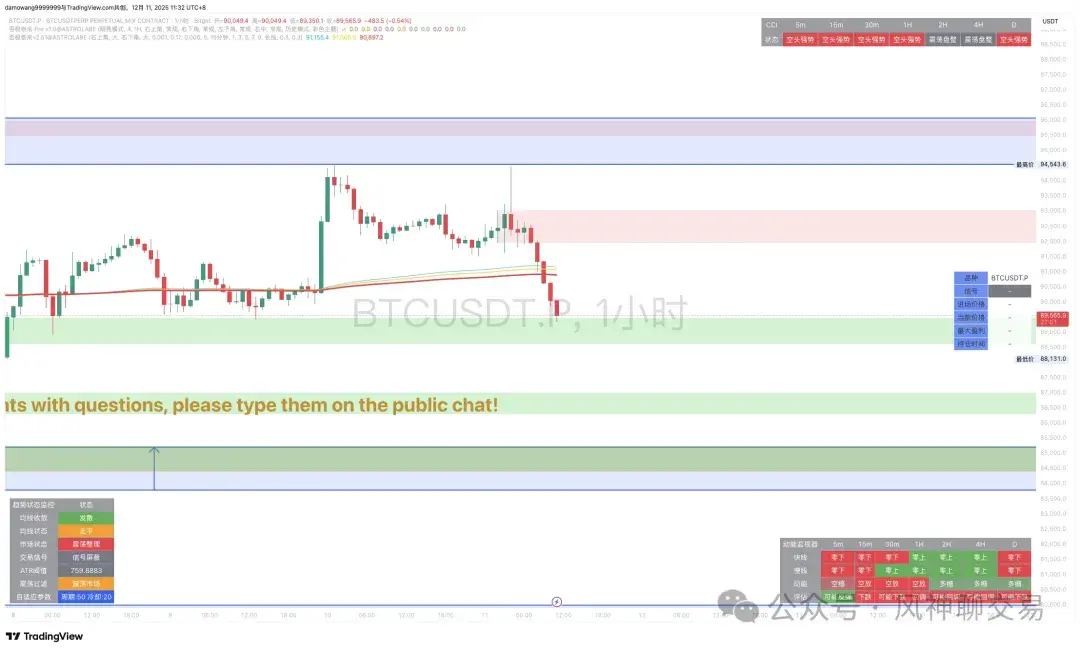
Bitcoin remains in a weak oscillating structure today. Looking at recent price movements, the price repeatedly attempts to recover upwards, but each rebound appears relatively weak and lacks sustainability. The overall rhythm is still characterized by mild declines and inability to rally, typical of a high-level oscillation depletion phase. The current correction is not driven by emotional panic selling but results from continuous spot selling combined with insufficient buying support. The main feature of this trend is:
The market will not
1️⃣ Structure Interpretation:
Bitcoin remains in a weak oscillating structure today. Looking at recent price movements, the price repeatedly attempts to recover upwards, but each rebound appears relatively weak and lacks sustainability. The overall rhythm is still characterized by mild declines and inability to rally, typical of a high-level oscillation depletion phase. The current correction is not driven by emotional panic selling but results from continuous spot selling combined with insufficient buying support. The main feature of this trend is:
The market will not
BTC-0.21%
- Reward
- 1
- Comment
- Repost
- Share
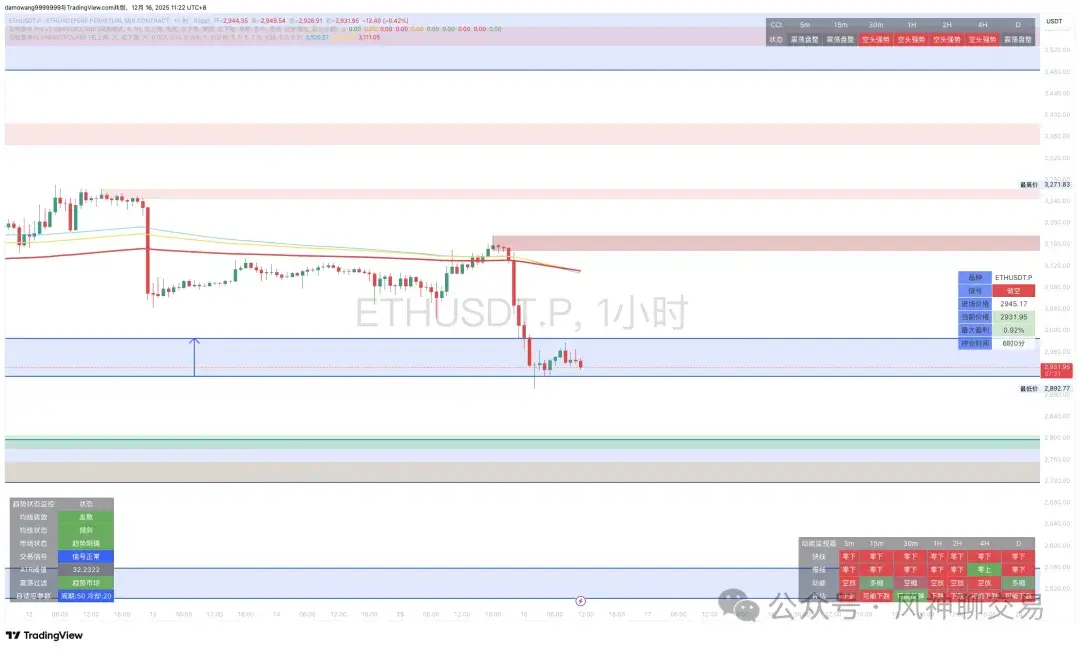
#ETH Intraday Analysis
1️⃣ Structure Analysis:
During the overall market attempt to stabilize, ETH's rebound magnitude and sustainability are relatively weak, and the structure still does not show signs of an independent trend. The current movement resembles a passive consolidation within a weak zone rather than a reversal after a decline. Once the price approaches the key resistance area above, selling pressure quickly emerges, limiting the rebound height.
2️⃣ Capital Flow & On-Chain & Exchange Dynamics
Insufficient capital preference:
In the phase of declining risk appetite, the willingne
View Original1️⃣ Structure Analysis:
During the overall market attempt to stabilize, ETH's rebound magnitude and sustainability are relatively weak, and the structure still does not show signs of an independent trend. The current movement resembles a passive consolidation within a weak zone rather than a reversal after a decline. Once the price approaches the key resistance area above, selling pressure quickly emerges, limiting the rebound height.
2️⃣ Capital Flow & On-Chain & Exchange Dynamics
Insufficient capital preference:
In the phase of declining risk appetite, the willingne
- Reward
- 1
- Comment
- Repost
- Share
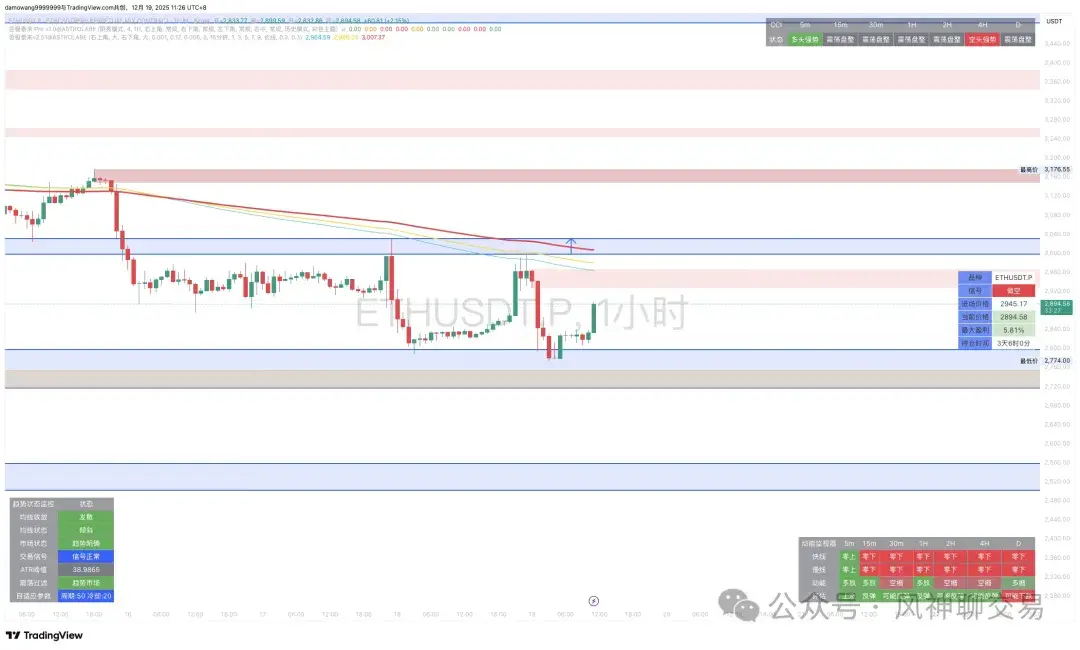
#ETH Structure Interpretation
1️⃣ Ethereum's current trend shows a certain correlation with Bitcoin, but the relative strength of ETH is more subdued. ETH is fluctuating around 2950 without forming a breakthrough momentum, continuing to consolidate back and forth within a relatively narrow price range. According to today's ETH/BTC ratio data, the relative ratio of ETH to BTC has not significantly strengthened, indicating that ETH has not yet become a structurally strong asset in the overall market.
Overall, the short-term structure of ETH still leans towards oscillating in relation to
View Original1️⃣ Ethereum's current trend shows a certain correlation with Bitcoin, but the relative strength of ETH is more subdued. ETH is fluctuating around 2950 without forming a breakthrough momentum, continuing to consolidate back and forth within a relatively narrow price range. According to today's ETH/BTC ratio data, the relative ratio of ETH to BTC has not significantly strengthened, indicating that ETH has not yet become a structurally strong asset in the overall market.
Overall, the short-term structure of ETH still leans towards oscillating in relation to
- Reward
- 1
- Comment
- Repost
- Share
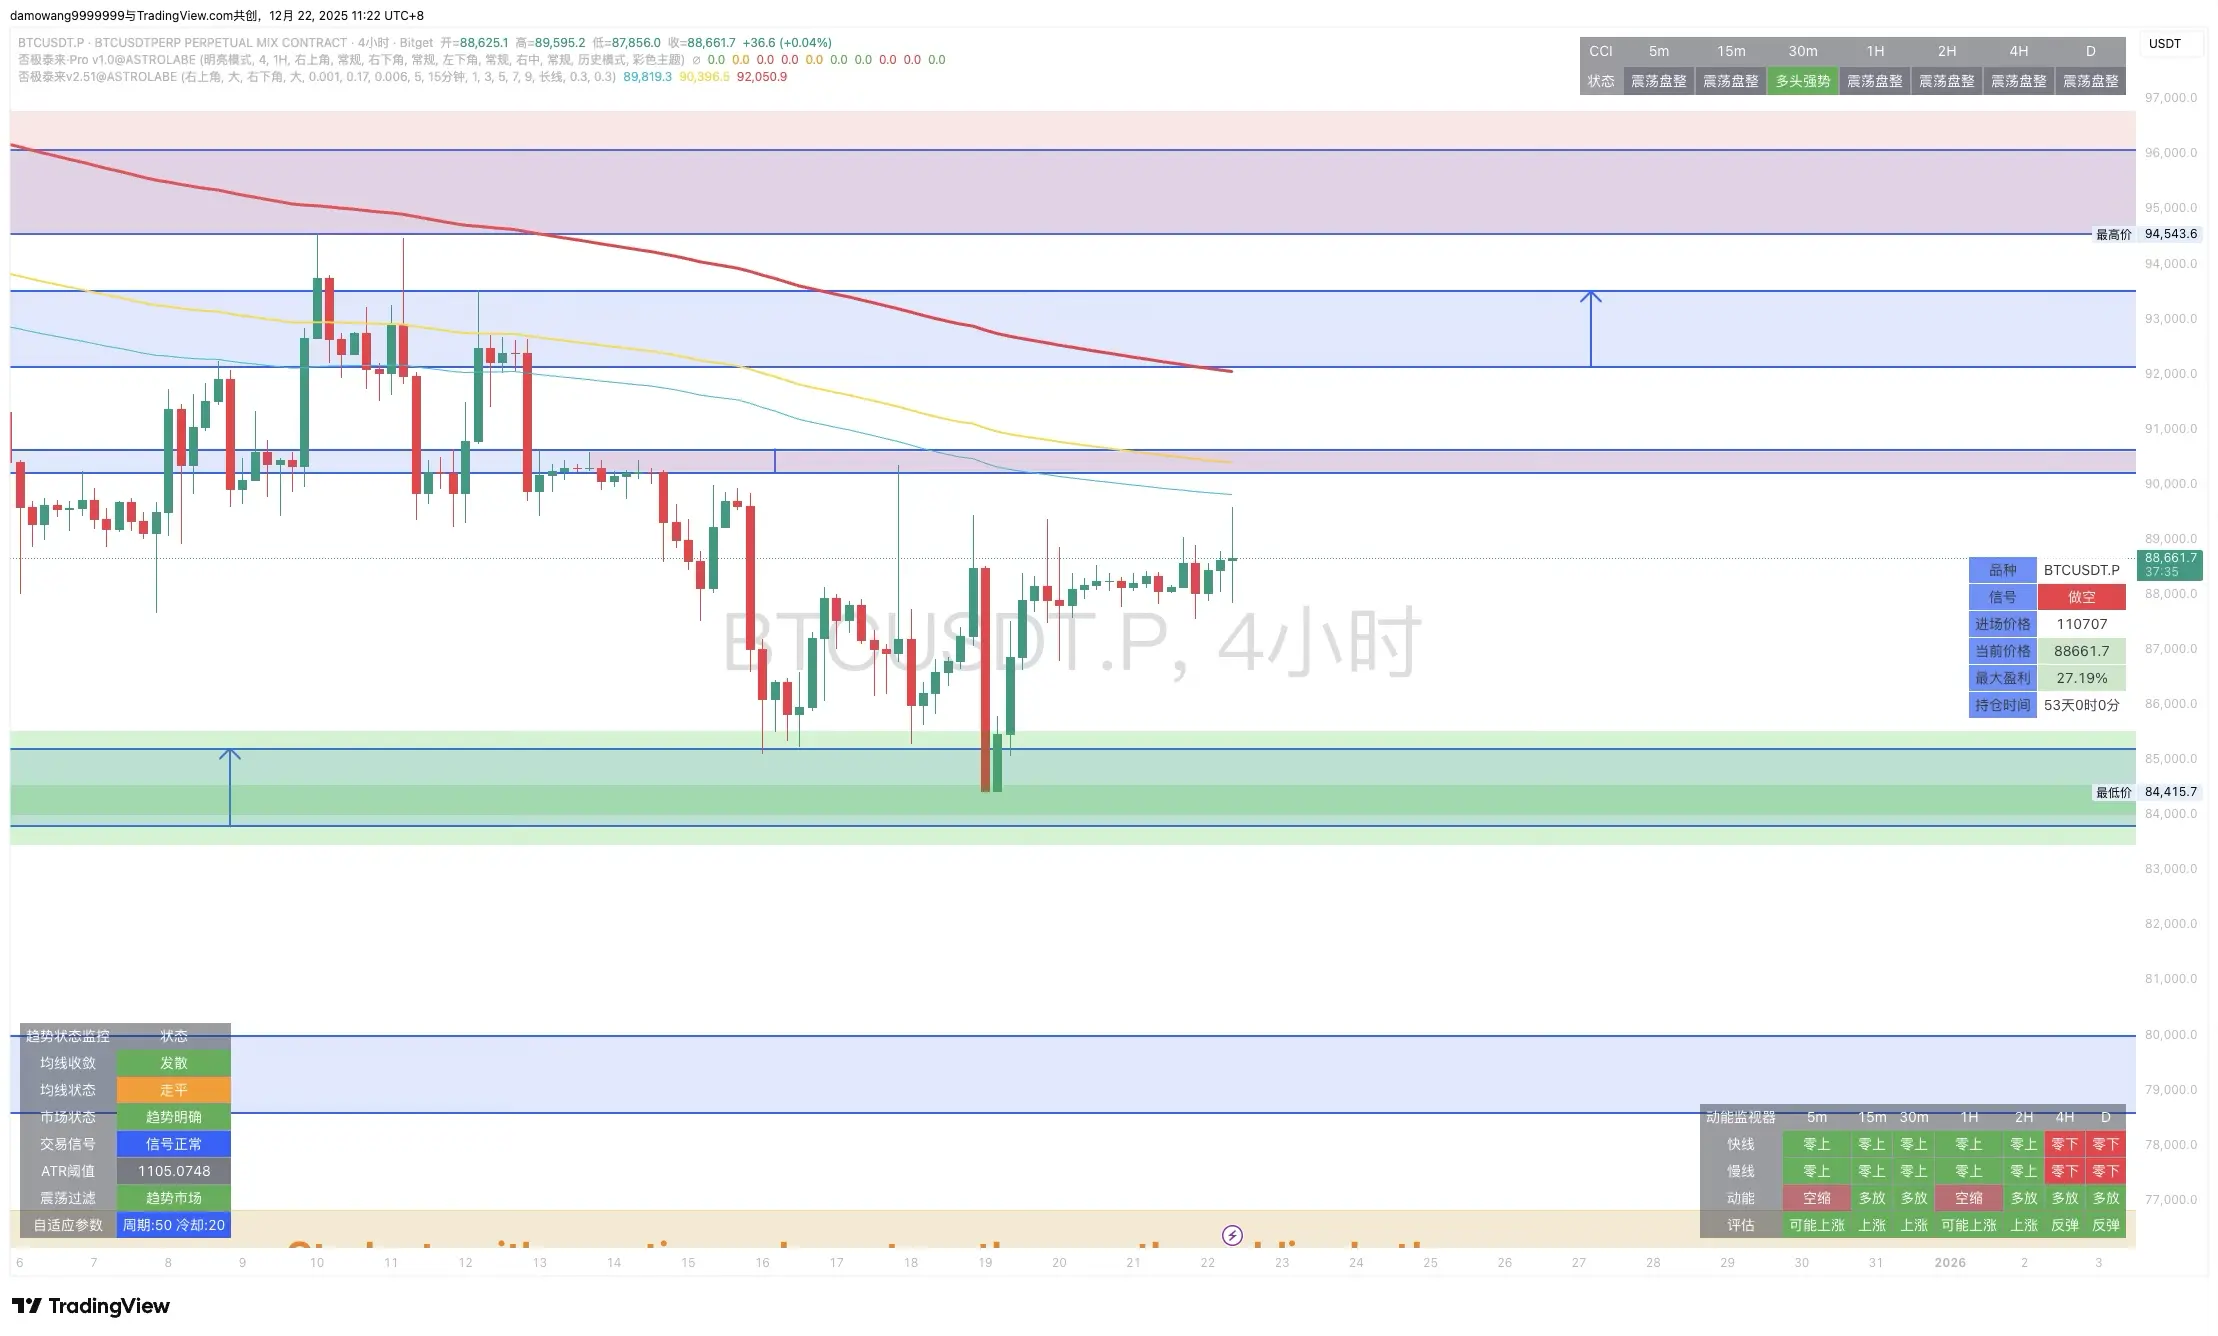
#BTC structure interpretation
1️⃣Bitcoin has recently been fluctuating narrowly around 88000, with the current short-term trend showing repeated attempts to test the resistance above but not forming a sustained breakthrough. According to the latest market quotes, BTC remains hovering around 88000 over the weekend, with a small fluctuation range in the past 24 hours, characteristic of a consolidation phase.
Based on the recent trend, the price has been fluctuating between 84000 and 89000, unable to firmly break above the resistance level, indicating that bullish momentum has not significantly
BTC-0.21%
- Reward
- 1
- Comment
- Repost
- Share
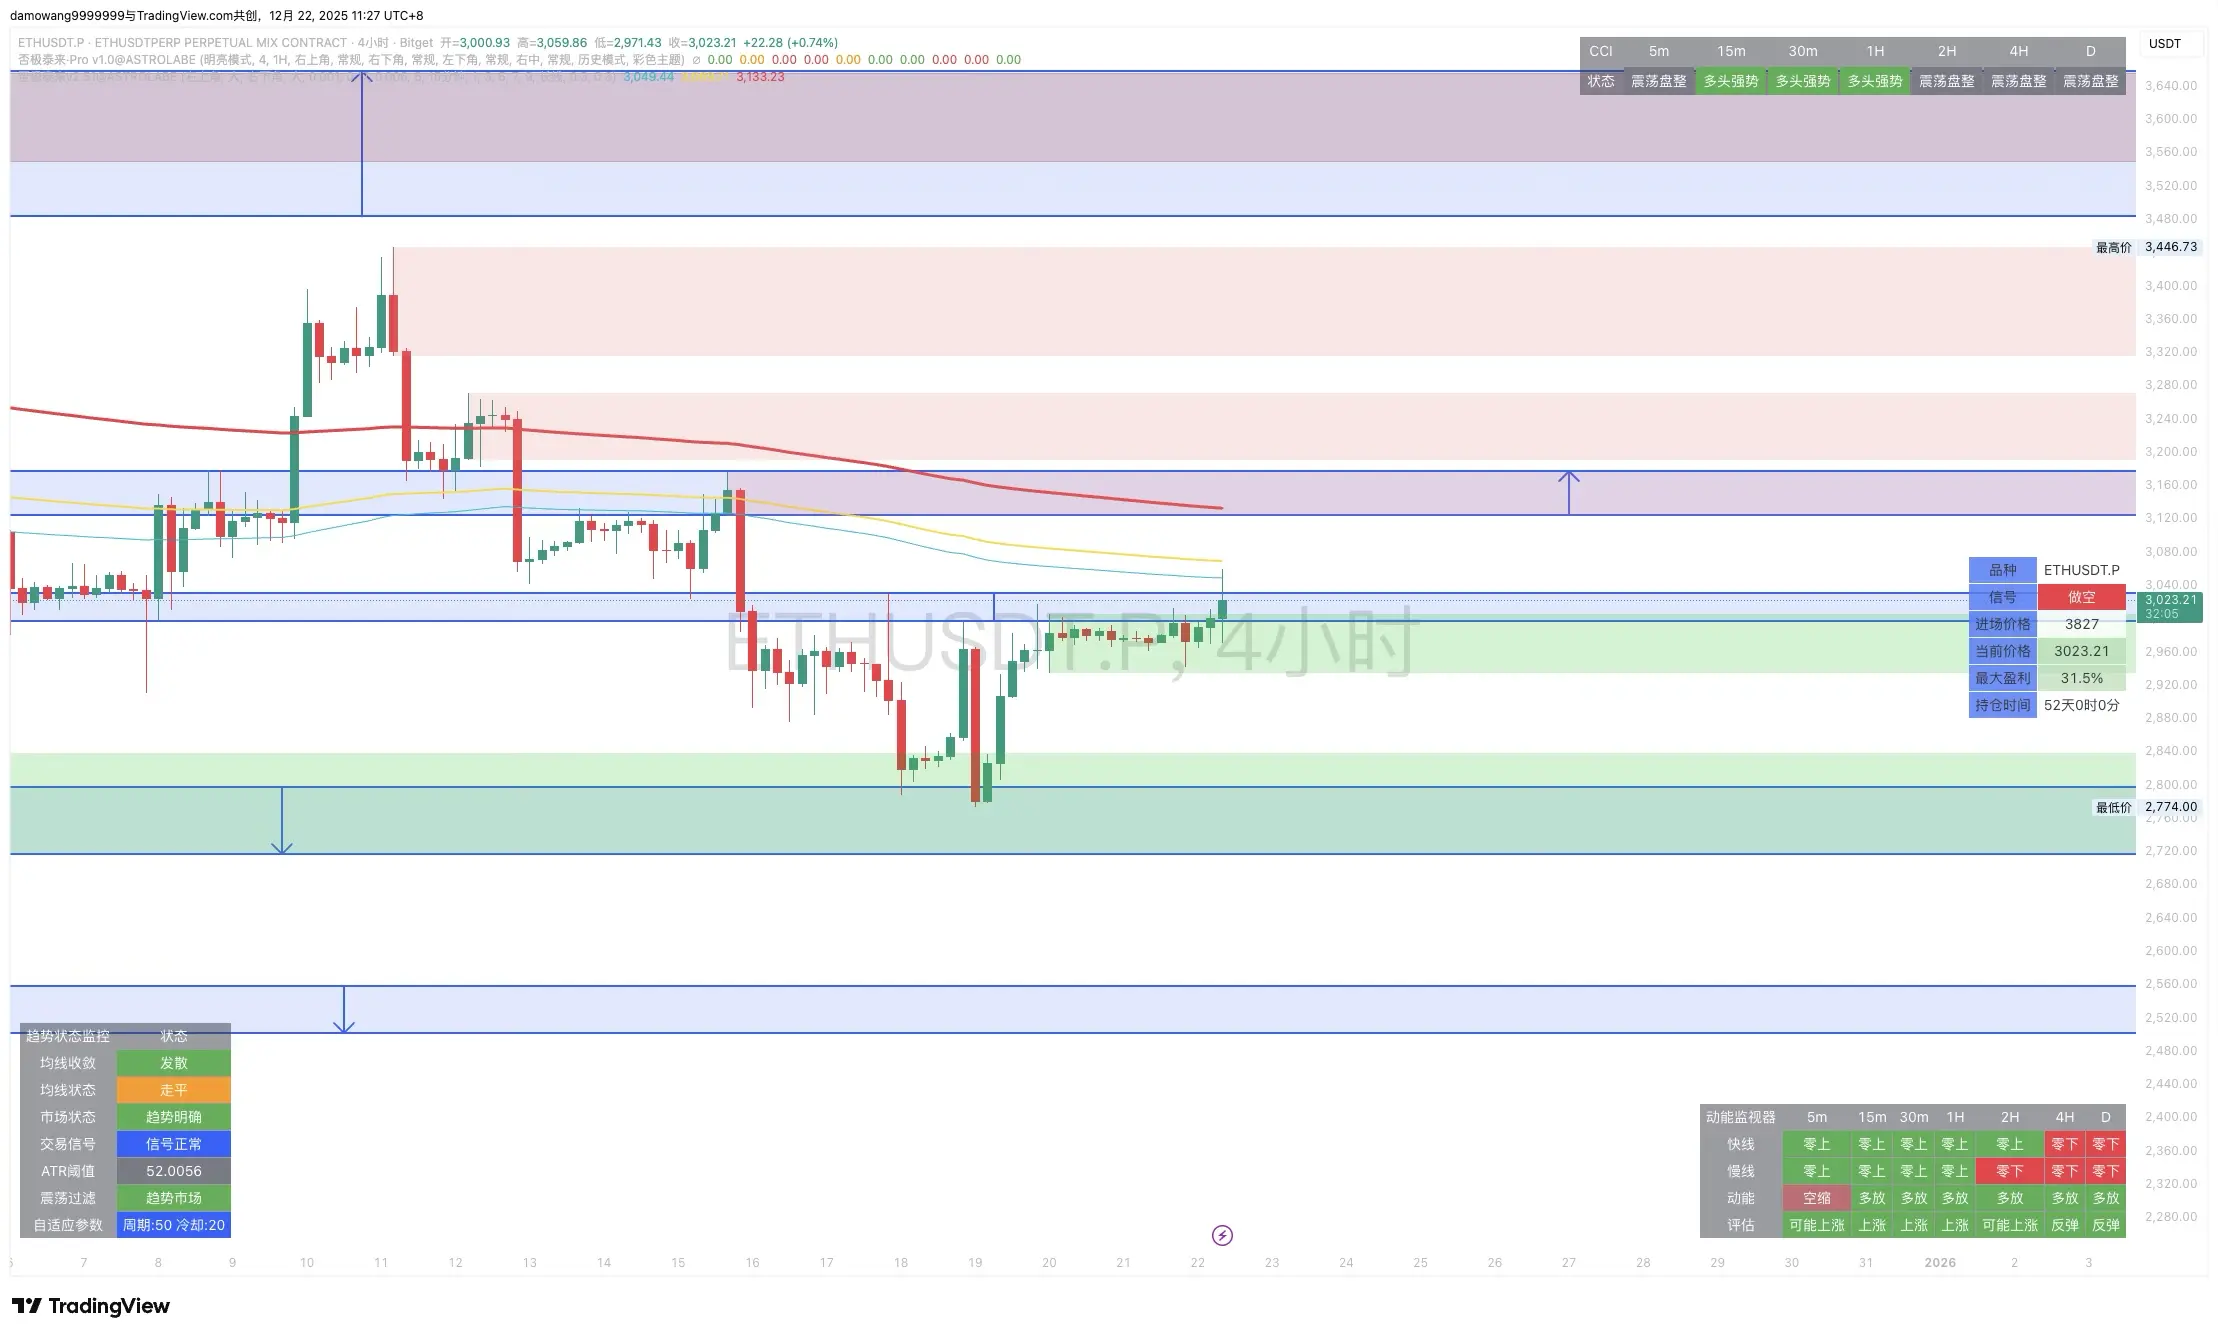
#ETH Intraday Analysis
1️⃣ The overall structure remains in a weak state. Recent prices have not successfully broken above the $3000 level, indicating that the bulls lack the strength to sustain a rebound. The price has fallen back from previous highs to an important short-term support zone, and the directional trend is unclear. Overall, ETH's short-term structure leans towards consolidation and weakness rather than establishing a solid upward trend.
2️⃣ Capital flow & on-chain & exchange activity show weak demand side: ETH market funds are cautious, overall risk appetite has decreased, and t
View Original1️⃣ The overall structure remains in a weak state. Recent prices have not successfully broken above the $3000 level, indicating that the bulls lack the strength to sustain a rebound. The price has fallen back from previous highs to an important short-term support zone, and the directional trend is unclear. Overall, ETH's short-term structure leans towards consolidation and weakness rather than establishing a solid upward trend.
2️⃣ Capital flow & on-chain & exchange activity show weak demand side: ETH market funds are cautious, overall risk appetite has decreased, and t
- Reward
- 1
- Comment
- Repost
- Share
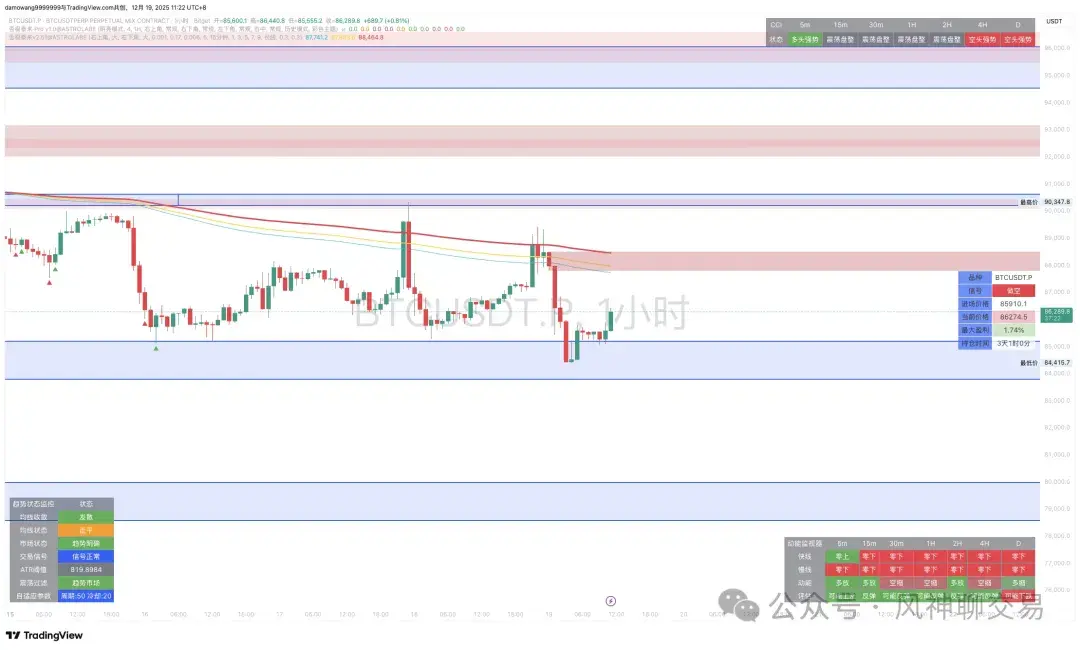
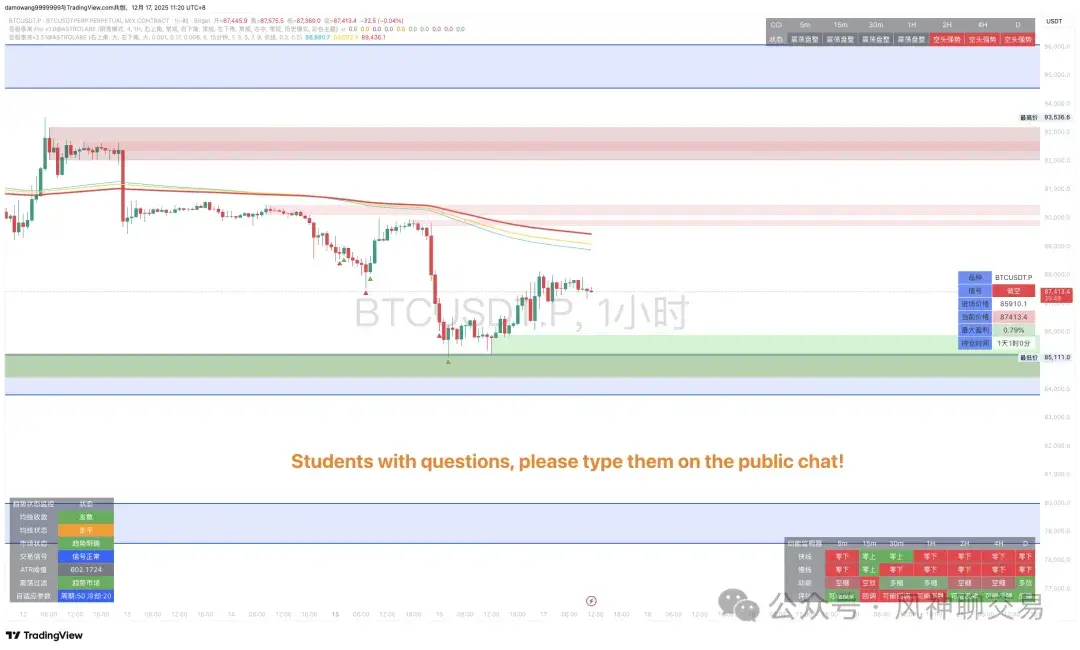
#BTC Intraday Analysis
1️⃣ Structural Interpretation: Bitcoin price briefly surged close to 90,000 last night before quickly falling back. Currently, it is oscillating around the 85,000–87,000 USD range. This decline is not driven by liquidation-induced leverage clearing but more resembles macro sentiment and persistent selling pressure suppressing the market. The price failed to form an effective rebound and was repeatedly blocked at resistance levels, remaining within a short- to medium-term downward channel. In the short term, key support levels have not been strongly held. If the 84,000 l
1️⃣ Structural Interpretation: Bitcoin price briefly surged close to 90,000 last night before quickly falling back. Currently, it is oscillating around the 85,000–87,000 USD range. This decline is not driven by liquidation-induced leverage clearing but more resembles macro sentiment and persistent selling pressure suppressing the market. The price failed to form an effective rebound and was repeatedly blocked at resistance levels, remaining within a short- to medium-term downward channel. In the short term, key support levels have not been strongly held. If the 84,000 l
BTC-0.21%
- Reward
- 1
- Comment
- Repost
- Share
#ETH Intraday Analysis
1️⃣ Structure Analysis of ETH Trend: "Weakness Fully Displayed, Continual Decline." The price not only broke below 2915 but also led the decline across the entire cryptocurrency market, indicating its current extreme weakness. However, the target level of 2800 has finally been reached.
2️⃣ Capital Flow & On-Chain & Exchange Dynamics (Additional Negative News): The Layer 2 sector led the market decline today, with an overall drop of nearly 7%, and several projects experienced double-digit declines. As a core narrative in the Ethereum ecosystem, the collapse of the L2 sec
View Original1️⃣ Structure Analysis of ETH Trend: "Weakness Fully Displayed, Continual Decline." The price not only broke below 2915 but also led the decline across the entire cryptocurrency market, indicating its current extreme weakness. However, the target level of 2800 has finally been reached.
2️⃣ Capital Flow & On-Chain & Exchange Dynamics (Additional Negative News): The Layer 2 sector led the market decline today, with an overall drop of nearly 7%, and several projects experienced double-digit declines. As a core narrative in the Ethereum ecosystem, the collapse of the L2 sec
- Reward
- 1
- Comment
- Repost
- Share
#BTC Intraday Analysis
1️⃣ Structural Interpretation: Currently, the price is testing around 85,000 again. The recent decline is driven by persistent spot selling rather than high leverage liquidations. This "slow bleeding" pattern is harder to reverse than a rapid drop. The 84,000 support level has been broken, with the largest decline reaching around 77,500.
2️⃣ Capital Flow & On-Chain & Exchange Dynamics: On-chain data (core bearish signal): Long-term holders (LTH) are cashing out at the fastest rate in over five years. Data shows that the past 30 days have been one of the most intense per
BTC-0.21%
- Reward
- 2
- 1
- Repost
- Share
Jomask :
:
Can you create a bot that will follow your statement?#ETH Intraday Analysis
1️⃣ Structure Interpretation of ETH Movement: "Clearly weaker than the broader market, with weak rebounds after breaking down." The price broke below the 3000-2920 range, and the rebound was much smaller compared to Bitcoin and other mainstream coins, confirming its short-term leading decline position. ETH needs to first regain this level and re-establish above 3000 to reverse the extremely weak situation; otherwise, it will continue to seek support lower.
2️⃣ Capital Flow & On-Chain & Exchange Dynamic Capital Flows (Core Pressure Sources): Capital outflow is more sever
View Original1️⃣ Structure Interpretation of ETH Movement: "Clearly weaker than the broader market, with weak rebounds after breaking down." The price broke below the 3000-2920 range, and the rebound was much smaller compared to Bitcoin and other mainstream coins, confirming its short-term leading decline position. ETH needs to first regain this level and re-establish above 3000 to reverse the extremely weak situation; otherwise, it will continue to seek support lower.
2️⃣ Capital Flow & On-Chain & Exchange Dynamic Capital Flows (Core Pressure Sources): Capital outflow is more sever
- Reward
- 1
- Comment
- Repost
- Share
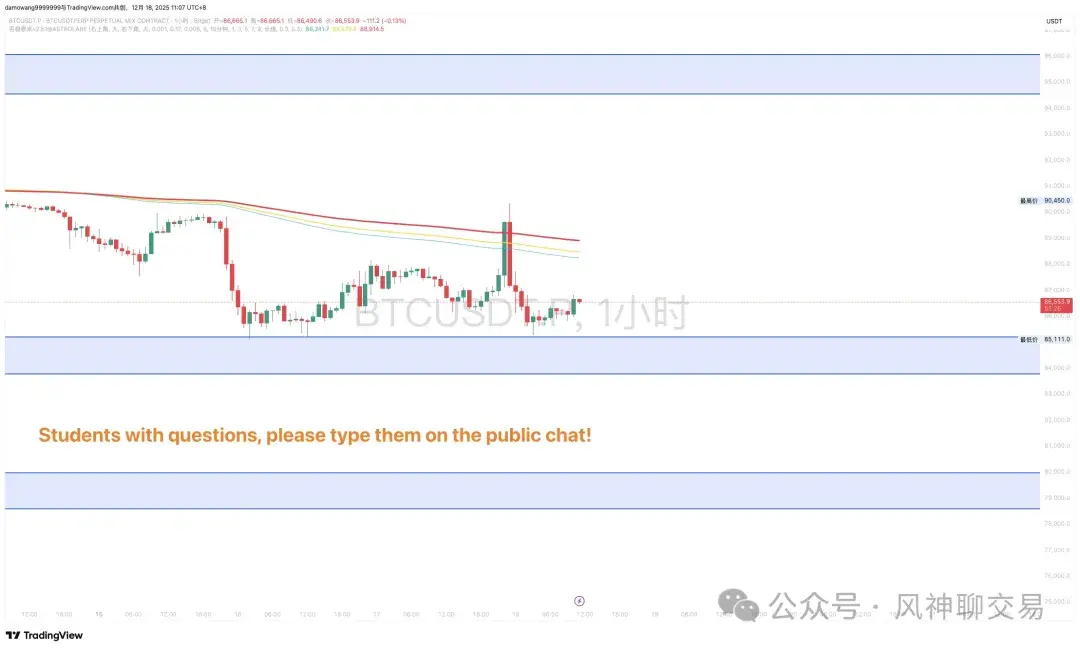
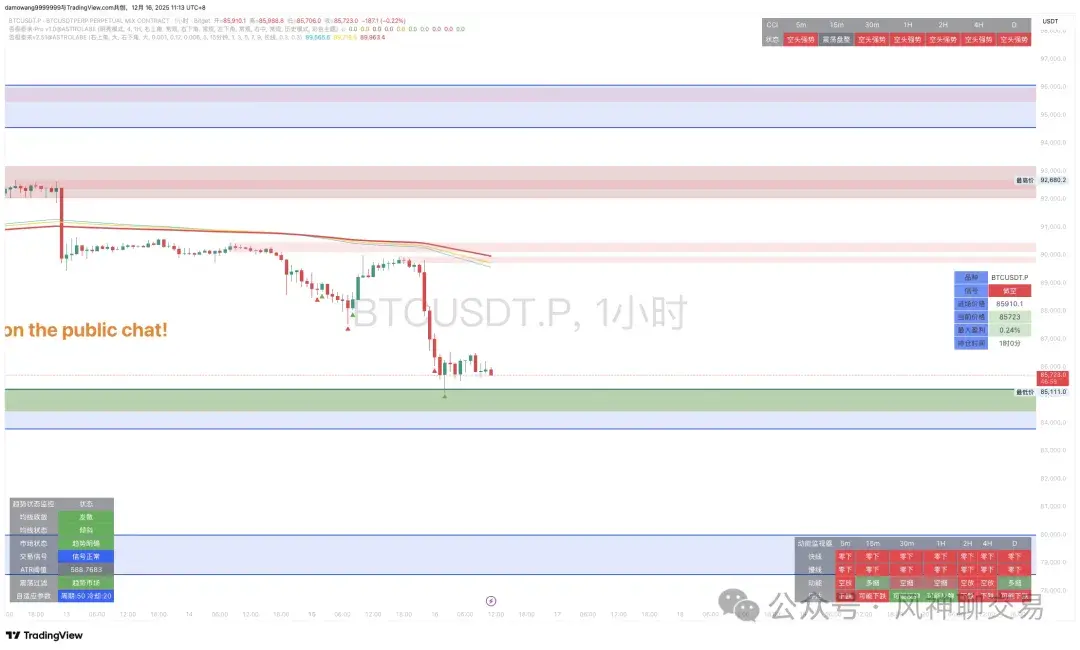
#BTC Intraday Analysis
1️⃣ Structural Interpretation: Around 85,000 is supported by short-term buying, but the rebound is limited and constrained near 88,000. If it cannot recover, the rebound will only be a correction within a downtrend, and the market structure remains fragile. Breaking below 80,000 will significantly increase the risk of further decline.
2️⃣ Capital Flow & On-Chain & Exchange Dynamics (Persistent Bearishness): Institutional funds are still withdrawing. On Monday (December 16), the US spot Bitcoin ETF recorded a net outflow of $357.7 million, forming a stark divergence with
BTC-0.21%
- Reward
- 1
- Comment
- Repost
- Share
#ETH Intraday Analysis
1️⃣ Structural Interpretation: If the 1-hour candle breaks below 2910, then we should next focus on around 2800, which means traders holding short positions can aim for around 2800.
2️⃣ Capital Flow & On-Chain & Exchange Dynamics: The market is showing a polarized situation. Negative: High leverage longs are experiencing severe liquidations, with well-known investors' longs already liquidated, indicating extreme market fragility. Positive: Last week, US spot Ethereum ETF recorded a net inflow of $209 million, and exchange ETH reserves have fallen to a historic low of 8.
View Original1️⃣ Structural Interpretation: If the 1-hour candle breaks below 2910, then we should next focus on around 2800, which means traders holding short positions can aim for around 2800.
2️⃣ Capital Flow & On-Chain & Exchange Dynamics: The market is showing a polarized situation. Negative: High leverage longs are experiencing severe liquidations, with well-known investors' longs already liquidated, indicating extreme market fragility. Positive: Last week, US spot Ethereum ETF recorded a net inflow of $209 million, and exchange ETH reserves have fallen to a historic low of 8.
- Reward
- 1
- Comment
- Repost
- Share
#BTC Intraday Analysis
1️⃣ Structural Interpretation: Bitcoin experienced a continuous decline last night, with over a hundred million long positions liquidated. This is the first time since December 7th that it has returned near 85,000, and selling pressure in the market has sharply increased. The bearish force holds an absolute dominance. The market is evolving from a “bullish correction” to a “deep correction,” urgently requiring a new strong support zone to organize defense.
2️⃣ Capital Flow & On-Chain & Exchange Dynamics: Capital flow and macro factors indicate tightening market liquidit
BTC-0.21%
- Reward
- 1
- Comment
- Repost
- Share
#ETH Intraday Analysis
1️⃣ Structure Interpretation of ETH Trend: "Clearly weaker than BTC, at a critical support decision point." The price around 3400 faces clear resistance and has pulled back. Currently testing near 3150, an important on-chain support level.
2️⃣ Capital Flow & On-Chain & Exchange Dynamics On-Chain Data (Core Support Basis): According to Glassnode's on-chain cluster data, approximately 2.8 million ETH are held at an average cost around $3,150, forming a significant "support wall." At the same time, about 3.6 million ETH are concentrated at a cost of $2,800, forming the nex
View Original1️⃣ Structure Interpretation of ETH Trend: "Clearly weaker than BTC, at a critical support decision point." The price around 3400 faces clear resistance and has pulled back. Currently testing near 3150, an important on-chain support level.
2️⃣ Capital Flow & On-Chain & Exchange Dynamics On-Chain Data (Core Support Basis): According to Glassnode's on-chain cluster data, approximately 2.8 million ETH are held at an average cost around $3,150, forming a significant "support wall." At the same time, about 3.6 million ETH are concentrated at a cost of $2,800, forming the nex
- Reward
- 2
- Comment
- Repost
- Share
#BTC Intraday Analysis
1️⃣ Structural Interpretation: The daily chart now clearly indicates a rebound need. Regarding the golden cross on the daily chart, we need to pay attention to whether it runs in a sideways or slightly expanded manner, or if it directly initiates a strong upward move followed by a quick decline.
2️⃣ Macro Influence of Capital Flow, On-Chain Data & Exchange Dynamics: Despite the Fed's rate cut, its hawkish warnings on inflation have sparked market concerns about subsequent easing steps, leading to risk asset sell-offs. Meanwhile, the Fed resuming Treasury purchases (
BTC-0.21%
- Reward
- 2
- Comment
- Repost
- Share
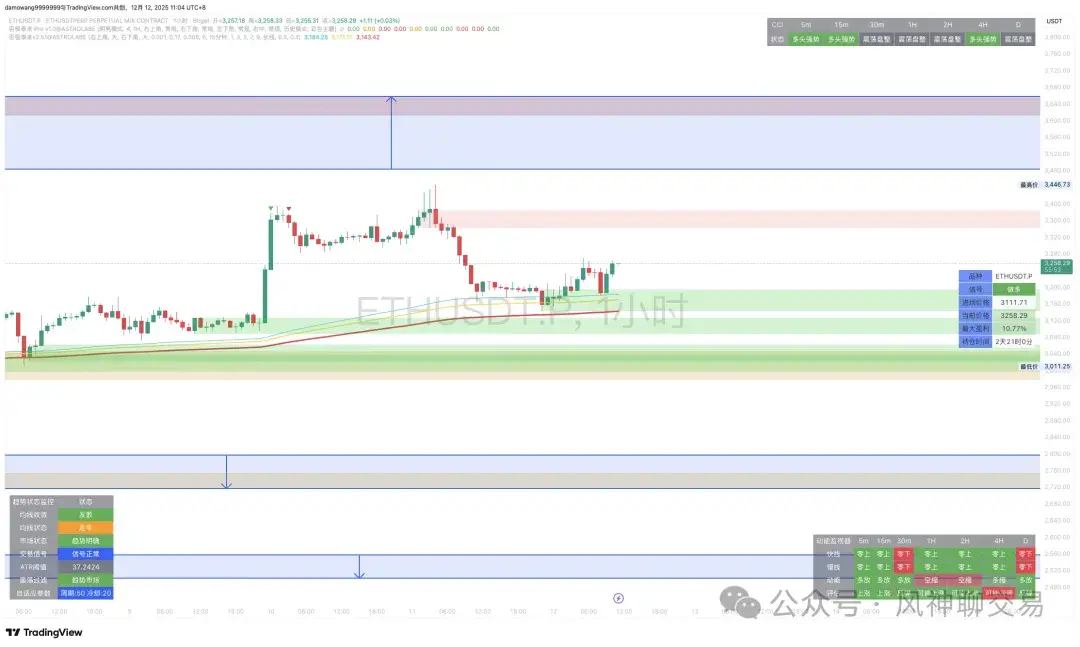
#ETH Intraday Analysis
1️⃣ Structural Interpretation: ETH’s trend has followed BTC in breaking below 3300, but on-chain data shows that whales are actively accumulating during the pullback, indicating that large funds recognize the current price levels as valuable. Next, observe whether the price can be effectively supported at 3000-2900.
2️⃣ Capital Flow & On-Chain & Exchange Dynamics: Whale behavior (key difference): Multiple whale addresses have significantly increased holdings during the price correction. The “insider whale” has added over 19,000 ETH, and major holder BitMine has also inc
View Original1️⃣ Structural Interpretation: ETH’s trend has followed BTC in breaking below 3300, but on-chain data shows that whales are actively accumulating during the pullback, indicating that large funds recognize the current price levels as valuable. Next, observe whether the price can be effectively supported at 3000-2900.
2️⃣ Capital Flow & On-Chain & Exchange Dynamics: Whale behavior (key difference): Multiple whale addresses have significantly increased holdings during the price correction. The “insider whale” has added over 19,000 ETH, and major holder BitMine has also inc

- Reward
- 1
- Comment
- Repost
- Share
#BTC Intraday Analysis
1️⃣ Structural interpretation indicates a technical correction after the bullish realization, currently testing around 89,500. Once broken downward, it could head straight to around 85,000.
2️⃣ Macro tone of capital flow, on-chain, and exchange dynamics: The Federal Reserve's rate cut has been fully priced in, with Chair Powell's remarks on future policy paths becoming the new focus. Any "hawkish" hints (such as cautiousness on further rate cuts) may suppress risk assets. On-chain support: Supply side continues to tighten, with over 403,000 BTC leaving exchanges this we
BTC-0.21%
- Reward
- 1
- Comment
- Repost
- Share