#ETHBackAbove1900
# ETH Market Deep Analysis — Bull Trap or Real Recovery?
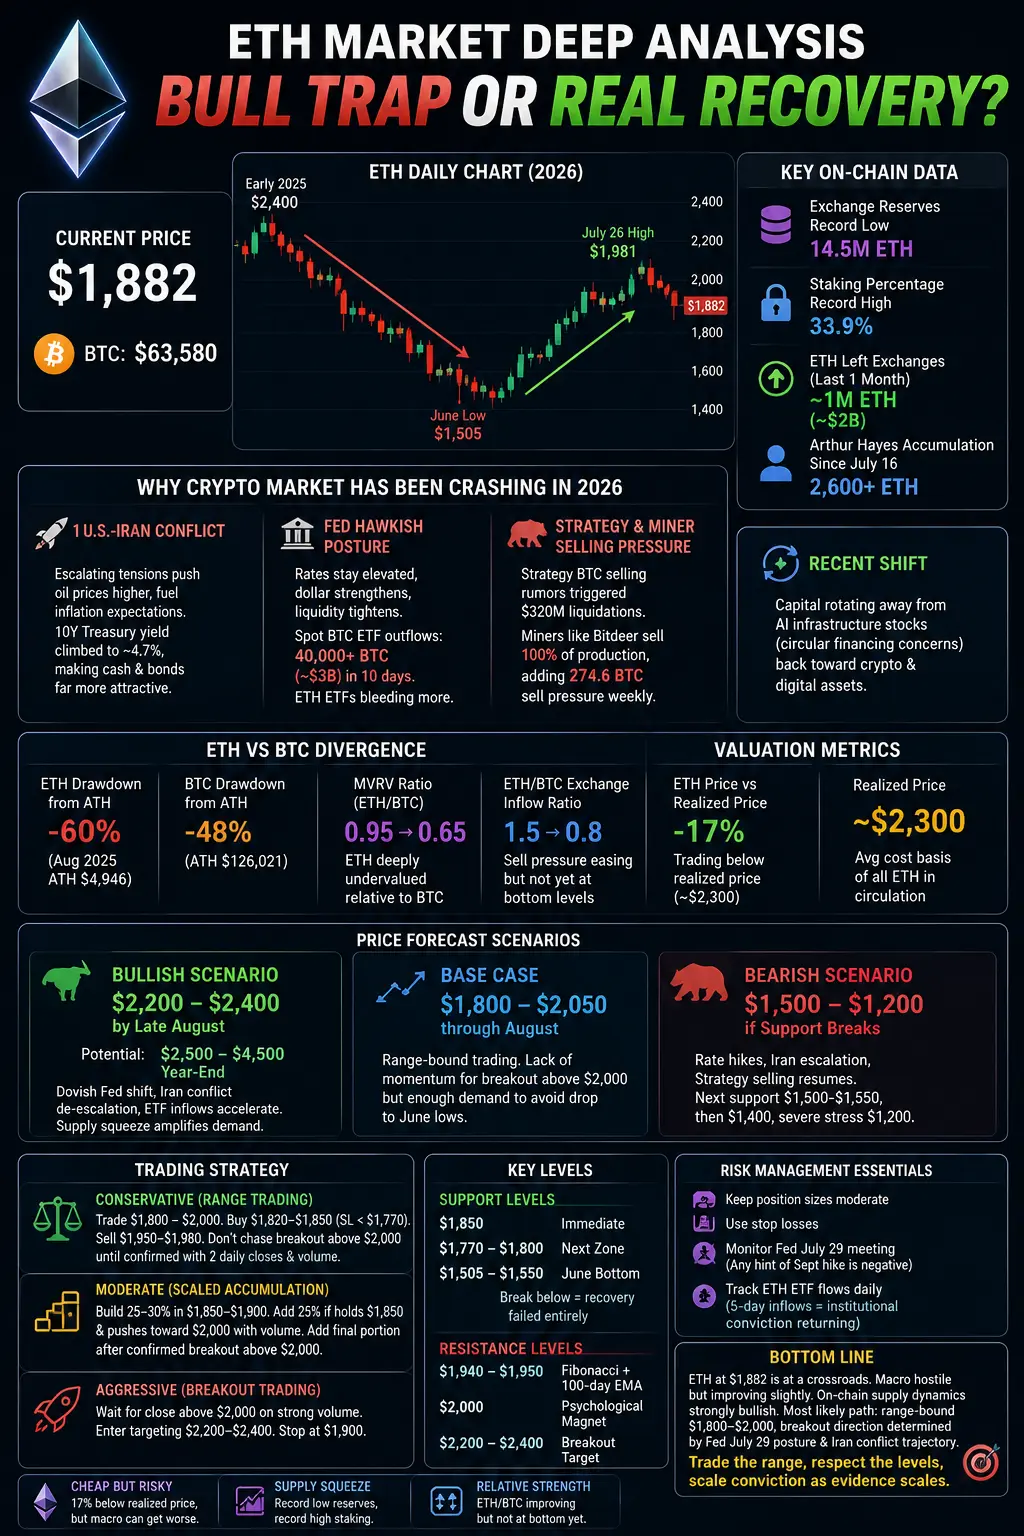
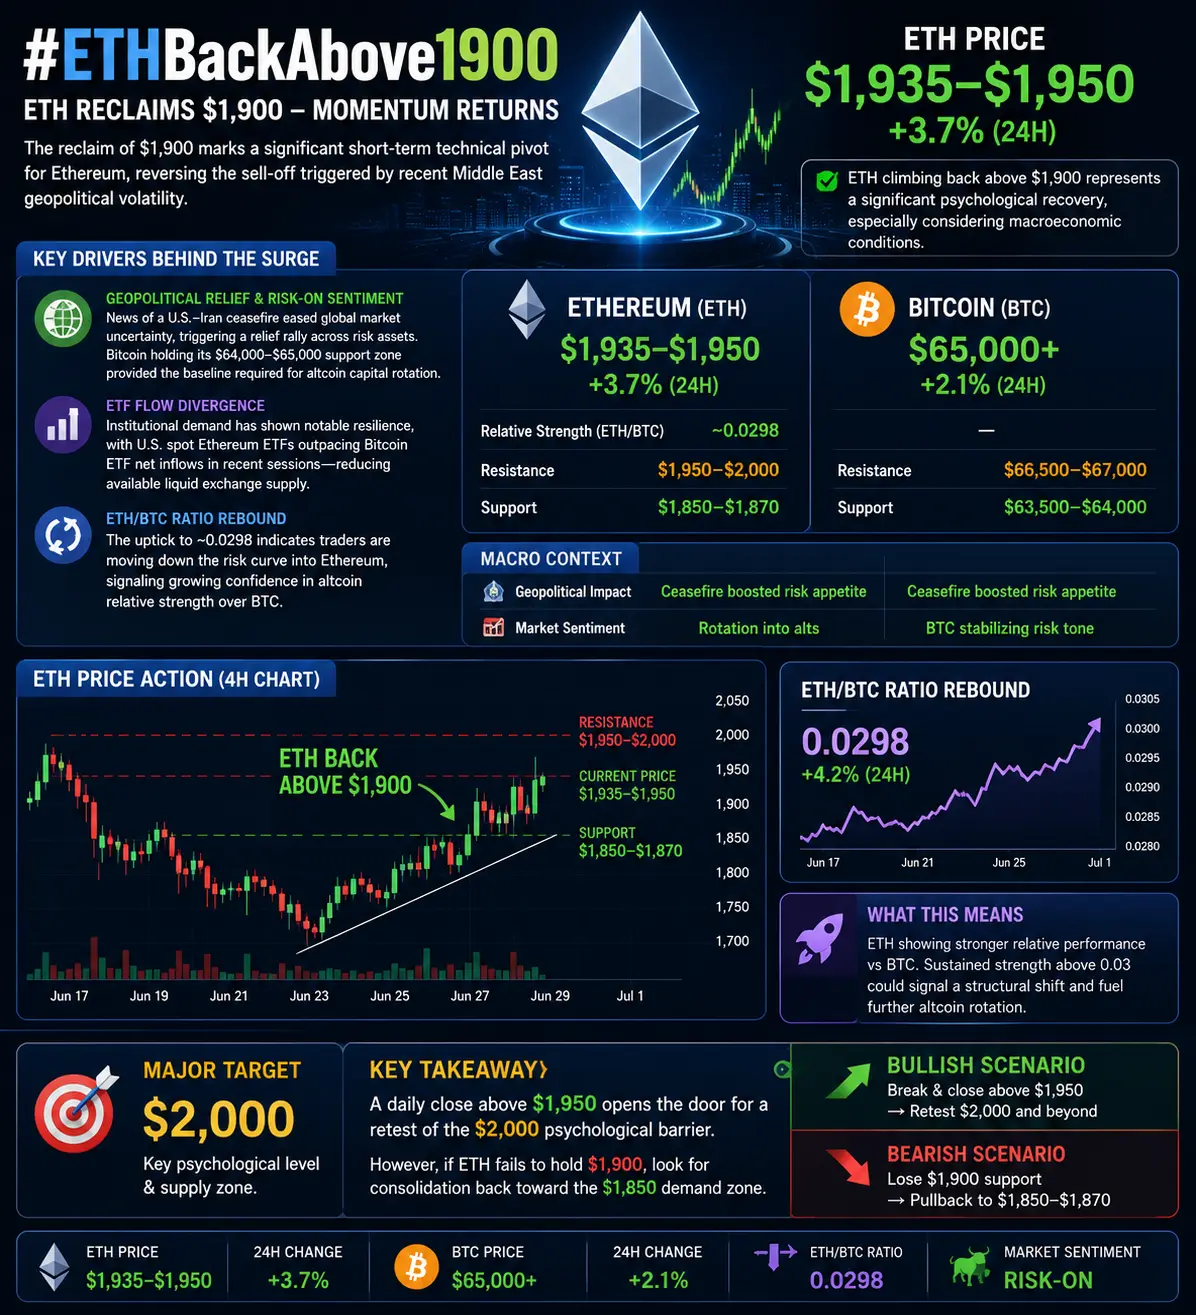
Ethereum is trading at approximately $1,882 right now, with Bitcoin hovering near $63,580. The broader crypto market has been in a relentless downtrend throughout 2026, and the question every trader is asking is: are we watching a genuine recovery unfold, or is this just another bull trap before the next leg down?
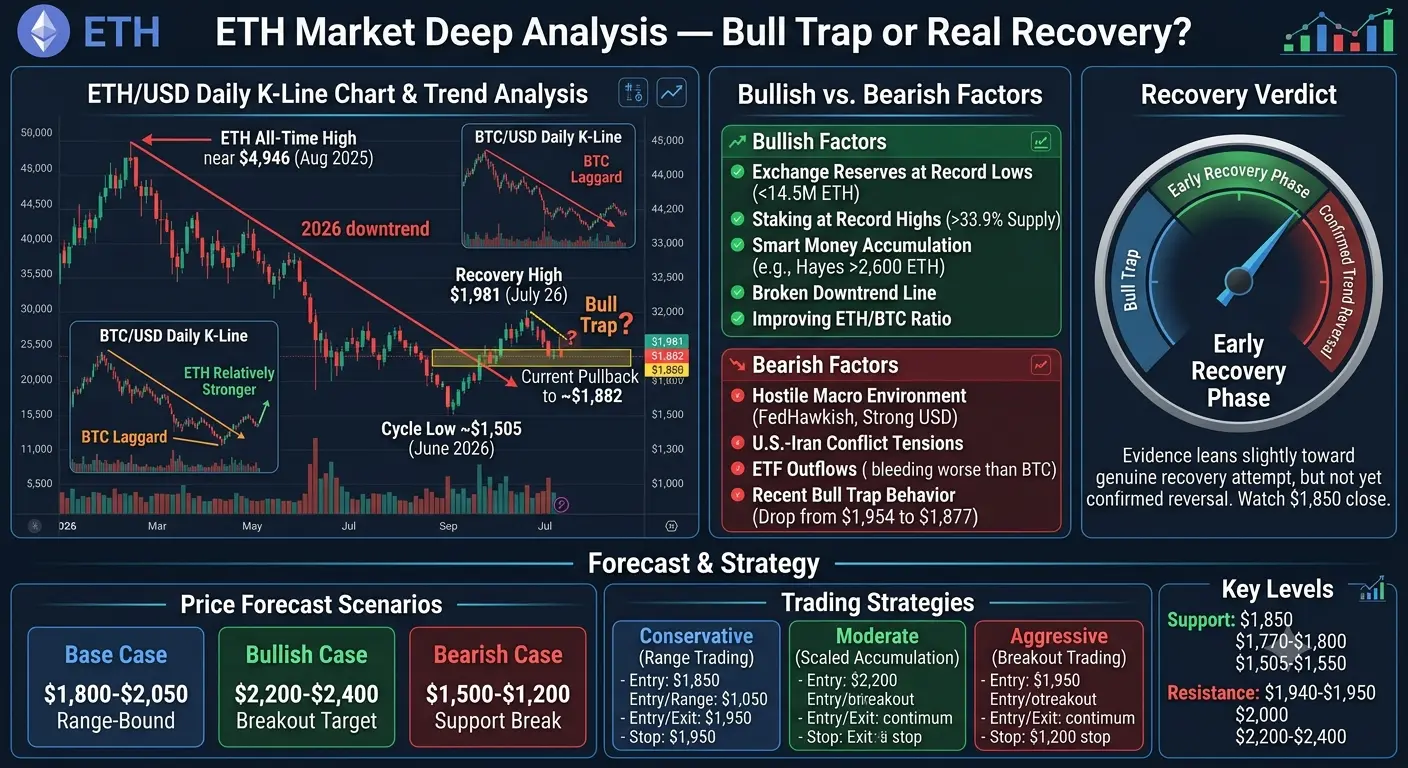
Looking at the daily K-line data, ETH touched its cycle low at around $1,505 in late June, after a devastating crash from the $2,400 range. From that bottom, ETH staged a recovery climbing back above $1,900 and touching $1,981 on July 26. But the past two days have seen selling pressure return, dropping from $1,954 back to $1,877. This pullback after a multi-week rally makes the current setup tricky to interpret.
Why the Crypto Market Has Been Crashing
The 2026 crash is driven by three powerful forces that converged simultaneously.
First, the U.S.-Iran conflict has been the largest macro shock. Military tensions escalated early 2026, pushing oil prices higher and feeding into inflation expectations. Higher energy costs mean the Fed cannot cut rates even though some inflation data has cooled. The 10-year Treasury yield has climbed to around 4.7%, making cash or bonds far more attractive than speculating on volatile digital assets.
Second, the Fed's hawkish posture has created a liquidity squeeze. Rates stay elevated, the dollar strengthens, and a stronger dollar correlates with weaker crypto. Spot Bitcoin ETFs saw net outflows exceeding 40,000 BTC totaling approximately $3 billion over ten consecutive trading days in May-June. ETH ETFs have been bleeding even worse.
Third, Strategy Bitcoin selling rumors broke the narrative of relentless institutional accumulation. The immediate aftermath saw $320 million in liquidations and cascade selling from whales. Mining companies like Bitdeer are selling 100% of weekly production, adding 274.6 BTC of sell pressure weekly.
An interesting recent shift: capital rotating away from AI infrastructure stocks back toward crypto. Chip stocks came under pressure over circular financing concerns, and some displaced capital is flowing back into digital assets.
ETH Specific — Why Ethereum Has Been the Laggard
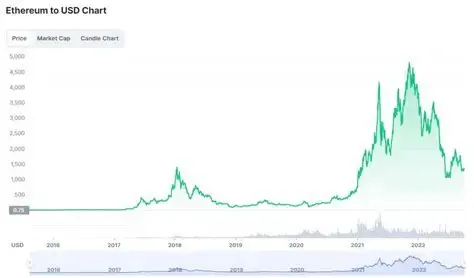
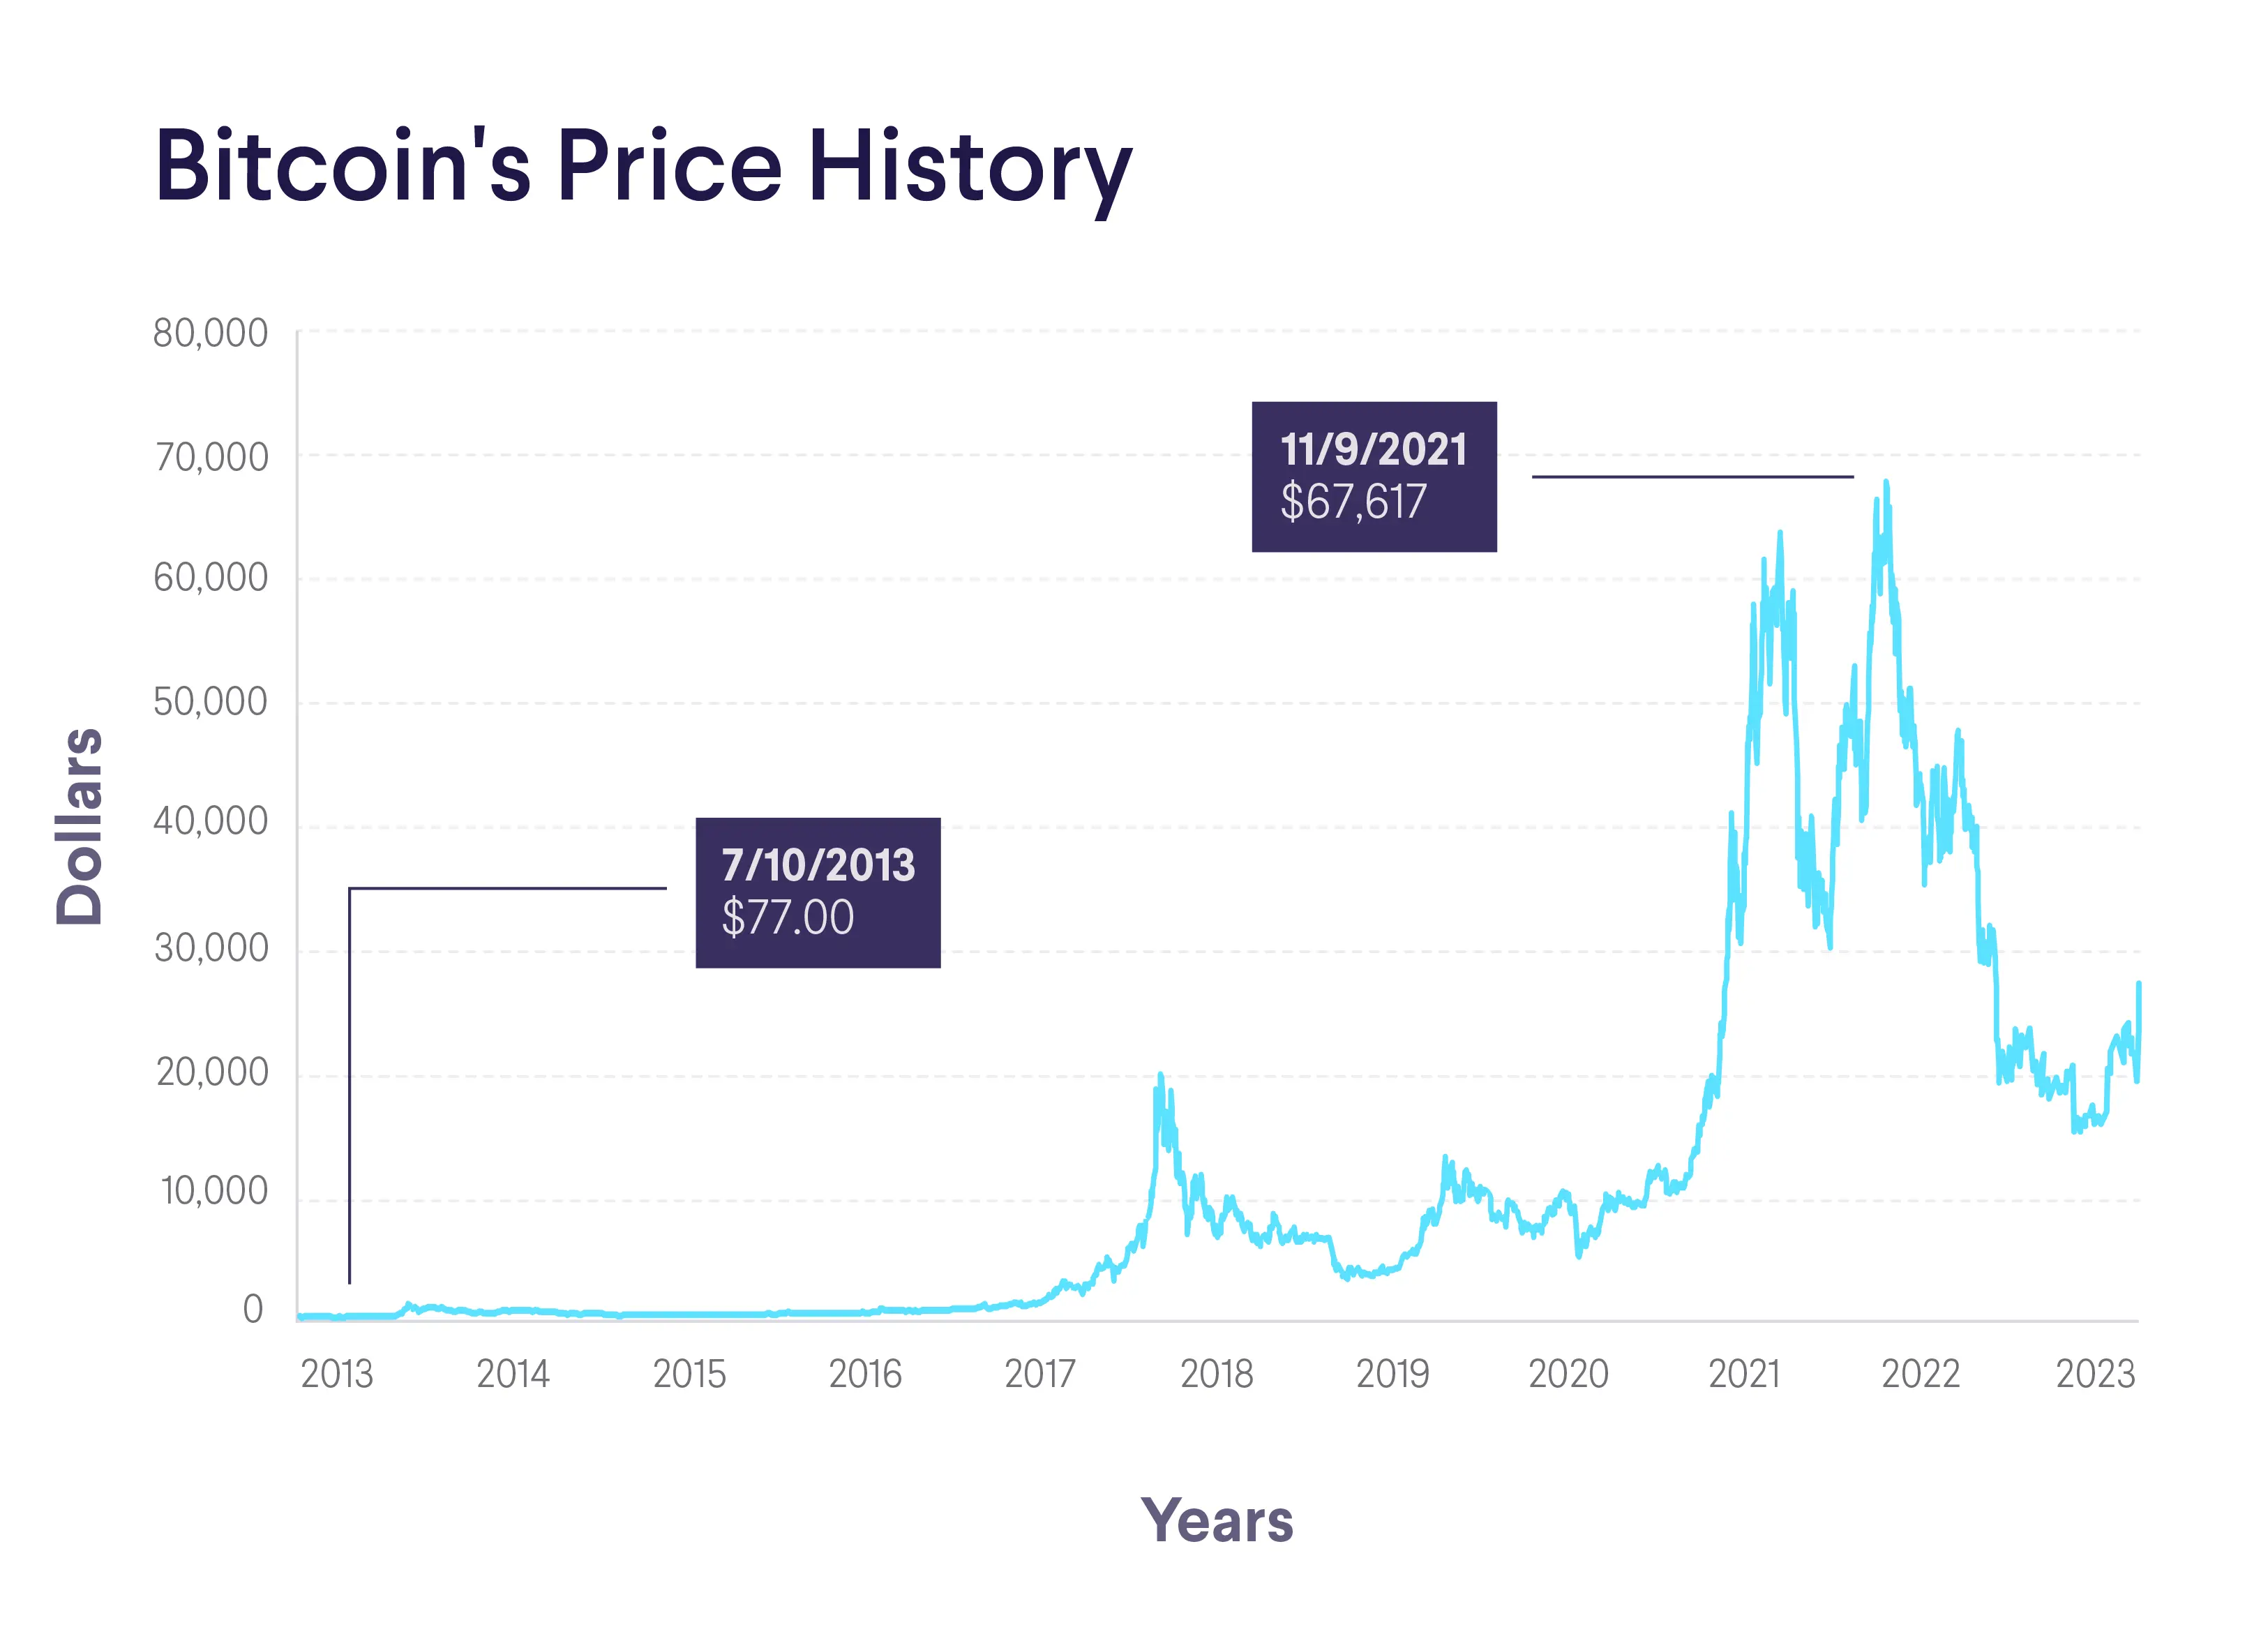
ETH is down approximately 60% from its August 2025 ATH near $4,946, while BTC has fallen roughly 48% from its $126,021 peak. That gap shows how institutional capital treats BTC as the safer asset in risk-off environments, and ETH as the speculative alternative that gets cut first.
On-chain data presents a contradictory picture. Exchange reserves hit a record low of 14.5 million ETH in June. Nearly 1 million ETH worth $2 billion left exchanges over the past month. Staking reached a record 33.9% of total supply. Arthur Hayes has accumulated over 2,600 ETH since July 16, including 1,332.5 ETH worth $2.53 million in a single purchase.
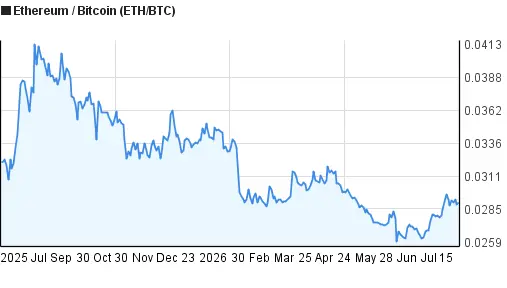
ETH is trading approximately 17% below its realized price of around $2,300, meaning most holders are underwater. Historically, trading well below realized price has often marked zones where recoveries begin. The MVRV ratio relative to BTC has fallen from 0.95 to 0.65, meaning ETH is deeply undervalued relative to BTC. The ETH/BTC exchange inflow ratio has dropped from 1.5 to 0.8, indicating sell pressure is easing but not yet at confirmed bottom levels.
Price Forecast
Base Case ($1,800-$2,050 through August): The most probable outcome is range-bound trading. ETH has touched $1,981 but failed to hold above $1,950 for more than a day. The market lacks momentum to sustain a breakout above $2,000 but has enough demand to prevent collapse back to June lows.
Bullish ($2,200-$2,400 by late August, potentially $2,500-$4,500 year-end): If the Fed signals a dovish shift, the Iran conflict de-escalates, or ETF inflows accelerate, ETH could break above $2,000 and rally toward $2,200-$2,400 quickly. Standard Chartered targets $4,000 year-end, Fundstrat $4,500, Citi $3,175. The supply squeeze from record-low exchange reserves and record-high staking would amplify any demand increase dramatically.
Bearish ($1,500-$1,200 if support breaks): If the Fed raises rates in September, Iran conflict escalates further, or Strategy resumes selling, another liquidation cascade could follow. Next support sits at $1,500-$1,550 (June bottom zone). Below that, $1,400, and in severe stress, potentially $1,200.
Bull Trap or Real Recovery?
Evidence leans slightly toward a genuine recovery attempt, but it is not yet a confirmed trend reversal.
Arguments for Bull Trap: Macro remains hostile. Every 2026 rally has failed at resistance. The recent drop from $1,954 to $1,877 in two days is classic bull trap behavior.
Arguments for Genuine Recovery: Exchange reserves at record lows, staking at record highs, $2 billion left exchanges recently. Smart money is accumulating. ETH broke its year-long downtrend line on July 21. Five consecutive days of ETF inflows around that date showed institutional shift. ETH/BTC relative strength is improving.
Balanced view: This is likely the early stage of a recovery, but not a confirmed reversal. Watch $1,850 closely. If ETH holds above it on this pullback, recovery gains strength. If it breaks below $1,800 with volume, bull trap becomes more likely.
Trading Strategy
Conservative (Range Trading): Trade $1,800-$2,000. Buy near $1,820-$1,850 with stops below $1,770. Sell near $1,950-$1,980. Do not chase breakout above $2,000 until confirmed with two consecutive daily closes and rising volume.
Moderate (Scaled Accumulation): Build 25-30% allocation in $1,850-$1,900 zone. Add 25% if ETH holds $1,850 and pushes toward $2,000 with volume. Add final portion after confirmed breakout above $2,000.
Aggressive (Breakout Trading): Wait for confirmed close above $2,000 on strong volume, then enter targeting $2,200-$2,400. Stop at $1,900.
Risk essentials: Keep position sizes moderate. Use stop losses. Monitor the Fed's July 29 meeting — any hint of a September hike is negative. Track ETH ETF flows daily — sustained five-day inflows signal institutional conviction returning.
How High Can ETH Go?
Realistic targets: $2,000 as the first hurdle, $2,200-$2,400 as breakout target, $2,500 as stretch target for late August. Anything beyond $2,500 this summer requires a significant macro shift not yet visible.
Longer-term, Standard Chartered's $4,000 and Fundstrat's $4,500 year-end targets are based on ETH becoming the dominant settlement layer for stablecoins and tokenized assets. Current price at $1,882 represents a deep discount relative to structural valuations.
Key Levels
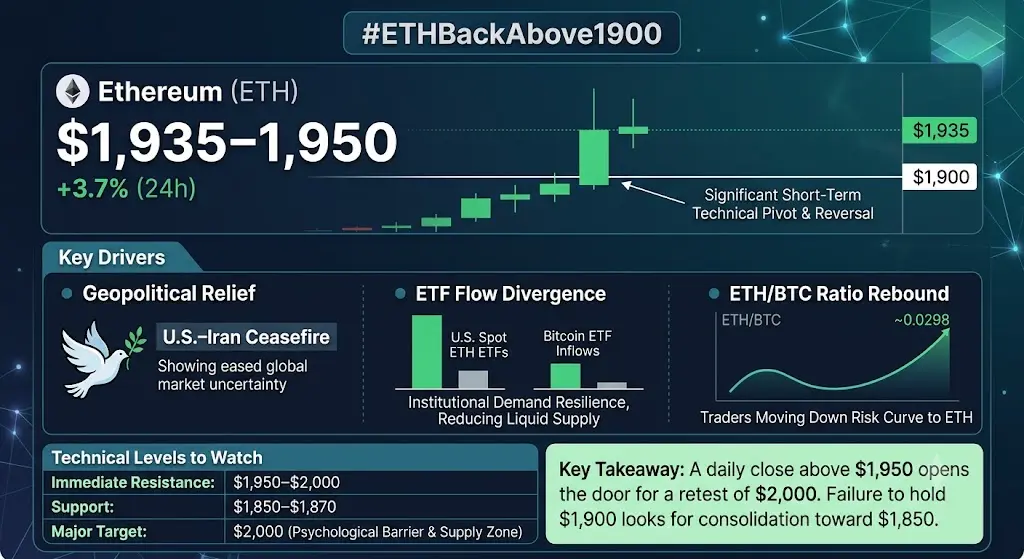
Support: $1,850 immediate, $1,770-$1,800 next zone, $1,505-$1,550 June bottom — break below signals recovery failed entirely.
Resistance: $1,940-$1,950 immediate (Fibonacci + 100-day EMA), $2,000 psychological magnet, $2,200-$2,400 breakout target.
ETH/BTC ratio is improving — this relative strength is necessary for any ETH-specific recovery.
Botom Line
ETH at $1,882 is at a crossroads. Macro is hostile but improving slightly. On-chain supply dynamics are strongly bullish. Technicals show a broken downtrend but stalled momentum. Most likely path: weeks of range-bound trading between $1,800-$2,000, with breakout direction determined by the Fed's July 29 posture and the Iran conflict trajectory.
#SummerCreationCamp @Gate_Square
# ETH Market Deep Analysis — Bull Trap or Real Recovery?
Ethereum is trading at approximately $1,882 right now, with Bitcoin hovering near $63,580. The broader crypto market has been in a relentless downtrend throughout 2026, and the question every trader is asking is: are we watching a genuine recovery unfold, or is this just another bull trap before the next leg down?
Looking at the daily K-line data, ETH touched its cycle low at around $1,505 in late June, after a devastating crash from the $2,400 range. From that bottom, ETH staged a recovery climbing back above $1,900 and touching $1,981 on July 26. But the past two days have seen selling pressure return, dropping from $1,954 back to $1,877. This pullback after a multi-week rally makes the current setup tricky to interpret.
Why the Crypto Market Has Been Crashing
The 2026 crash is driven by three powerful forces that converged simultaneously.
First, the U.S.-Iran conflict has been the largest macro shock. Military tensions escalated early 2026, pushing oil prices higher and feeding into inflation expectations. Higher energy costs mean the Fed cannot cut rates even though some inflation data has cooled. The 10-year Treasury yield has climbed to around 4.7%, making cash or bonds far more attractive than speculating on volatile digital assets.
Second, the Fed's hawkish posture has created a liquidity squeeze. Rates stay elevated, the dollar strengthens, and a stronger dollar correlates with weaker crypto. Spot Bitcoin ETFs saw net outflows exceeding 40,000 BTC totaling approximately $3 billion over ten consecutive trading days in May-June. ETH ETFs have been bleeding even worse.
Third, Strategy Bitcoin selling rumors broke the narrative of relentless institutional accumulation. The immediate aftermath saw $320 million in liquidations and cascade selling from whales. Mining companies like Bitdeer are selling 100% of weekly production, adding 274.6 BTC of sell pressure weekly.
An interesting recent shift: capital rotating away from AI infrastructure stocks back toward crypto. Chip stocks came under pressure over circular financing concerns, and some displaced capital is flowing back into digital assets.
ETH Specific — Why Ethereum Has Been the Laggard
ETH is down approximately 60% from its August 2025 ATH near $4,946, while BTC has fallen roughly 48% from its $126,021 peak. That gap shows how institutional capital treats BTC as the safer asset in risk-off environments, and ETH as the speculative alternative that gets cut first.
On-chain data presents a contradictory picture. Exchange reserves hit a record low of 14.5 million ETH in June. Nearly 1 million ETH worth $2 billion left exchanges over the past month. Staking reached a record 33.9% of total supply. Arthur Hayes has accumulated over 2,600 ETH since July 16, including 1,332.5 ETH worth $2.53 million in a single purchase.
ETH is trading approximately 17% below its realized price of around $2,300, meaning most holders are underwater. Historically, trading well below realized price has often marked zones where recoveries begin. The MVRV ratio relative to BTC has fallen from 0.95 to 0.65, meaning ETH is deeply undervalued relative to BTC. The ETH/BTC exchange inflow ratio has dropped from 1.5 to 0.8, indicating sell pressure is easing but not yet at confirmed bottom levels.
Price Forecast
Base Case ($1,800-$2,050 through August): The most probable outcome is range-bound trading. ETH has touched $1,981 but failed to hold above $1,950 for more than a day. The market lacks momentum to sustain a breakout above $2,000 but has enough demand to prevent collapse back to June lows.
Bullish ($2,200-$2,400 by late August, potentially $2,500-$4,500 year-end): If the Fed signals a dovish shift, the Iran conflict de-escalates, or ETF inflows accelerate, ETH could break above $2,000 and rally toward $2,200-$2,400 quickly. Standard Chartered targets $4,000 year-end, Fundstrat $4,500, Citi $3,175. The supply squeeze from record-low exchange reserves and record-high staking would amplify any demand increase dramatically.
Bearish ($1,500-$1,200 if support breaks): If the Fed raises rates in September, Iran conflict escalates further, or Strategy resumes selling, another liquidation cascade could follow. Next support sits at $1,500-$1,550 (June bottom zone). Below that, $1,400, and in severe stress, potentially $1,200.
Bull Trap or Real Recovery?
Evidence leans slightly toward a genuine recovery attempt, but it is not yet a confirmed trend reversal.
Arguments for Bull Trap: Macro remains hostile. Every 2026 rally has failed at resistance. The recent drop from $1,954 to $1,877 in two days is classic bull trap behavior.
Arguments for Genuine Recovery: Exchange reserves at record lows, staking at record highs, $2 billion left exchanges recently. Smart money is accumulating. ETH broke its year-long downtrend line on July 21. Five consecutive days of ETF inflows around that date showed institutional shift. ETH/BTC relative strength is improving.
Balanced view: This is likely the early stage of a recovery, but not a confirmed reversal. Watch $1,850 closely. If ETH holds above it on this pullback, recovery gains strength. If it breaks below $1,800 with volume, bull trap becomes more likely.
Trading Strategy
Conservative (Range Trading): Trade $1,800-$2,000. Buy near $1,820-$1,850 with stops below $1,770. Sell near $1,950-$1,980. Do not chase breakout above $2,000 until confirmed with two consecutive daily closes and rising volume.
Moderate (Scaled Accumulation): Build 25-30% allocation in $1,850-$1,900 zone. Add 25% if ETH holds $1,850 and pushes toward $2,000 with volume. Add final portion after confirmed breakout above $2,000.
Aggressive (Breakout Trading): Wait for confirmed close above $2,000 on strong volume, then enter targeting $2,200-$2,400. Stop at $1,900.
Risk essentials: Keep position sizes moderate. Use stop losses. Monitor the Fed's July 29 meeting — any hint of a September hike is negative. Track ETH ETF flows daily — sustained five-day inflows signal institutional conviction returning.
How High Can ETH Go?
Realistic targets: $2,000 as the first hurdle, $2,200-$2,400 as breakout target, $2,500 as stretch target for late August. Anything beyond $2,500 this summer requires a significant macro shift not yet visible.
Longer-term, Standard Chartered's $4,000 and Fundstrat's $4,500 year-end targets are based on ETH becoming the dominant settlement layer for stablecoins and tokenized assets. Current price at $1,882 represents a deep discount relative to structural valuations.
Key Levels
Support: $1,850 immediate, $1,770-$1,800 next zone, $1,505-$1,550 June bottom — break below signals recovery failed entirely.
Resistance: $1,940-$1,950 immediate (Fibonacci + 100-day EMA), $2,000 psychological magnet, $2,200-$2,400 breakout target.
ETH/BTC ratio is improving — this relative strength is necessary for any ETH-specific recovery.
Botom Line
ETH at $1,882 is at a crossroads. Macro is hostile but improving slightly. On-chain supply dynamics are strongly bullish. Technicals show a broken downtrend but stalled momentum. Most likely path: weeks of range-bound trading between $1,800-$2,000, with breakout direction determined by the Fed's July 29 posture and the Iran conflict trajectory.
#SummerCreationCamp @Gate_Square